- Similar to the peak of 2000, people are wondering if Buffett & Munger have lost their touch?
- As documented by CNBC, Berkshire has underperformed the S&P 500 Index by 70% as rank stock speculation has gripped markets
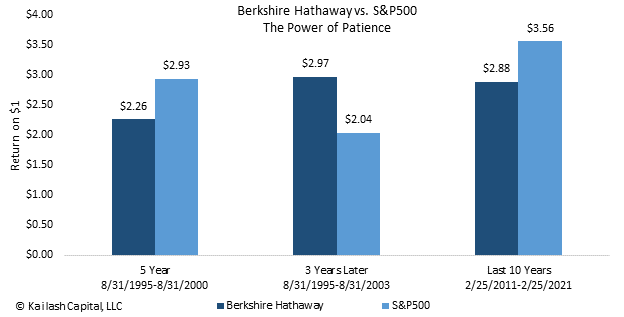
- If you had invested $1 in Berkshire and the S&P 500 in 1995, by the peak of the internet bubble you would have had $2.26 and $2.93 respectively, an underperformance of ~70% (sound familiar?)
- Roll the clock forward three years after the bubble broke, so 1995 – 2003, your $1 in Berkshire would have become $3 while your investment in the index would have fallen to $2.04!
- Over the last decade, $1 invested in Berkshire left you with $2.88 today vs. $3.56 had you invested in the S&P 500
Get our insights direct to your inbox: SUBSCRIBE
The Internet Bubble Bursts:
As Kailash has documented extensively over the last two years (here, here, and here), we fully expect an outcome similar to the bursting of the internet bubble with Berkshire marching higher while the broad index rolls over.
Get our White Papers direct to your inbox: SUBSCRIBE
Value Investing Firms Are Out of Favor…. but NOT with KCR
In the heady days of the dot com bubble, a new class of internet companies and technology stocks took Wall Street by storm. The investing philosophy of Warren Buffett, his mentor Benjamin Graham and other legendary practitioners who used a value investing strategy were dismissed as out of date. For those unfamiliar with the importance of avoiding losses, please see our Bear Traders post for a brief and brutal reminder.
We see the exact same thing happening today. A new and unproven group of fund managers running mutual funds dedicated to novel tech companies are, once again, all the rage. They invest in firms with high levels of revenue growth. Often these high-flying and fast-growing firms lack a credible business model.
The theory today is identical to what it was in 2000. The capital invested in these firms would create a “winner take all” outcome. Unfortunately for those speculating in overpriced stocks today, the history books are unforgiving about what happens over the long term. The speculative mania ends badly.
The KCR research team has been navigating bull and bear stock markets for decades. While March 10, 2000, marked the high-water mark for the internet bubble, there is nothing unique about that period or its ugly end. As we documented in our Quick Take of legendary economist John Kenneth Galbraith’s book on market manias, these episodes have been going roughly every 20 years. Since…. ancient Venice!
KCR has spent much of the last few years identifying the tremendous opportunities for investors. As speculators herd into the “shiny objects” they leave in their wake some of the most proven and profitable firms. Even better, these firms often trade cheap relative to the market.
We have documented this phenomenon in our research on Mid Cap, Small Cap and Large Cap companies in our Quick Takes and White Papers. One of our themes has emphasized investing in stocks that make stuff you need. Avoid investing in stocks that make stuff you want – particularly if they are expensive.
As our research on the Great Inflation of the 1970s showed, this philosophy worked very well in that environment. As we explained in that and many subsequent works, the good news is that today, stocks that make the things you need are often very cheap compared to makers of stuff you want.
KCR does not make macro calls. But we believe that firms which make goods you must buy trading at low prices relative to the market is a truly fantastic opportunity. While others chase profitless companies trading at impossible valuations, you can buy firms with decades if not 100+ year operating histories that are household names at bargain prices.
Our team has no idea if inflation will prove transitory. But our work, Equity Duration, has been painfully clear: if you own bonds and index funds today, you are taking immense risks. Our team has always found oil companies difficult to invest in. But that is not the case today. Visit our White Paper, Oil Stocks to Buy: A Preference for Profits Over Promises, to know more about how to buy and invest in oil stocks.
As we showed in our pieces here, here, and here, the case for investing in energy may be compelling. Aside from being cheap and at the lowest weighting in the history of the S&P 500 index, these cheap stocks offer tremendous inflation hedging. At the same time, we have wondered are clean tech stocks a short.
As always, we urge investors to be cautious. Today markets are awash with high-flying and unproven CEOs and fund managers making claims that defy basic arithmetic. When others are greedy, we encourage you to be fearful!!
Fast Growth Stocks: How to Find them Using the KCR Core Models
Having said all that we want to give readers with a penchant for fast growing stocks a quick primer on how to find them using KCR’s core stock ranking models. Our core ranking methodologies seek to exploit the market’s behavioral errors. In a normal market environment, they tend to be fairly balanced between deep value, value, growth and fast growth stocks.
In environments like today where investors are chasing fast growing stocks based on revenue growth, users of the models will find that they are going to rank more profitable and cheap stocks highly. Said differently, if the market is chasing fast growth stocks, the models will mechanically show a preference for anything but fast growing stocks!
That does not mean the models cannot help those who have a preference for fast growth stocks. Our models’ ranking systems allow users to see the proprietary scoring methodologies KCR calculates for over 95 discreet factors. Specifically 20 value metrics, 22 balance sheet metrics, 27 earnings quality metrics, 5 analyst quality metrics and 21 market quality metrics. In our 13th year of operation, we have created and built these factor calculations at the request of and in cooperation with many of the most storied and successful money managers.
The breadth and depth of the calculated variables in our models allows users to tailor sort them by anything that might be of particular interest. You can literally resort the entire ranking tool by any one of those variables.
In these examples we have taken screen shots of our stock ranking models, blurred out the stocks and then put numbers in bright red. Each number in red corresponds to the bulleted number below. First, the basic layout:
- The #1 below is just to the left of a collection of action buttons – you can click “Go to Glossary” and get a full explanation of the 95 factors calculated by KCR. You can click on “Market Cap Filter” and create ranges to control what size stocks the ranking tool will show you, click on “Go to Single Stock” and it will take you to our heatmap that drills deep into a single name. Functionality includes the ability to load your portfolio with a copy and paste by using the “Go to Portfolio” button and all these features can generate an easy to print and email PDF by simply clicking “Create PDF.”
- Here you can see the left-most column “Agg Rank.” The aggregate ranking is the model’s sorting of stocks from best perceived risk/reward (#1) to the worst ranked stock. When you launch one of our stock ranking models it defaults to sorting by our aggregate rank using the fundamental and quantitative factors that underpin the tool. Click here if you didn’t already download a sample model – easy enough to use you can quickly pick up the simple functionality while you read this!
- These are our five primary buckets that we rank stocks on. Valuation, Balance Sheet, Earnings Quality, Analyst Quality, and Market Quality. Each module has a number between 1 and 5 next to each stock. 5 being the best score and 1 being the worst score. You can click on the header to sort by best to worst or worst to best for any of these five buckets. For example, if you want to see all the least expensive stocks you would double click on “Valuation Quintile” and it will resort the list from 5s to 1s. Double click again and it will resort the stocks from the most expensive “1s” to the 5s.
- For those with specific interests we hope to get your attention here. You can click on any number in any of the five buckets and it will instantly pop out all the sub-factors we have calculated within that bucket. So in this example if you double click on the “5” under Valuation Quintile…..

- …It will pop-out the 20 value related factors’ percentile relative to the universe. In this example we are looking for fast growing stocks. If you were looking for fast growth stocks with an emphasis on earnings you might focus on the column for 1 year earnings growth which is circled below. If you were not sure what “Earn 1 Yr Grth” meant, you just click in the box and the definition with our calculation methodology pops right up. You can see that our #1 ranked stock (left-most column, “Agg Rank”) has a “69” under it. That means our top ranked stock is growing earnings faster than 69% of all the companies in the universe. The second ranked stock just under it is growing earnings faster than 76 percent of the other companies in the universe. If you want to re-sort the entire universe based on 1 year earnings growth, you just click the column header and…..

- …the model will instantly re-rank the universe based on which companies have the highest earnings growth to the lowest. You can see right in the center, highlighted in yellow to the left of the “#6” it now says “Sorted Descending by Earn 1 Yr Grth” and the stock at the top now has an “Earn 1 Yr Grth” score of “100” – meaning it is the stock with the fastest earnings growth in the universe.
- Now let’s say you actually want to find a really fast grower that our model likes because it has a healthy balance sheet, high quality earnings and a reasonable valuation. You can see in this example, looking at the bottom row, again highlighted in yellow, that the stock our model ranks as the 26th best (left most column, “Agg Rank”) happens to be growing one year earnings faster than 98% of all the other companies in the model (right most column, Earn 1 Yr Grth).


For those looking for fast growth stocks of uncommon quality this is a remarkably efficient process. KCR realizes that reading through these exhibits might feel onerous.
It could not be easier and one of our product specialists can have you adeptly moving around these tools in minutes.
If you are looking for fast growing stocks, cheap stocks, stocks with big dividends or anything else you can think of, please reach out to one of our product specialists by contacting us directly on the site or shooting an email to research@kailashconcepts.com
The Fastest Growing Low Priced Stocks: A Simple Solution
KCR recognizes that the above level of Do-It-Yourself granularity may not be all that appealing to some folks. If you are looking for fast growing stocks to invest in that, based on significant historical research, have a long track-record of providing powerful risk-adjusted returns, KCR believes we have a pre-built solution that may be a great starting point for the research process.
The first paper written by KCR’s equity research team focused on the pitfalls of stocks that will grow fast in their piece The Siren Song of Growth: Why Investors Willfully Set Sail for the Rocks. That piece not only identified the risks that often accompany stocks growing fast but also explained how to avoid those risks.
KCR’s equity research team recently updated that work with our Growth at a Reasonable Price paper. In that piece we explained that the quest for profitless growth had left the most rapidly growing stocks based on profits at record wide discounts to the market. That piece also revisited our GARP model which we will touch on briefly here.
Our GARP model has been in live distribution since 2012 with an out of sample paper track-record that has helped the tool win a cult following. KCR does not excel at marketing. But we do believe that our models are some of the best in the business. Used as a disciplined starting point, we believe this tool can help investors looking for fast growth stocks outperform benchmarks like the Russell 2000 Growth and Russell 2500 Growth over a full market cycle.
The exhibit below is a snapshot from our GARP model’s monthly deliverable. Unlike the core ranking models, this output is highly concentrated, prebuilt and requires nothing of the user. Every month the model outputs the top 10 ranked fast growing stocks based on our proprietary model.
Looking at the exhibit below shows you what to expect. Aside from historically strong performance, one of the reasons this model has a “cult” following is its ease of use. You get 10 names and for each you can see exactly why it ranks at the top of the fast growing stocks. Look at the red text “Growth Percentile” that is pointing at “LTG.” That is the stock’s long-term growth score. Higher is faster. You can see that the top 10 ranked stocks in this month grew faster than ~90% of the other 2,000+ stocks that are candidates for this model! Again, these models have been in continuous operation for a very long time and may be a great starting point for fundamental research by growth investors.

How To Find Fast Growing Stocks: Quick Summary
KCR has been around for a long time. Our team includes a prominent academic in the field of behavioral finance, folks with advanced math degrees and a long-tenured money manager who spent his career merging tools like these with fundamental research. They have worked together for 13 years.
KCR offers subscribers a wide range of tools to help find whatever type of stocks you might have an interest in. Although their work generally carries a value bias, the specialty products (like the GARP model above) and the incredible flexibility of our tools allows for powerful customization. You can be an aggressive momentum investor looking for stocks that are ripping higher and after a few minutes working with the tools and talking to a KCR product specialist you will be able to sort and locate the best candidates for you to research on.
As our research over the years has shown, fast growth stocks offer investors some of the biggest payoffs but can frequently carry higher risks. Our models can help investors looking to find fast growing stocks better balance (or at least be better aware of) the risks vs. the expected rewards. To reiterate what we said earlier: reading an explanation of a sophisticated but simple-to-use model can make it seem difficult. It is not. Give us 5 minutes and you will have find our powerful stock ranking and sorting tools are intuitive and simple to use.


Disclaimer
The information, data, analyses, and opinions presented herein (a) do not constitute investment advice, (b) are provided solely for informational purposes and therefore are not, individually or collectively, an offer to buy or sell a security, (c) are not warranted to be correct, complete or accurate, and (d) are subject to change without notice. Kailash Capital Research, LLC and its affiliates (collectively, “Kailash Capital Research, LLC ”) shall not be responsible for any trading decisions, damages or other losses resulting from, or related to, the information, data, analyses or opinions or their use. The information herein may not be reproduced or retransmitted in any manner without the prior written consent of Kailash Capital Research, LLC . In preparing the information, data, analyses, and opinions presented herein, Kailash Capital Research, LLC has obtained data, statistics, and information from sources it believes to be reliable. Kailash Capital Research, LLC , however, does not perform an audit or seeks independent verification of any of the data, statistics, and information it receives. Kailash Capital Research, LLC and its affiliates do not provide tax, legal, or accounting advice. This material has been prepared for informational purposes only and is not intended to provide, and should not be relied on for tax, legal, or accounting advice. You should consult your tax, legal, and accounting advisors before engaging in any transaction. © 2021 Kailash Capital Research, LLC – All rights reserved.
Nothing herein shall limit or restrict the right of affiliates of Kailash Capital Research, LLC to perform investment management or advisory services for any other persons or entities. Furthermore, nothing herein shall limit or restrict affiliates of Kailash Capital Research, LLC from buying, selling or trading securities or other investments for their own accounts or for the accounts of their clients. Affiliates of Kailash Capital Research, LLC may at any time have, acquire, increase, decrease or dispose of the securities or other investments referenced in this publication. Kailash Capital Research, LLC shall have no obligation to recommend securities or investments in this publication as result of its affiliates’ investment activities for their own accounts or for the accounts of their clients.