Bear Trading: The quick road to severe setbacks
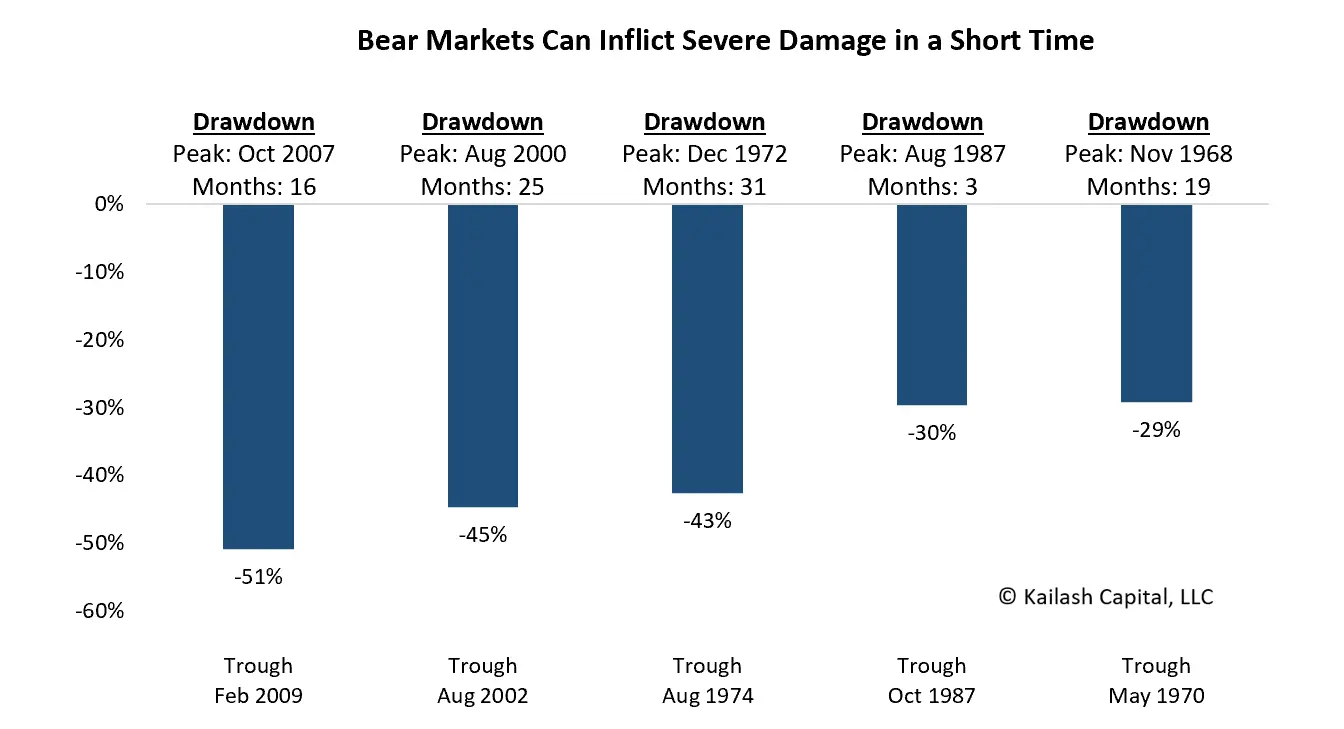
- The chart below shows the five largest bear markets since the 1960s
- Above each bar is the date the bull market peaked
- Below that, is the number of months it took for each bear market to trough
- We do not believe anyone can time the market but, as shown in our research, the stock market is far more expensive than the peaks in October 2007 or August of 2000
- The first bar shows that it only took 16 months to lose 51% of your money
Get our insights direct to your inbox: SUBSCRIBE
Market turns are difficult to time. Despite tik-toks to the contrary, we believe short term day trading is a path to poverty. Many investors have lost sight of the incredible amounts of time it takes to recover from sharp losses in bear markets.
Investments for Bear Markets
Our research team believes that some investors have forgotten that you can actually lose money in stocks. The bull market underway has been so extraordinary that it often feels like the books about the roaring 20s. We will publish a brief summary of a book that addresses the bull market in the 1920s shortly with the hope of inducing a modicum of prudence.
The bars in the chart below are identical to the previous one. We added the following information:
- The number of months it took to breakeven from each of these bear market crashes
- The market valuation right before the bear market crash began (red dot, right-hand scale)
- The valuation of the market at the trough when it was finally safe again (green triangle, right-hand scale)
Let’s revisit the first bar. It shows that from the peak of the mortgage bubble in 2007 through the trough in 2009 the market lost 51% of your money. As noted above, that disaster took a quick 15 months. You can see, however, that if you invested $1 at the peak in 2007 and held on to the trough in 2009, it took 37 months and a rise in the market of 104% for you to simply break even.
That may seem tolerable with hindsight. But that means you spent over three years just trying to break even from catastrophic bear market losses assuming you held on. As noted in our research, while the market succumbs to speculative fads, we have advocated for buying high-quality firms at reasonable prices.

Look at the valuation statistics on that first bar. The bubble peaked in 2007 with the stock market valued at 1.6x price to sales. By the time the bear market was done, valuations had fallen to 0.8x.
Move one bar to the right. That is the peak to trough of the dot.com bubble. The market peaked at 2.3x sales and troughed at 1.3x sales. But it took a staggering 49 months for someone who bought at the peak to simply break even on a dollar.
Please note the red dot on the far right. That is the Price to Sales ratio of the S&P 500 today. At 3x sales the index is nearly 50% higher than in 2000. It would require nearly a 60% loss to hit the lows seen post the dot.com crash.
Our team does not post these bar charts with the intention of scaring anyone. We are simply wary that massive government spending, low rates and huge injections of liquidity by the Fed have generated what we believe is a bubble in certain equity prices. As we have documented in our many research notes on the topic, we believe the best opportunities are in stable, high-quality and reasonably priced companies.
One of the major benefits of the distortions we believe are underway in markets today is that when investors chase fads it often results in higher quality companies becoming relatively cheaper. We have made that case emphatically in both small caps and cheap stocks very recently.
Legendary investor Seth Klarman, also the author of the margin of safety book, noted that index funds become more popular during bull markets. We agree. He also noted that “Although indexing is predicated on efficient markets, the higher the percentage of all investors who index, the more inefficient the markets become as fewer and fewer investors would be performing fundamental analysis.”1
Financial markets today seem to be driven off near-instant changes in perceptions around current and future interest rates. We cannot forecast such things but we do believe the S&P 500 and other indexes are expensive in aggregate. We believe the legions of day traders are an unfortunate sign of the times and a call for prudence.
Our team believes that traditional investing methods of reading annual reports and understanding fundamentals is one of the least practiced and, therefore, one of the easiest approaches to improve on market returns today. In our view, an investment strategy that is anchored in time tested and proven practices of buying quality at low valuations will likely outperform in the years ahead.
Subscribe below to receive a copy.


Disclaimer
The information, data, analyses, and opinions presented herein (a) do not constitute investment advice, (b) are provided solely for informational purposes and therefore are not, individually or collectively, an offer to buy or sell a security, (c) are not warranted to be correct, complete or accurate, and (d) are subject to change without notice. Kailash Capital Research, LLC and its affiliates (collectively, “Kailash Capital Research, LLC ”) shall not be responsible for any trading decisions, damages or other losses resulting from, or related to, the information, data, analyses or opinions or their use. The information herein may not be reproduced or retransmitted in any manner without the prior written consent of Kailash Capital Research, LLC . In preparing the information, data, analyses, and opinions presented herein, Kailash Capital Research, LLC has obtained data, statistics, and information from sources it believes to be reliable. Kailash Capital Research, LLC , however, does not perform an audit or seeks independent verification of any of the data, statistics, and information it receives. Kailash Capital Research, LLC and its affiliates do not provide tax, legal, or accounting advice. This material has been prepared for informational purposes only and is not intended to provide, and should not be relied on for tax, legal, or accounting advice. You should consult your tax, legal, and accounting advisors before engaging in any transaction. © 2021 Kailash Capital Research, LLC – All rights reserved.
Nothing herein shall limit or restrict the right of affiliates of Kailash Capital Research, LLC to perform investment management or advisory services for any other persons or entities. Furthermore, nothing herein shall limit or restrict affiliates of Kailash Capital Research, LLC from buying, selling or trading securities or other investments for their own accounts or for the accounts of their clients. Affiliates of Kailash Capital Research, LLC may at any time have, acquire, increase, decrease or dispose of the securities or other investments referenced in this publication. Kailash Capital Research, LLC shall have no obligation to recommend securities or investments in this publication as result of its affiliates’ investment activities for their own accounts or for the accounts of their clients.