“Be FEARFUL when others are GREEDY” –Warren Buffett:
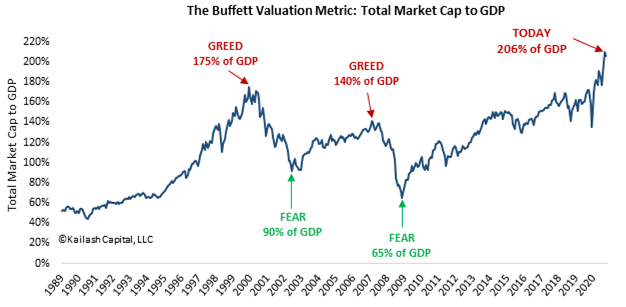
- The chart below is Buffett’s favorite broad market valuation tool – Market Cap/GDP – a Kailash topic discussed here
- When stocks are expensive relative to GDP the payoffs to investing in stocks has been terrible
- At the peak in 2000, often considered maximum greed US stocks were valued at 175% of GDP
- Stocks today are at 206% of US GDP – the highest reading ever – to see the historical payoff expected from today’s reckless greed view the second chart below
- Kailash encourages readers to ignore the greedy crowds and click here to find proven & profitable companies at reasonable prices
Get our insights direct to your inbox: SUBSCRIBE
Stock Market Bubbles in RED
Get our White Papers direct to your inbox: SUBSCRIBE
Warren Buffett’s Market cap to GDP helps us remember: “Rule #1: Never lose money, Rule #2: Never forget rule #1″ –Warren Buffett
- The chart below shows the historical payoffs to Buffett’s favorite broad market valuation tool – Market Cap/GDP
- The ratio of Market Cap to GDP is across the bottom axis and the realized subsequent 10-year annual returns on the vertical axis
- We highlight three observations:
- Green: Buffett openly stated he was buying stock in the GFC in 2008, stocks were priced at ~80% of GDP and went on to deliver 14% annual returns through 2018
- Orange: The peak of the internet bubble – if you bought stocks there you lost money every year for a DECADE
- Today: The most expensive stocks have been in US history – history suggests terrible losses for those investing today

The KCR team has published an extensive library of research warning readers about the valuation bubble in markets. While valuation is useless for timing it does help inform readers about the potential downside risks.
Over a series of pieces, we have documented how today’s market has elements of the Nifty Fifty bubble as well as the dot.com bubble. In our piece The Collision of Arithmetic and Overoptimism, we documented the degree to which many of today’s largest market cap companies face significant arithmetic headwinds.
Having a measure of where valuations are is a healthy guidepost, in our view, for safety-oriented long-term investors. Compounding capital is very much about minimizing downside losses – a concept we noted in our review of Seth Klarman’s timeless book.
As the federal reserve banks have pumped the system full of liquidity, the S&P 500 is at all-time highs while interest rates plunge. While this has been a boon for gross domestic product and corporate profitability, we believe risks about.
Even our simple charts showing the market value of publicly traded stocks > 10x and > 20x sales make it clear that today’s markets have euphoric bubble-like features. KCR believes this is less than optimal considering recent inflationary bouts and geopolitical stresses.
Please click here to watch our brief summary of our extensive research on equities and inflation. The KCR team does not make macro forecasts. As documented in our research, however, the market’s pricing structure today leaves investors exposed to any possible inflation in a manner we have not seen before.
Overall, our team believes the excessive euphoria in specific groups of stocks has left some of the highest quality firms trading at below-market prices. Please reach out to us via our website or browse our White Papers and Quick Takes if you would like to learn more about the opportunities we believe available today.
KCR is watching with dismay as retail investors are being sucked into some of the most speculative stocks we have seen since the internet bubble. A critical difference between 2000 and today, however, is that in 1999 you could buy a 5-year Treasury bond yielding 5%!
No such safety exists in bonds today. As in past moments of euphoria where investors come to believe things are “different” and the old methods of valuation no longer apply, we believe today will end with aggressive investors experiencing sharp losses.


Disclaimer
The information, data, analyses, and opinions presented herein (a) do not constitute investment advice, (b) are provided solely for informational purposes and therefore are not, individually or collectively, an offer to buy or sell a security, (c) are not warranted to be correct, complete or accurate, and (d) are subject to change without notice. Kailash Capital Research, LLC and its affiliates (collectively, “Kailash Capital Research, LLC ”) shall not be responsible for any trading decisions, damages or other losses resulting from, or related to, the information, data, analyses or opinions or their use. The information herein may not be reproduced or retransmitted in any manner without the prior written consent of Kailash Capital Research, LLC . In preparing the information, data, analyses, and opinions presented herein, Kailash Capital Research, LLC has obtained data, statistics, and information from sources it believes to be reliable. Kailash Capital Research, LLC , however, does not perform an audit or seeks independent verification of any of the data, statistics, and information it receives. Kailash Capital Research, LLC and its affiliates do not provide tax, legal, or accounting advice. This material has been prepared for informational purposes only and is not intended to provide, and should not be relied on for tax, legal, or accounting advice. You should consult your tax, legal, and accounting advisors before engaging in any transaction. © 2021 Kailash Capital Research, LLC – All rights reserved.
Nothing herein shall limit or restrict the right of affiliates of Kailash Capital Research, LLC to perform investment management or advisory services for any other persons or entities. Furthermore, nothing herein shall limit or restrict affiliates of Kailash Capital Research, LLC from buying, selling or trading securities or other investments for their own accounts or for the accounts of their clients. Affiliates of Kailash Capital Research, LLC may at any time have, acquire, increase, decrease or dispose of the securities or other investments referenced in this publication. Kailash Capital Research, LLC shall have no obligation to recommend securities or investments in this publication as result of its affiliates’ investment activities for their own accounts or for the accounts of their clients.