
How Much Debt Does the US Have – US Debt by Year
Where are the Debt Collectors & US Inflation Rates The chart below shows the total US debt outstanding by year We are not macroeconomists, but we believe $29 trillion ...
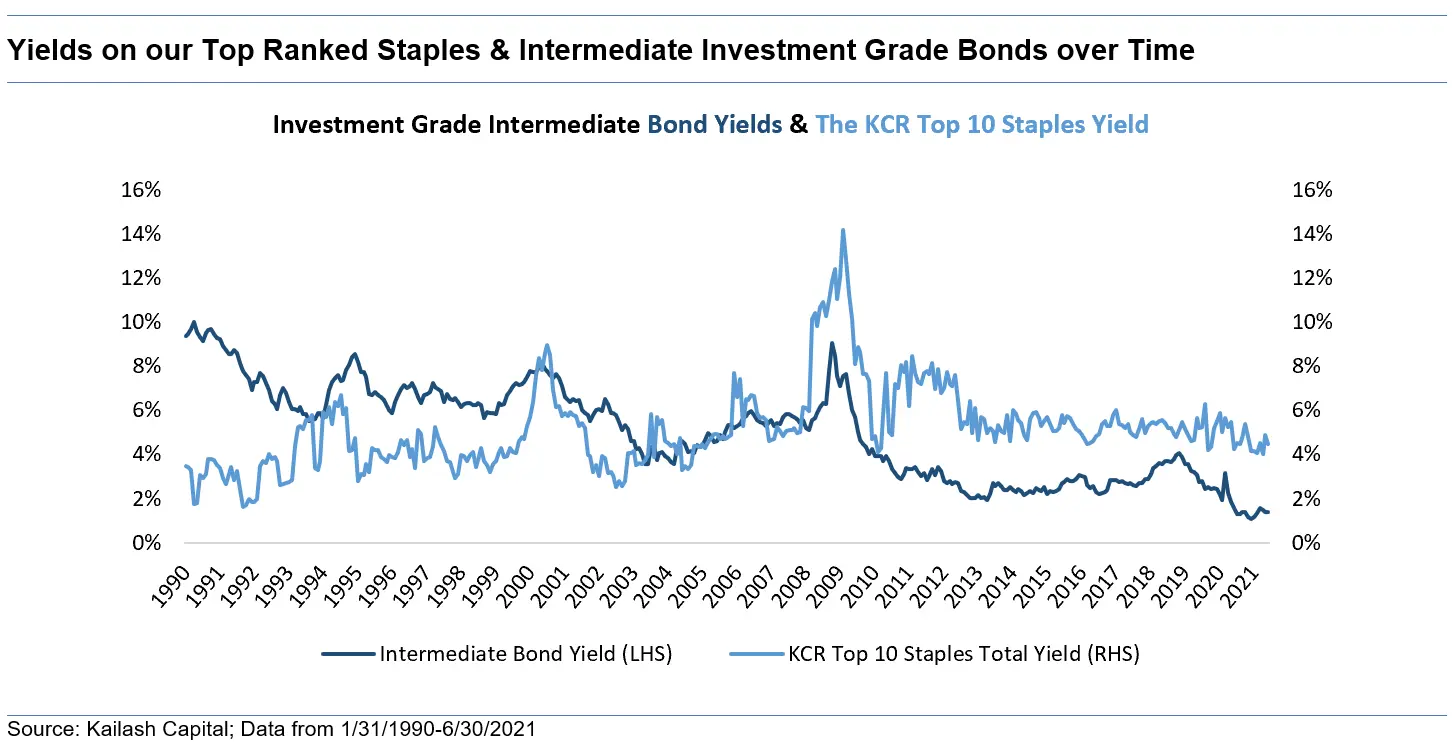
Stock Yields, Bond Yields & Safety Investing
Advocating for Steady Growth and High Dividend Investments: The navy blue line below shows the yield on investment-grade bonds with ~5 year average maturities The light blue line shows ...
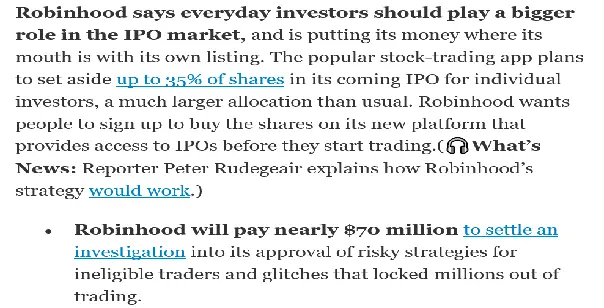
Initial Public Offerings
“Investors even remotely tempted to buy new issues must ask themselves how they could possibly fare well when a savvy issuer and greedy underwriter are on the opposite side ...
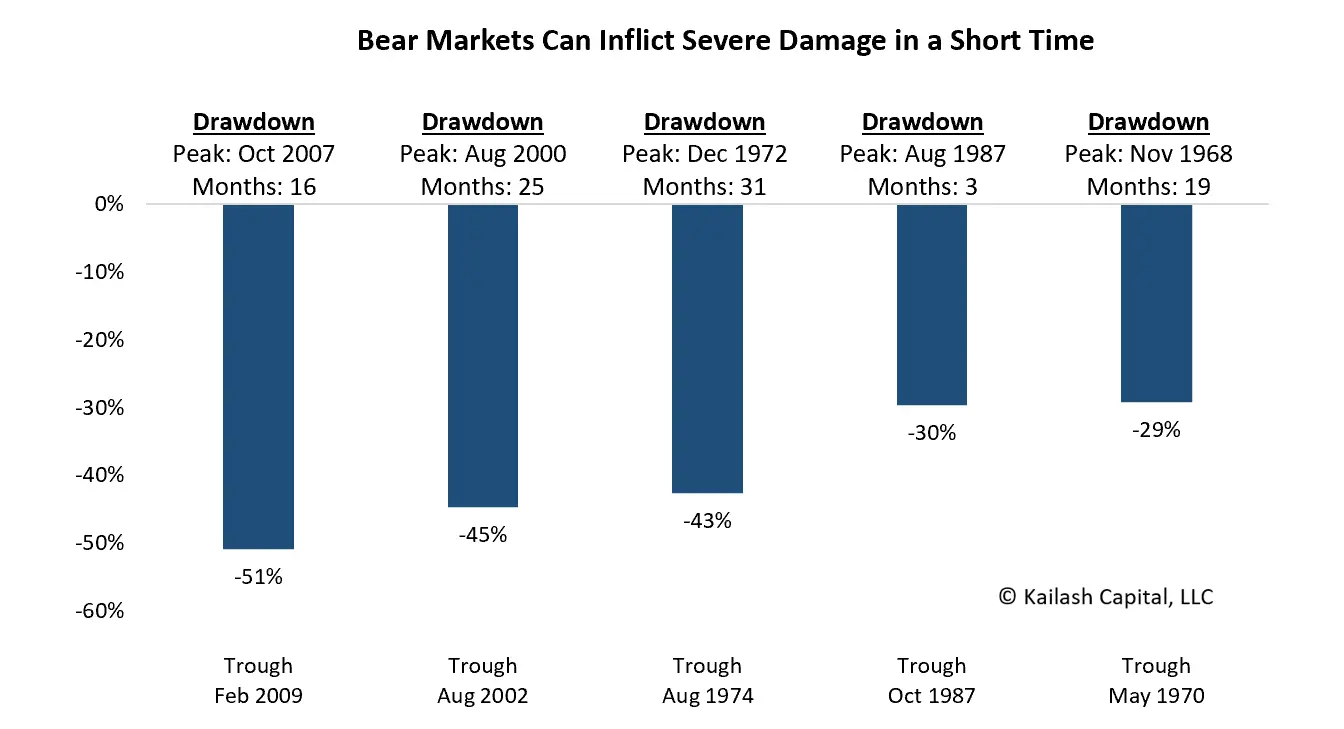
Investing in a Bear Market: Bear Traders & The Basics of Breakeven
Bear Trading: The quick road to severe setbacks The chart below shows the five largest bear markets since the 1960s Above each bar is the date the bull market ...
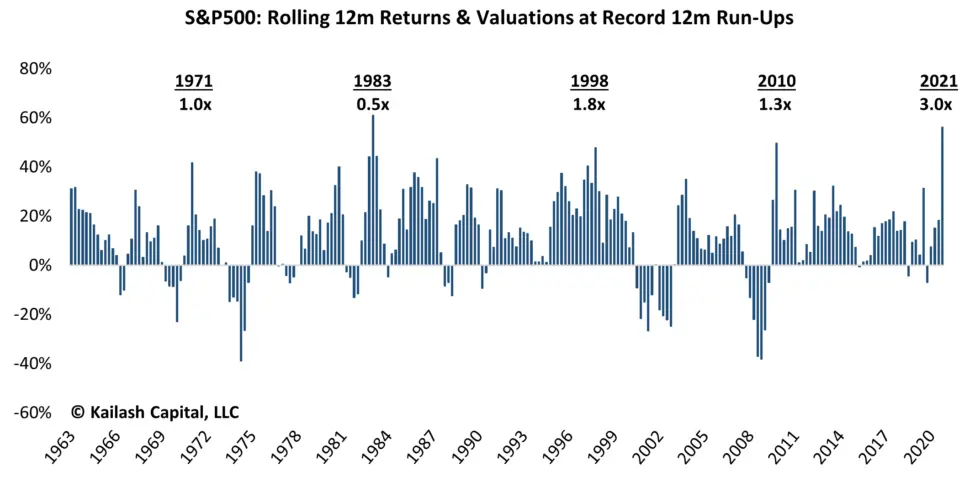
Stock Market Bubble
Record Returns & Record Prices: The chart shows the rolling annual returns of the S&P 500 since 1963 We put the Price to Sales ratio above the years that ...
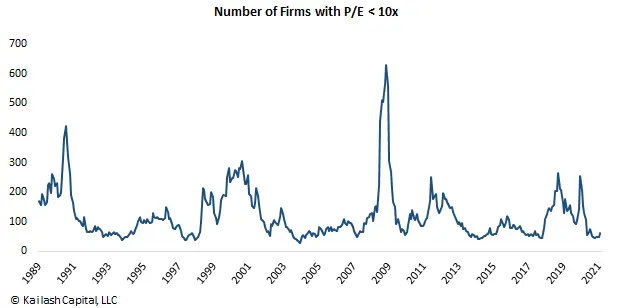
Digging for Deep Value: Stocks Below 10x Earnings
The chart shows the number of firms trading below 10x earnings is at all-time lows We chose 10x earnings because it is a round number and really simple Many ...
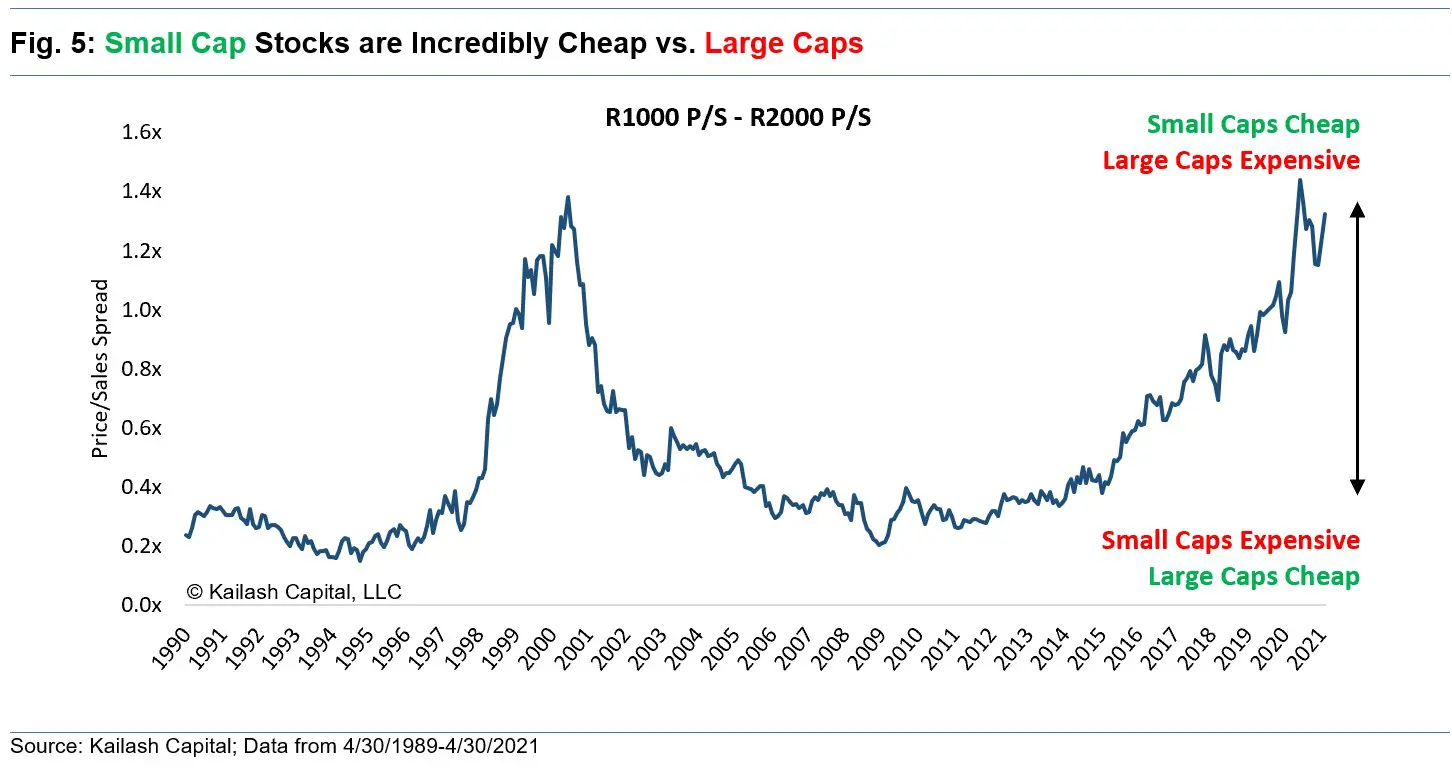
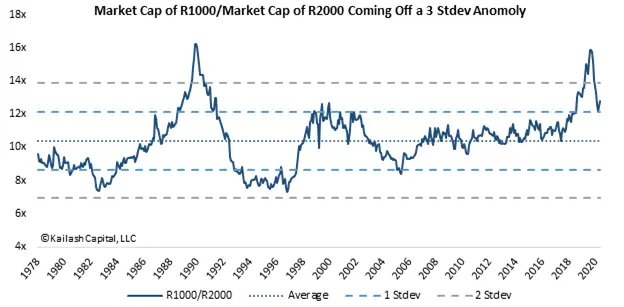
Large vs Small Cap Stocks: Could the Past be Precedent
The Case for High-Quality Small Caps: The chart shows that small cap value stocks have only been this cheap vs. large cap stocks at the peak of the dot.com ...
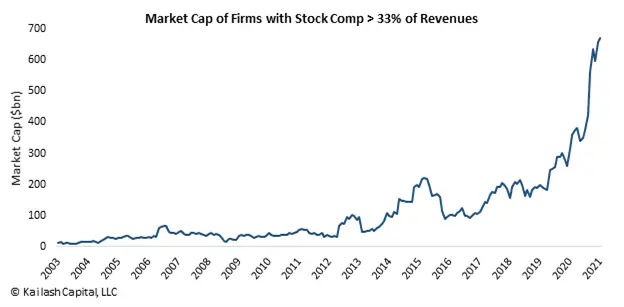
The Steep Cost of Stock Compensation
Are Stocks With the Highest Growth Healthy? The chart shows the market cap of firms where stock compensation represents over a third of SALES We have written three pieces ...
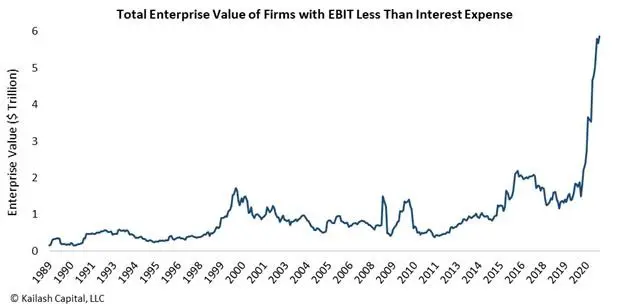
Stocks versus Bonds and the Problem with Profitless Stocks
The Problem with Peak Prices and Record Low Yields: In Seth Klarman’s Margin of Safety Book, he discussed the 1980s junk bond mania before it imploded Back then many ...
Stock Prices & The Might of Mean Reversion
Making Simple Concepts Work for Your Investments: We have written a number of papers about the simple math that makes large cap investing in even high quality names difficult ...
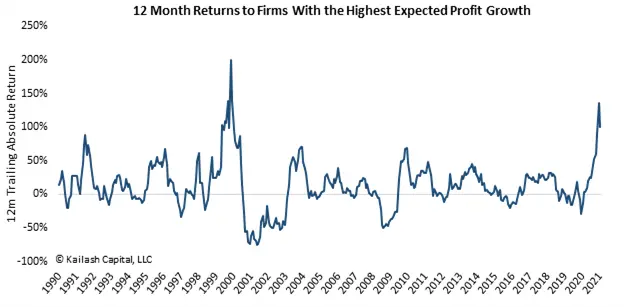
Profit Growth: The High Price of High Expectations
Bloomberg published an article citing academic research noting firms with high expected profit growth tend to underperform Longtime readers of ours flagged us as we wrote extensively about this ...
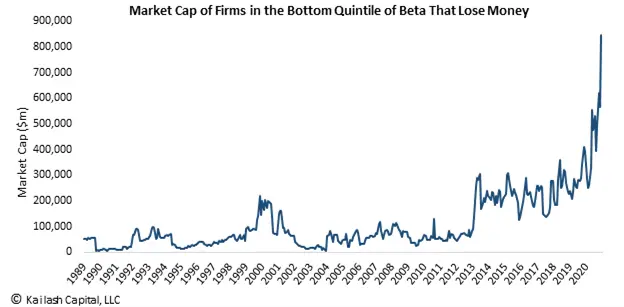
Is Equity Beta Broken?
Beta, or the amount a stock price goes up and down relative to the market, is a popular measure of “risk” Famous investors such as Seth Klarman have observed ...