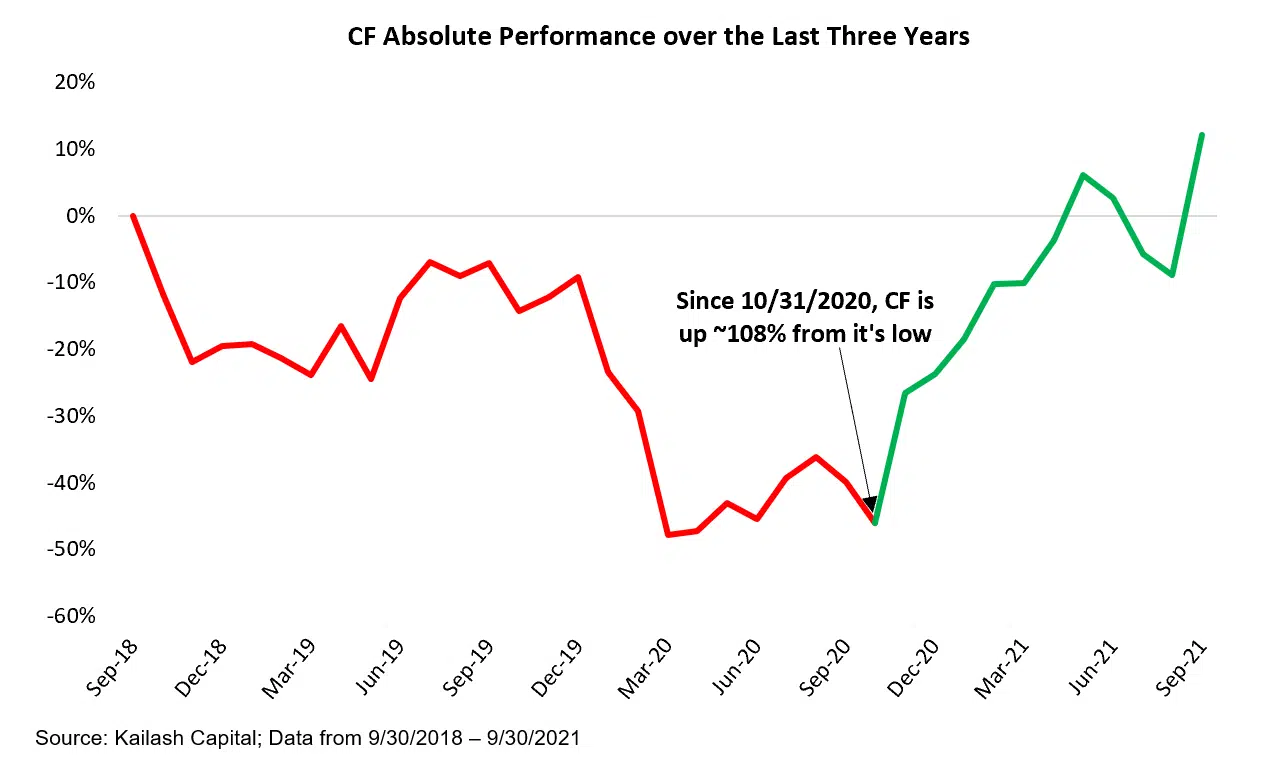
Best Agriculture Stocks: Is CF Stock a Good Buy?
Looking at CF Industries Holdings’ stock price over the last three years. The chart shows the performance of fertilizer and agricultural chemical manufacturer CF, over the last three years ...

Twilio Investor Relations: A Tougher Job than Most
The chart shows the performance of internet infrastructure company TWLO over the last three years Since the stock’s most recent peak on March 1, 2021, it has stalled, falling ...
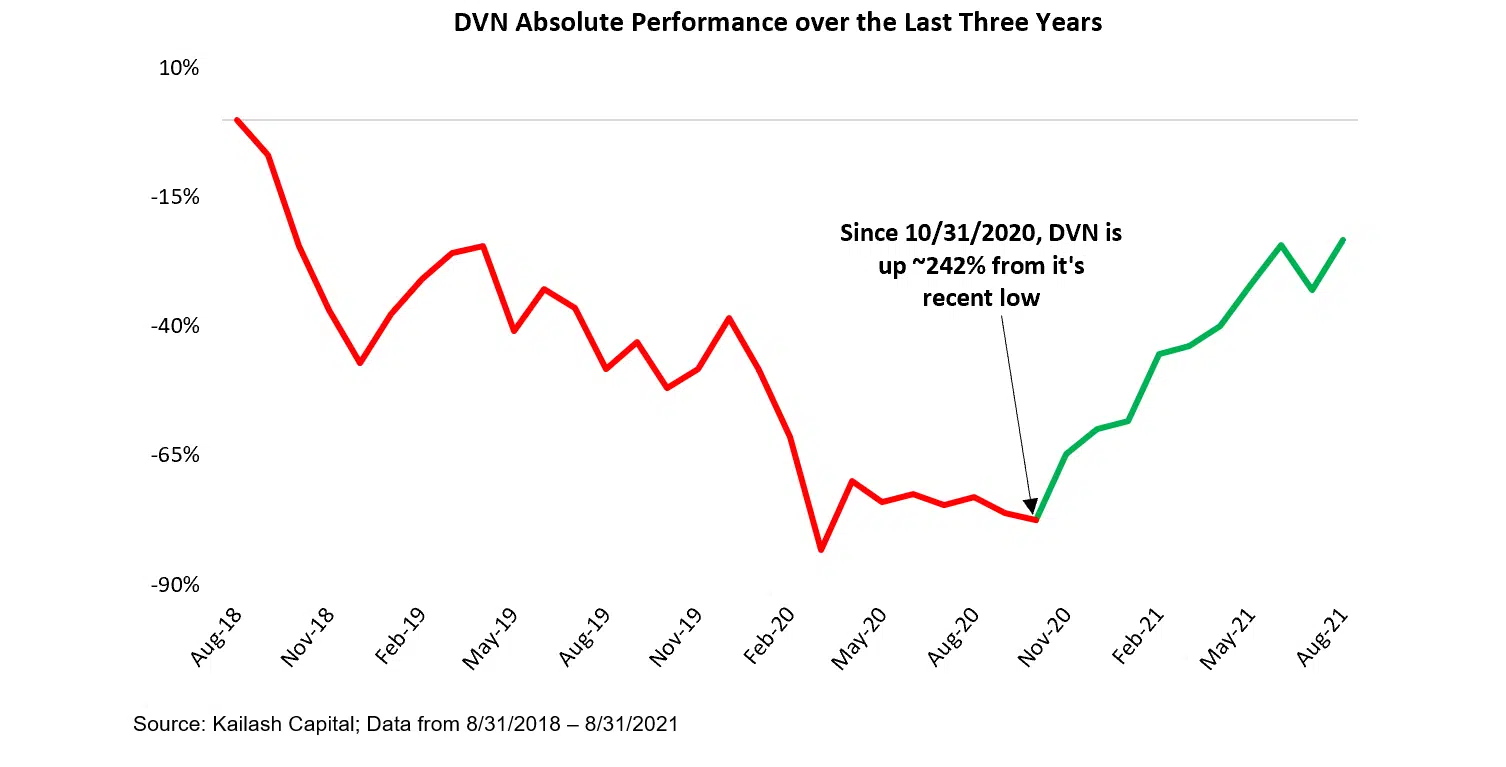
Is DVN’s Stock Price Today an Opportunity?
The case for undervalued energy, looking at Devon Energy over the last three years. The chart shows the performance of oil and gas exploration company DVN over the last ...
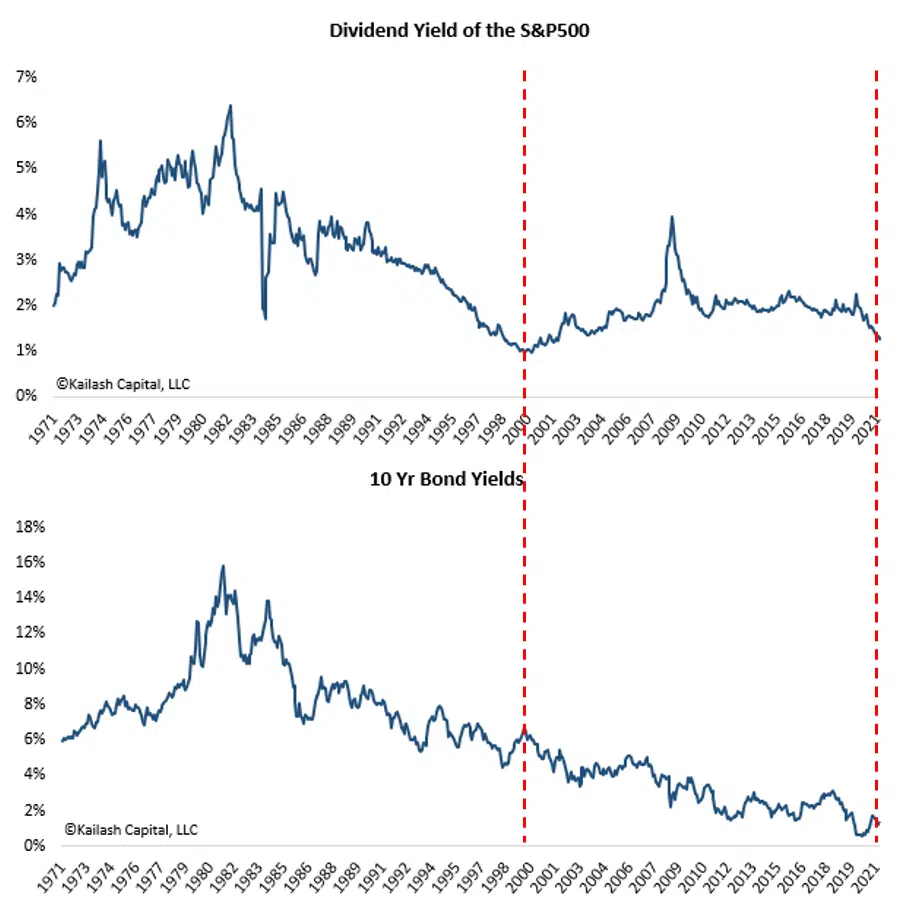
What is Fixed Income Investing Today?
Low Yields are Now the Norm KCR recently came across a fabulous tweet by @charliebilello that caught our attention. In his tweet, he pointed out...
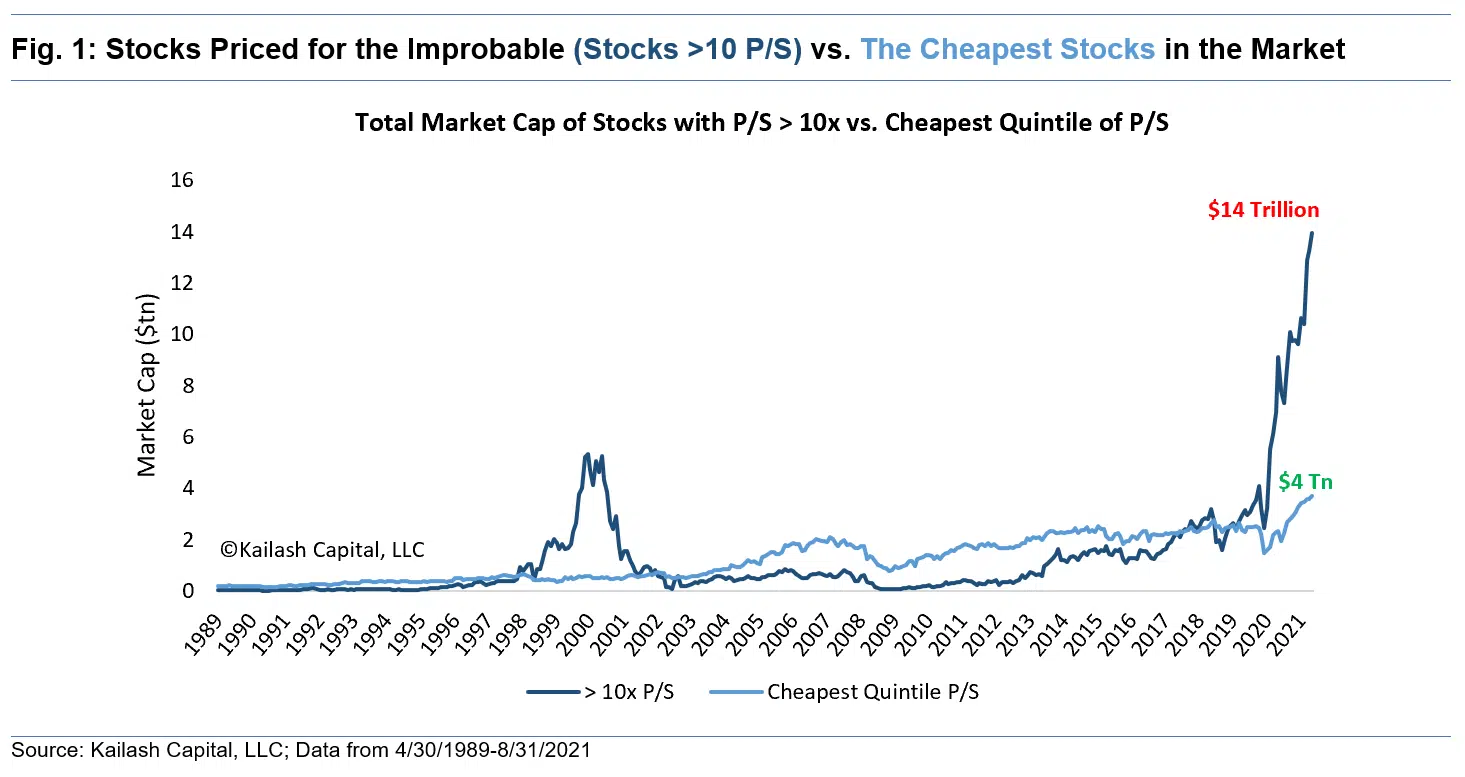
Market Cap of Companies Over 10x & 20x Sales is Out of Control
Are the Most Valued Companies in the World this Valuable? In March, we published a chart showing the market capitalization of firms over 10x price to sales hit $10 ...
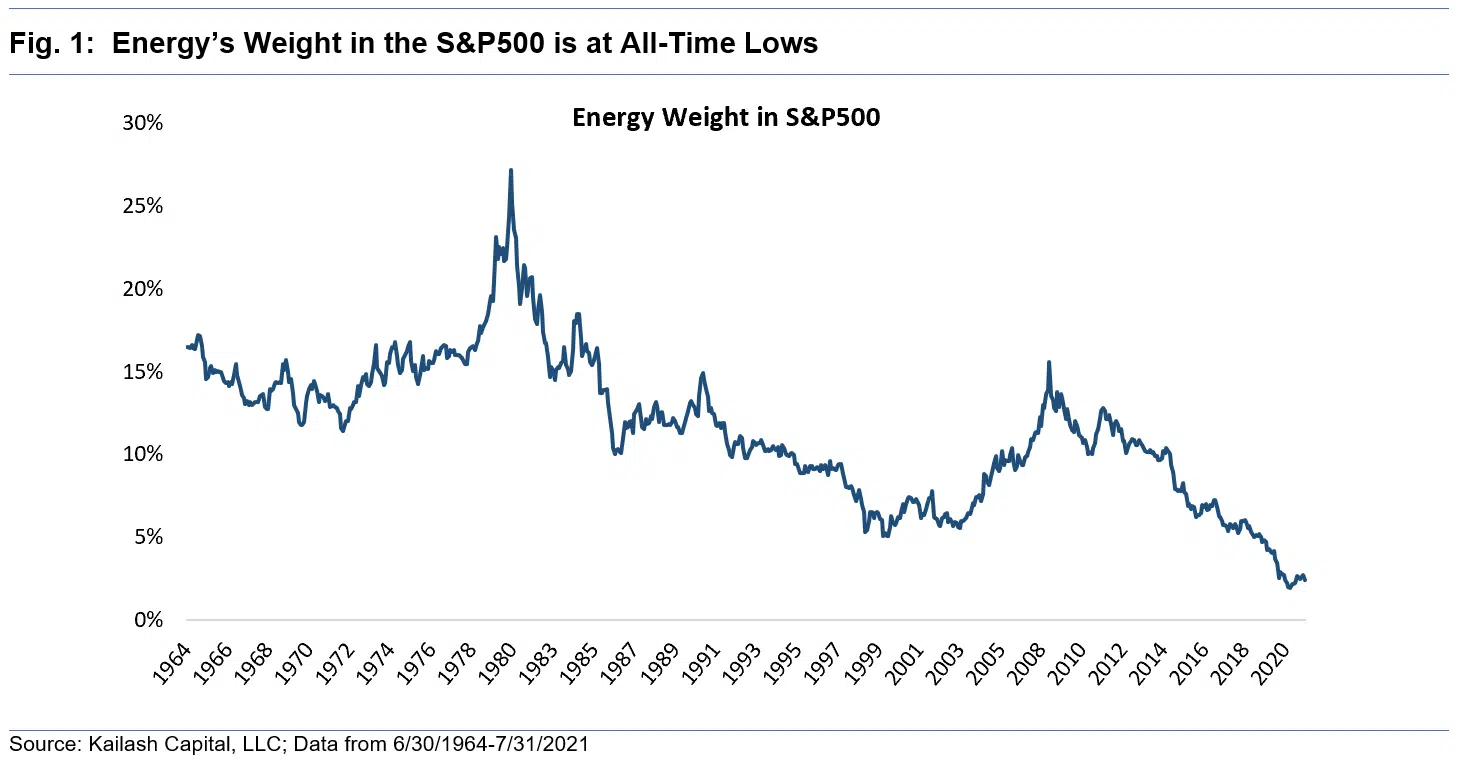
Are Current Crude Oil Prices Reflected in Energy Stocks?
Energy Investing May be a Highly Profitable Endeavor: A Contrarian Take on “Peak Oil Demand” The chart below shows the Energy Sector’s weight in the S&P 500 is at ...
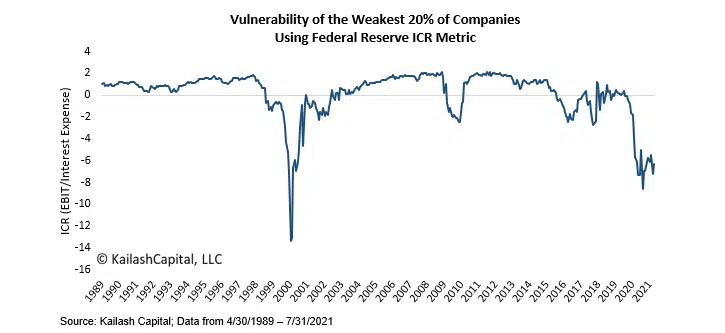
Financial Fragility of Weak Firms is at Dot.Com Levels
Credit Risk in Stocks Using the Fed Definition of Speculative Grade Stocks Shows Elevated Risk Today The chart shows that the weakest quintile of stocks is as vulnerable today ...

Mohawk Industries Stock
Fun with flooring, the case for the basics, looking at Mohawk Industries over the last three years The chart shows the performance of flooring products company MHK, Mohawk Industries, ...
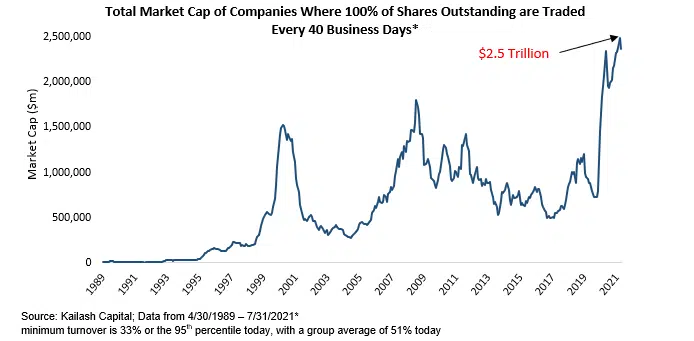
How to Get Started Day Trading: Don’t
Revisiting the Liquidity Liability There are now $2.5 trillion worth of companies whose shares are trading so furiously that the entire share base of the firm is changing hands ...
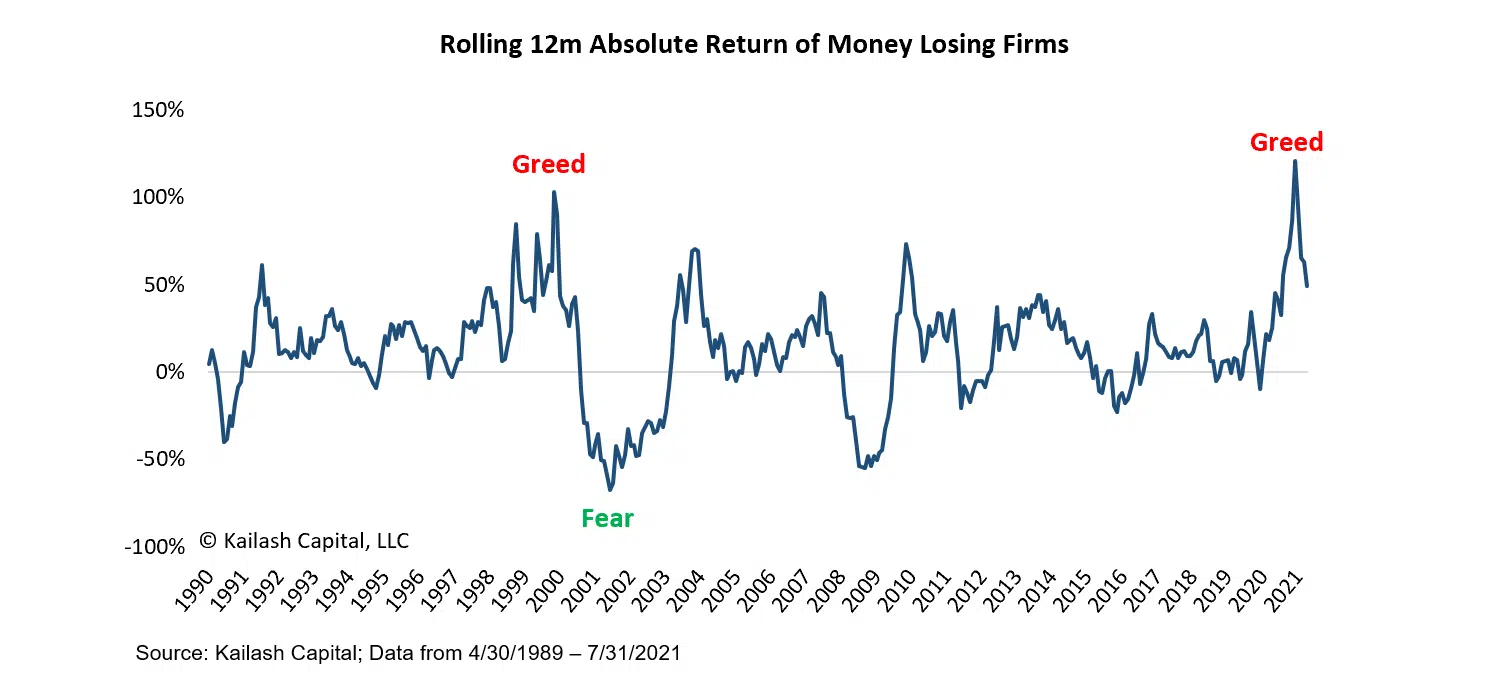
High Risk Stocks & the Role of Active Managers
The Riskiest Stocks Right Now? The chart below shows that money-losing firms recently generated a 120% return When people double their money buying risky stocks, it is just another ...

Small Market Cap Stocks Offer Big Value
Get our insights direct to your inbox: SUBSCRIBE The Case for Small Cap Value Stocks: The chart below shows that Small Cap Value is as cheap vs. Large Cap ...

Speculative Trading: How to Avoid Big Losses
The Importance of Prudence in a Time of Rampant Speculative Trading We believe the $4.5 trillion market cap of stocks trading over 20x sales likely understates the market cap ...