U.S. GDP grew 2% annualized in Q1 2026 after inflation, including gas prices hit their highest since 2022. [1] Private non-residential fixed investment drove 70% of that growth, with “information-processing equipment” alone accounting for one-third of private demand growth over the past 12 months. [2]
That category includes semiconductors, the main driver behind AI hyperscaler capex. The big spenders (Alphabet, Amazon, Microsoft, and Meta) show no signs of letting up.
Get our insights direct to your inbox: SUBSCRIBE
The flip side—earnings growth—has been front and center. With Q1 2026 reporting underway, several sectors and individual names have posted impressive numbers, lifting stocks. You might guess Info Tech and, given oil’s ~25% rise, Energy lead the pack. Partly right, but remarkably wrong.
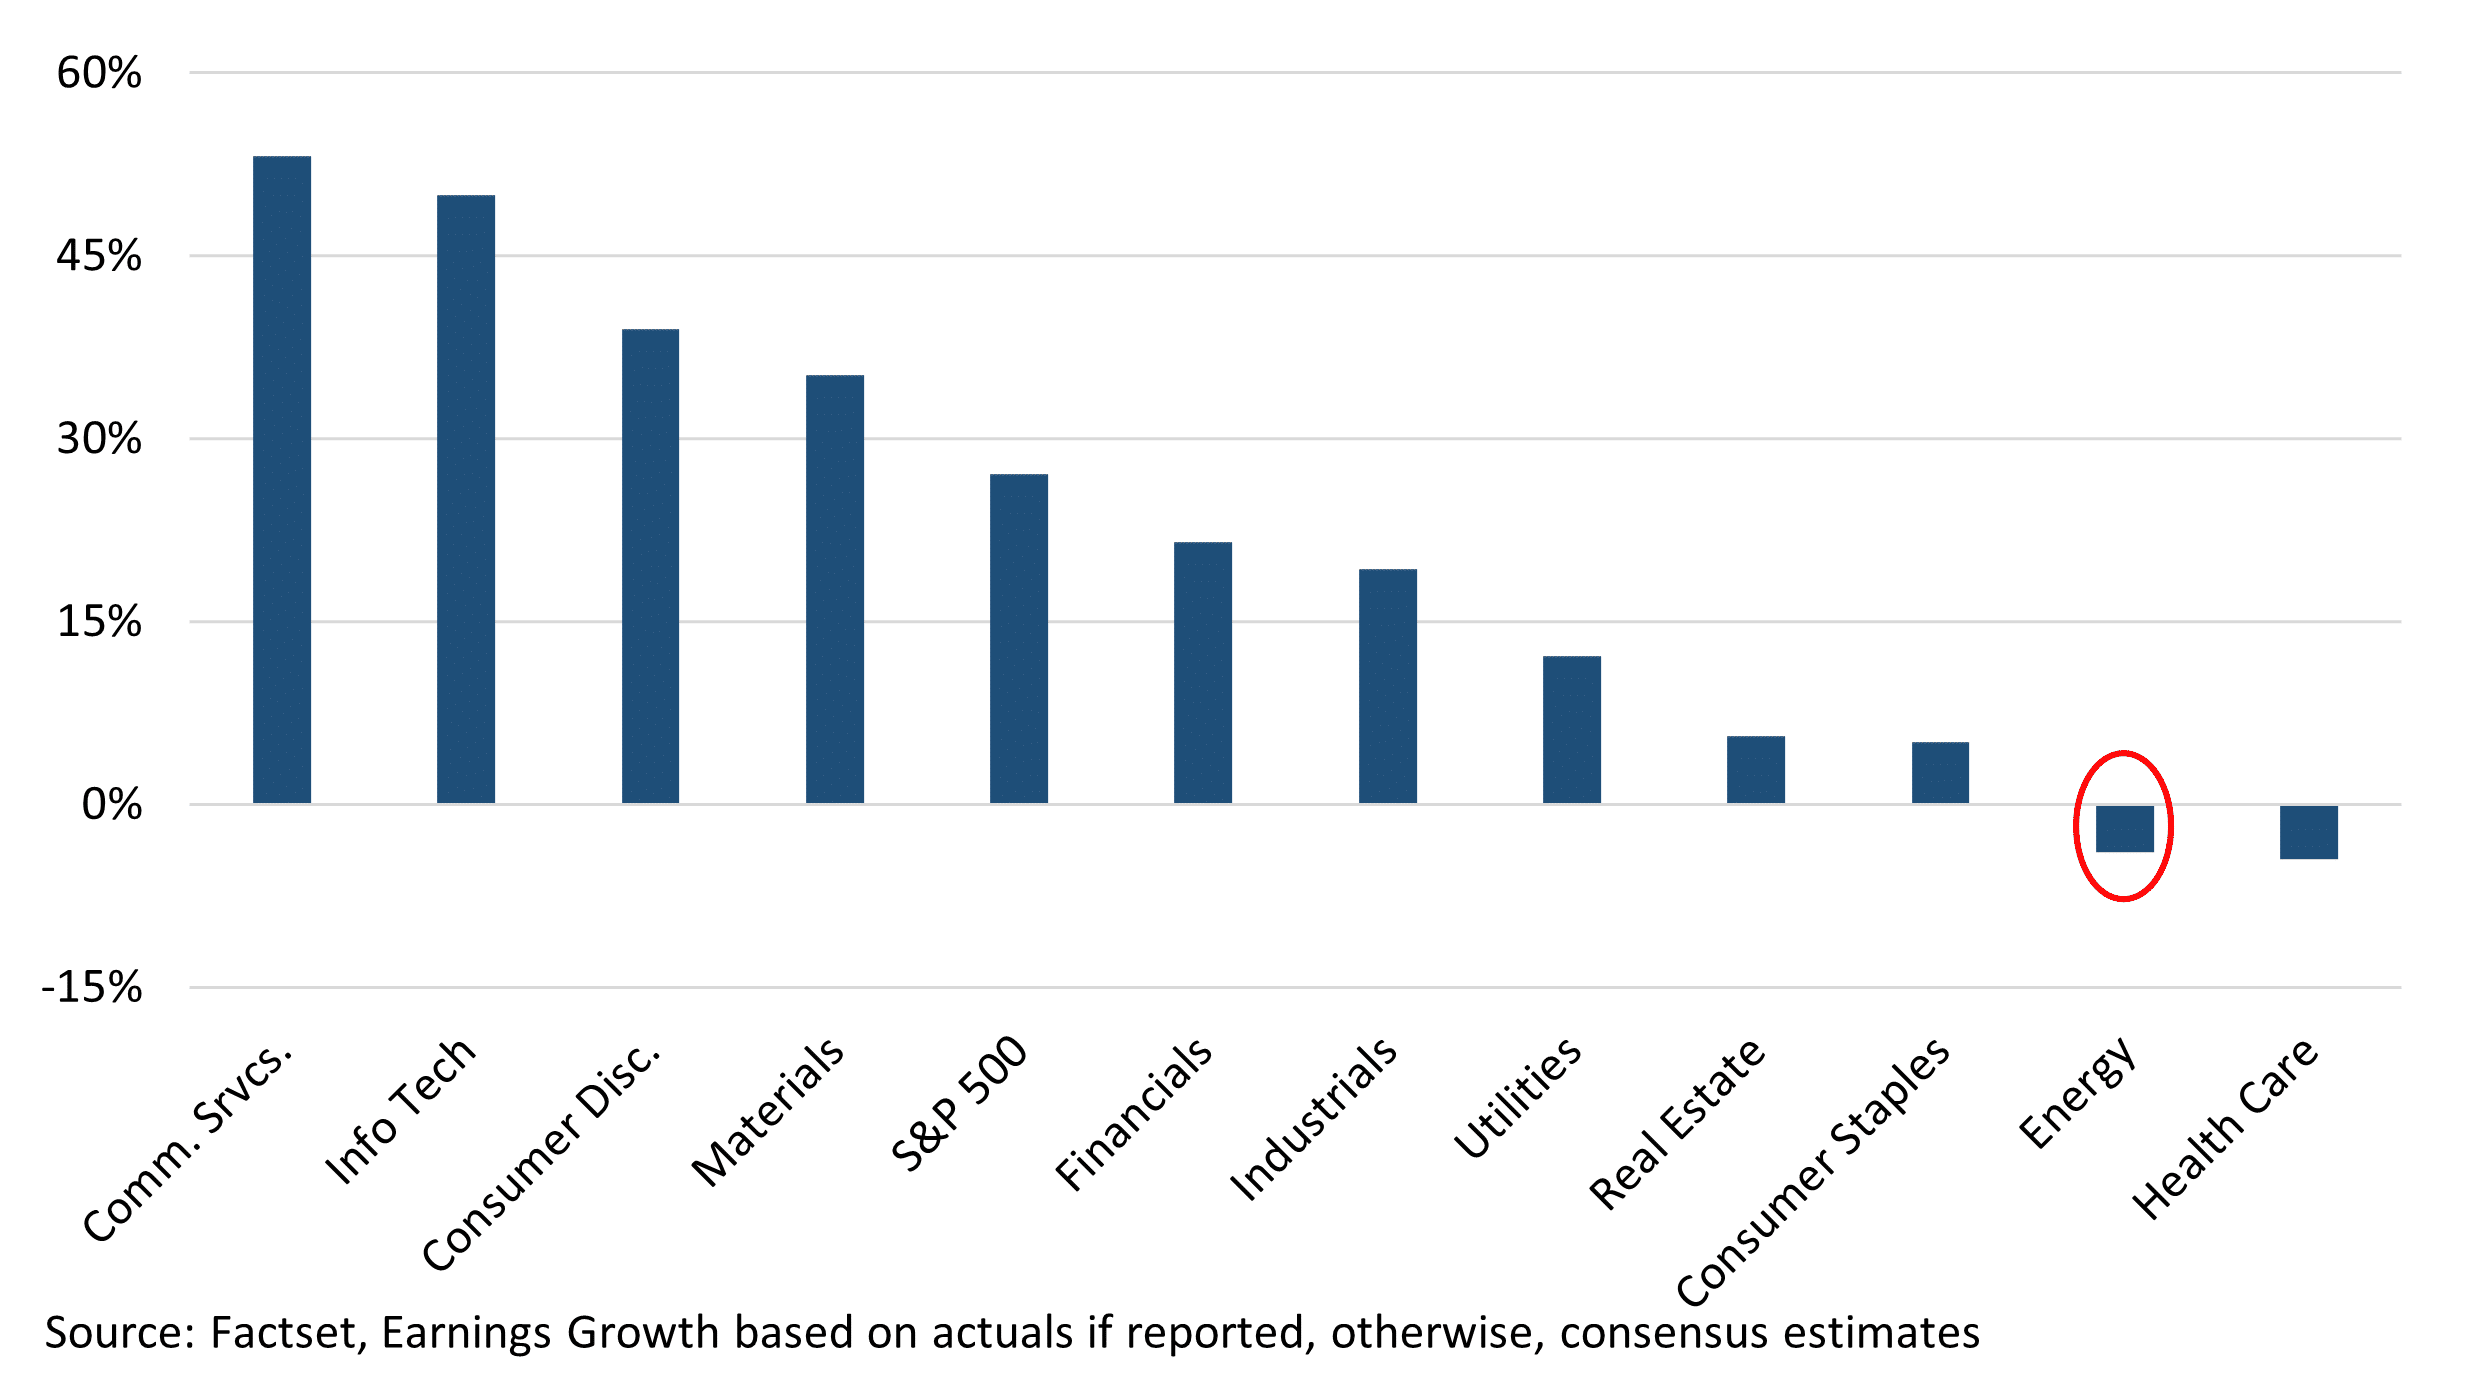
- Technology (33% of the S&P 500) remains the market’s main earnings driver: as of May 1, Q1 2026 Info Tech growth should hit 50% (led by Nvidia), with Communication Services (~10%, Alphabet and Meta) at 53%. Excluding both, S&P 500 Q1 earnings would be ~9.3%.
- By contrast, Energy is expected to post -4% earnings growth. The Iran war’s ~$100/barrel windfall only began two-thirds into Q1, with January and February prices much lower. This is why Energy stocks rose 37% in Q1 before rolling over in April, as analysts slashed longer-term estimates.
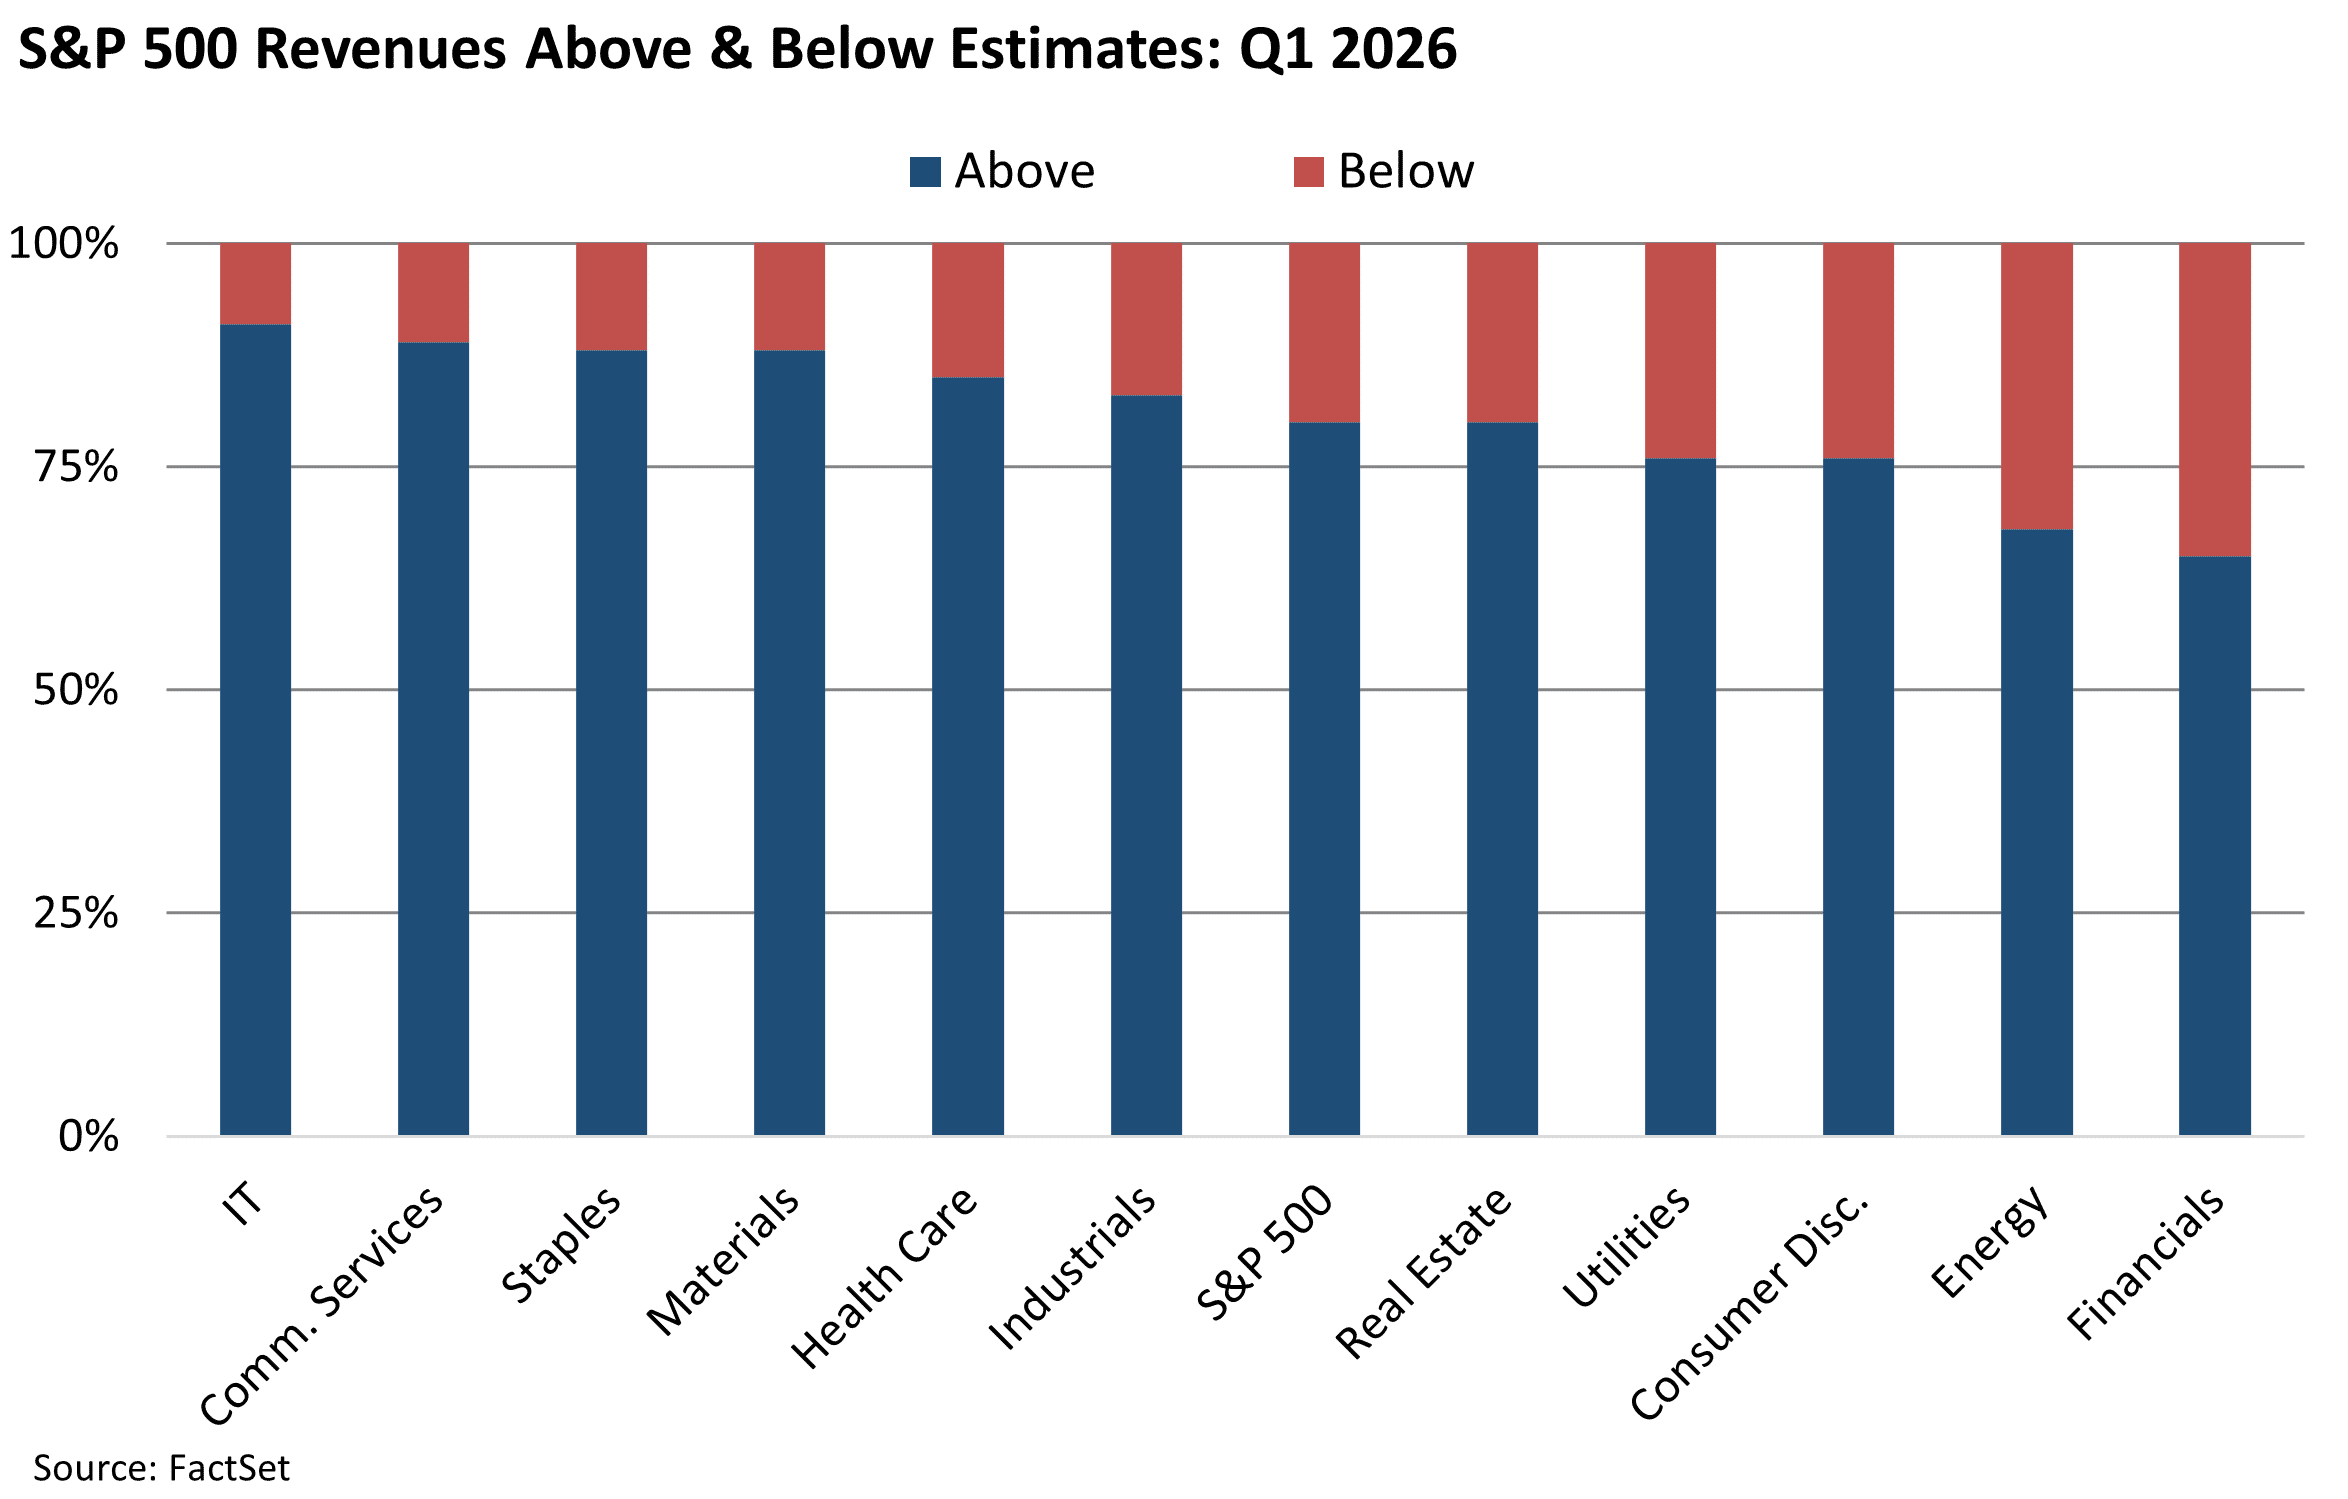
The market loves Tech based on expectations of future earnings growth due to anticipated AI-related revenues. Bulls will tell you “not only did Energy companies see negative actual earnings growth but the future looks no better – we can tell.” And as the charts below show, they are “right.” As FactSet reports:
“At the sector level, the Information Technology (91%) sector has the highest percentage of companies reporting revenues above estimates, while the Financials (65%) and Energy (68%) sectors have the lowest percentages of companies reporting revenues above estimates….
As FactSet continues, “… the Energy sector is the only sector that has recorded a decrease in its earnings growth rate since the end of the quarter due to downward revisions to earnings estimates and negative earnings surprises.”
So why is the KCR team underwhelmed by this?
First Up – Information Technology:
- This is classic extrapolation bias, a behavioral error that has plagued investors since records began
- KCR wrote a note demonstrating how this error, and it is an error, in judgement could easily be seen in how investors in NVDA went from refusing to believe the past data to suddenly extrapolating it forward…forever.
- For more on the topic, we strongly recommend reading our piece Apple, Coke, Tesla, WorldCom & Warren Buffett: What Can We Learn? which digs into this issue at a systematic level across the investment landscape
Second – Energy:
- This too is extrapolation bias – investors have seen mediocre earnings out of Energy stocks for years and now they expect earnings to stay flat to negative for years
- This despite the fact that the catastrophic fallout from our attack on Iran has created structural deficiencies in energy and food supplies with no solution in sight.
- Energy looks to us like NVDA and Technology did years ago; the bull case is in front of us while analyst and investors’ bullish focus is fixated on Tech stocks due to their trailing performance – a concept we explained in our recent Energy note
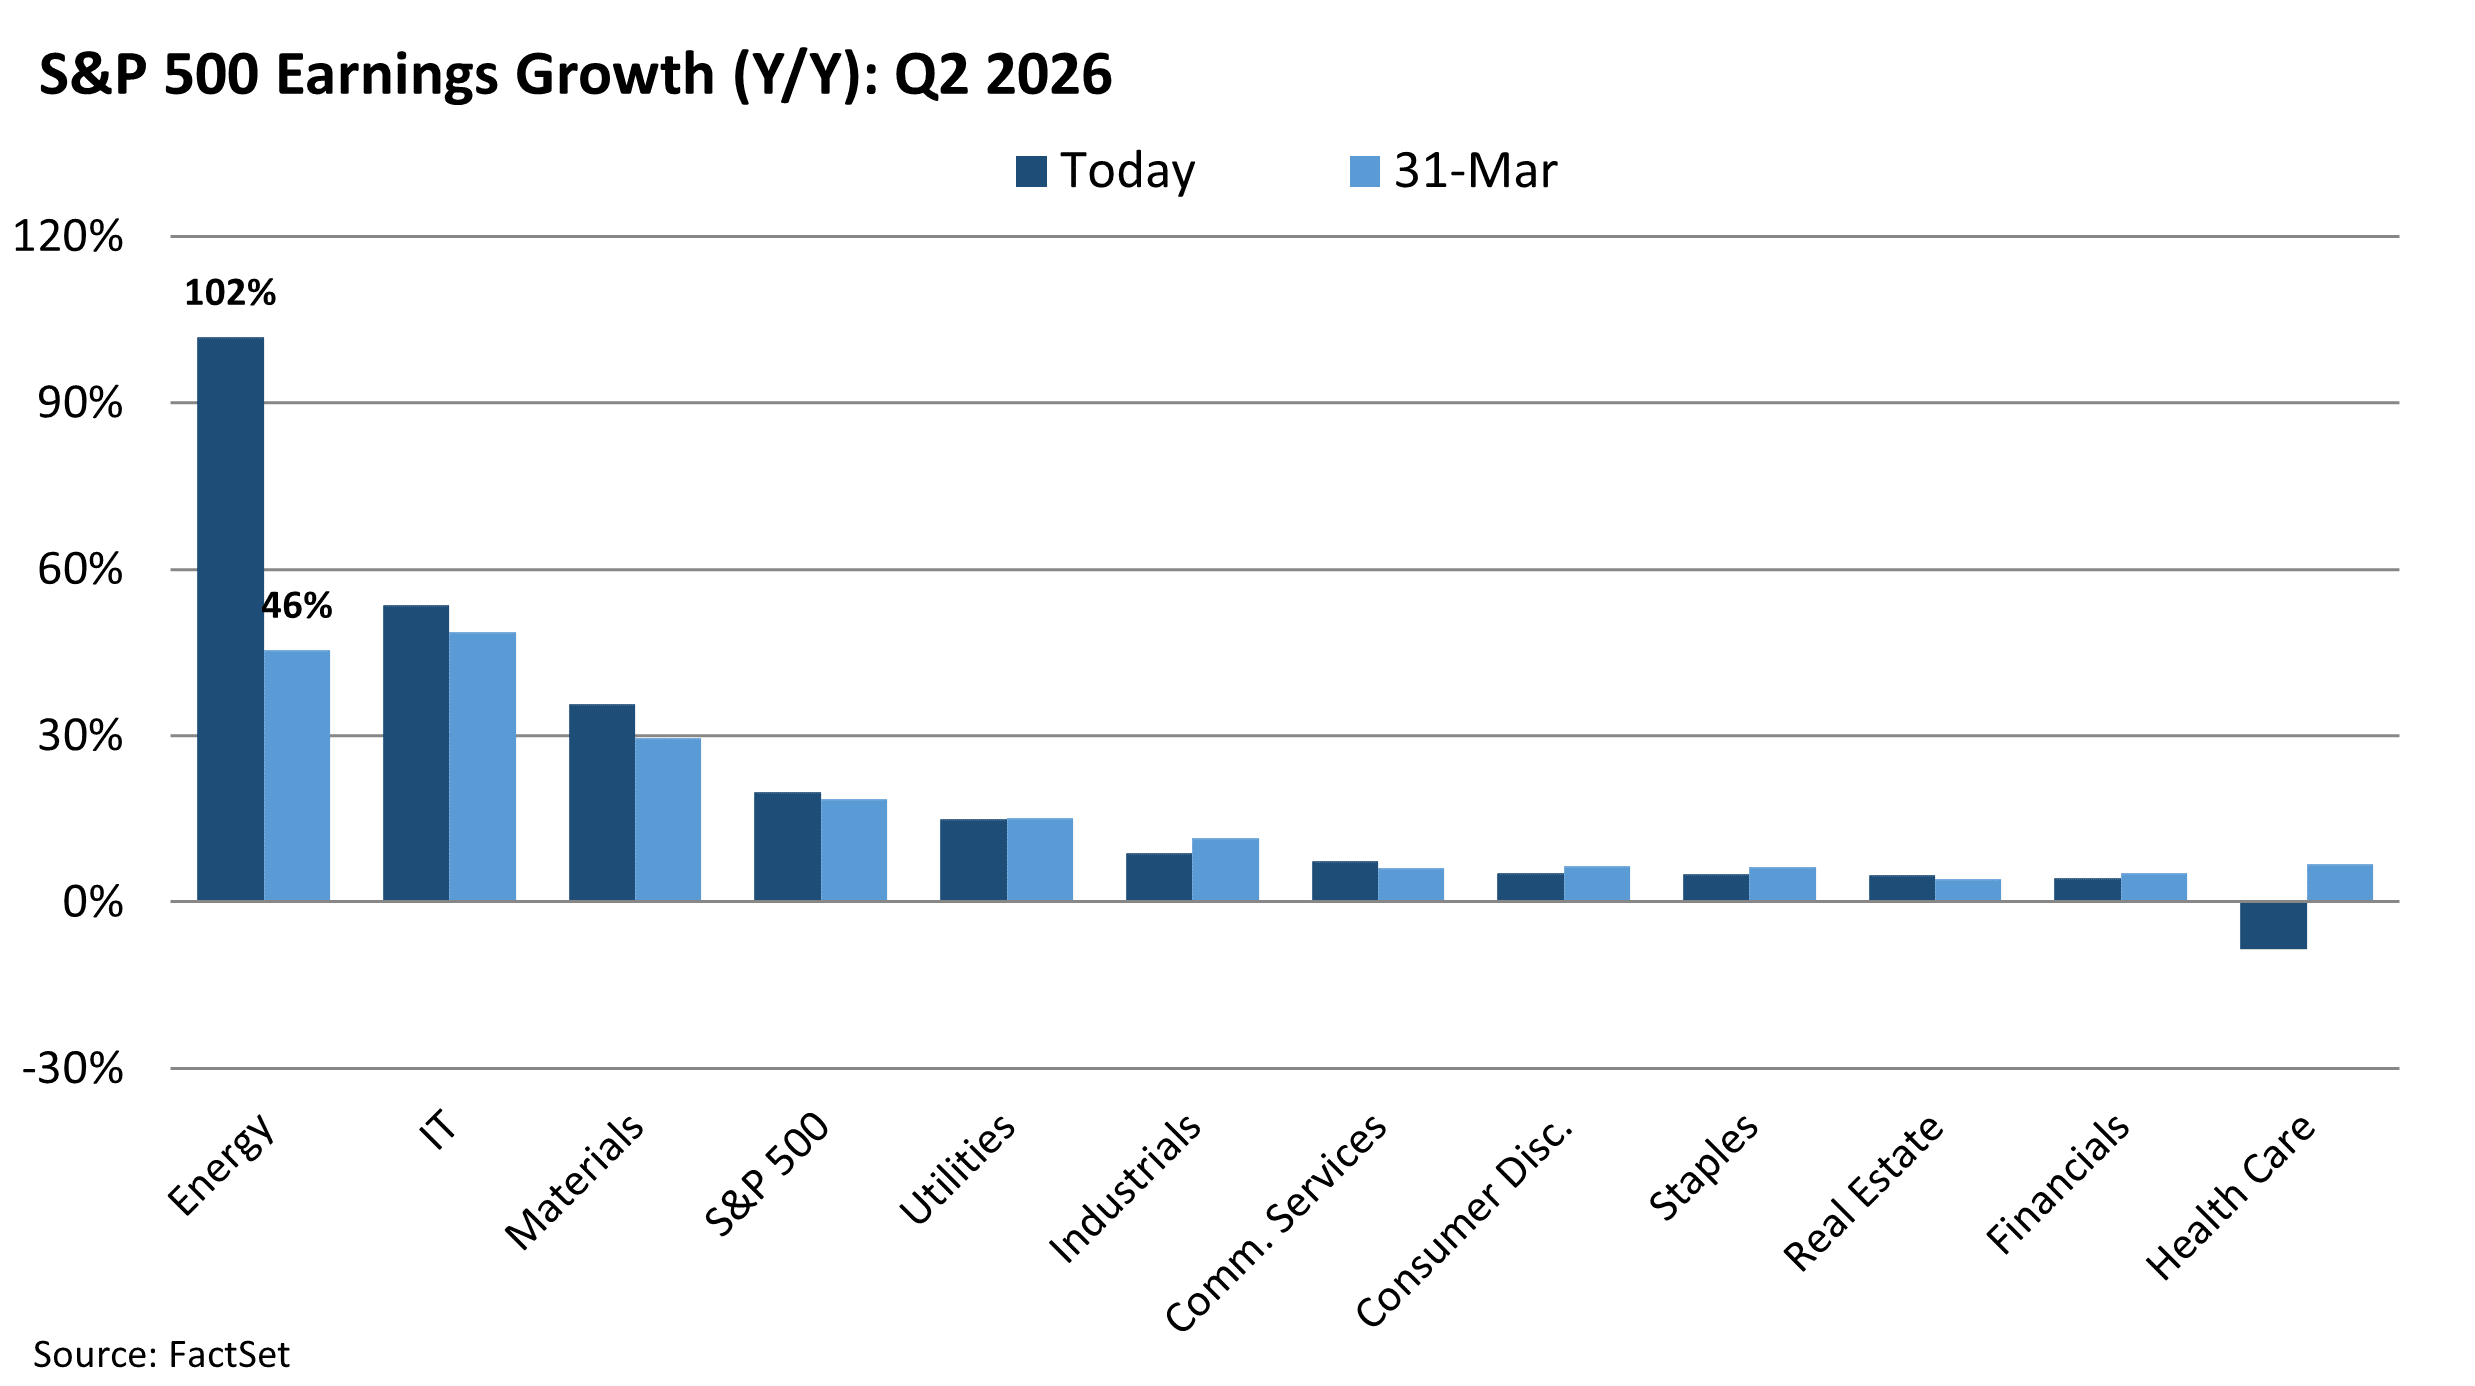
Although only some Energy companies benefitted from the brief mid-quarter oil spike, analysts have raised Q2 2026 earnings estimates for Energy more than any other sector—now well above even Information Technology.
The chart below compares current expectations (navy) with those at March 31 (light blue). Energy’s leap from ~45% to over 100% dwarfs every other revision, confirming that the recent oil move has finally flowed through to Q2 estimates.
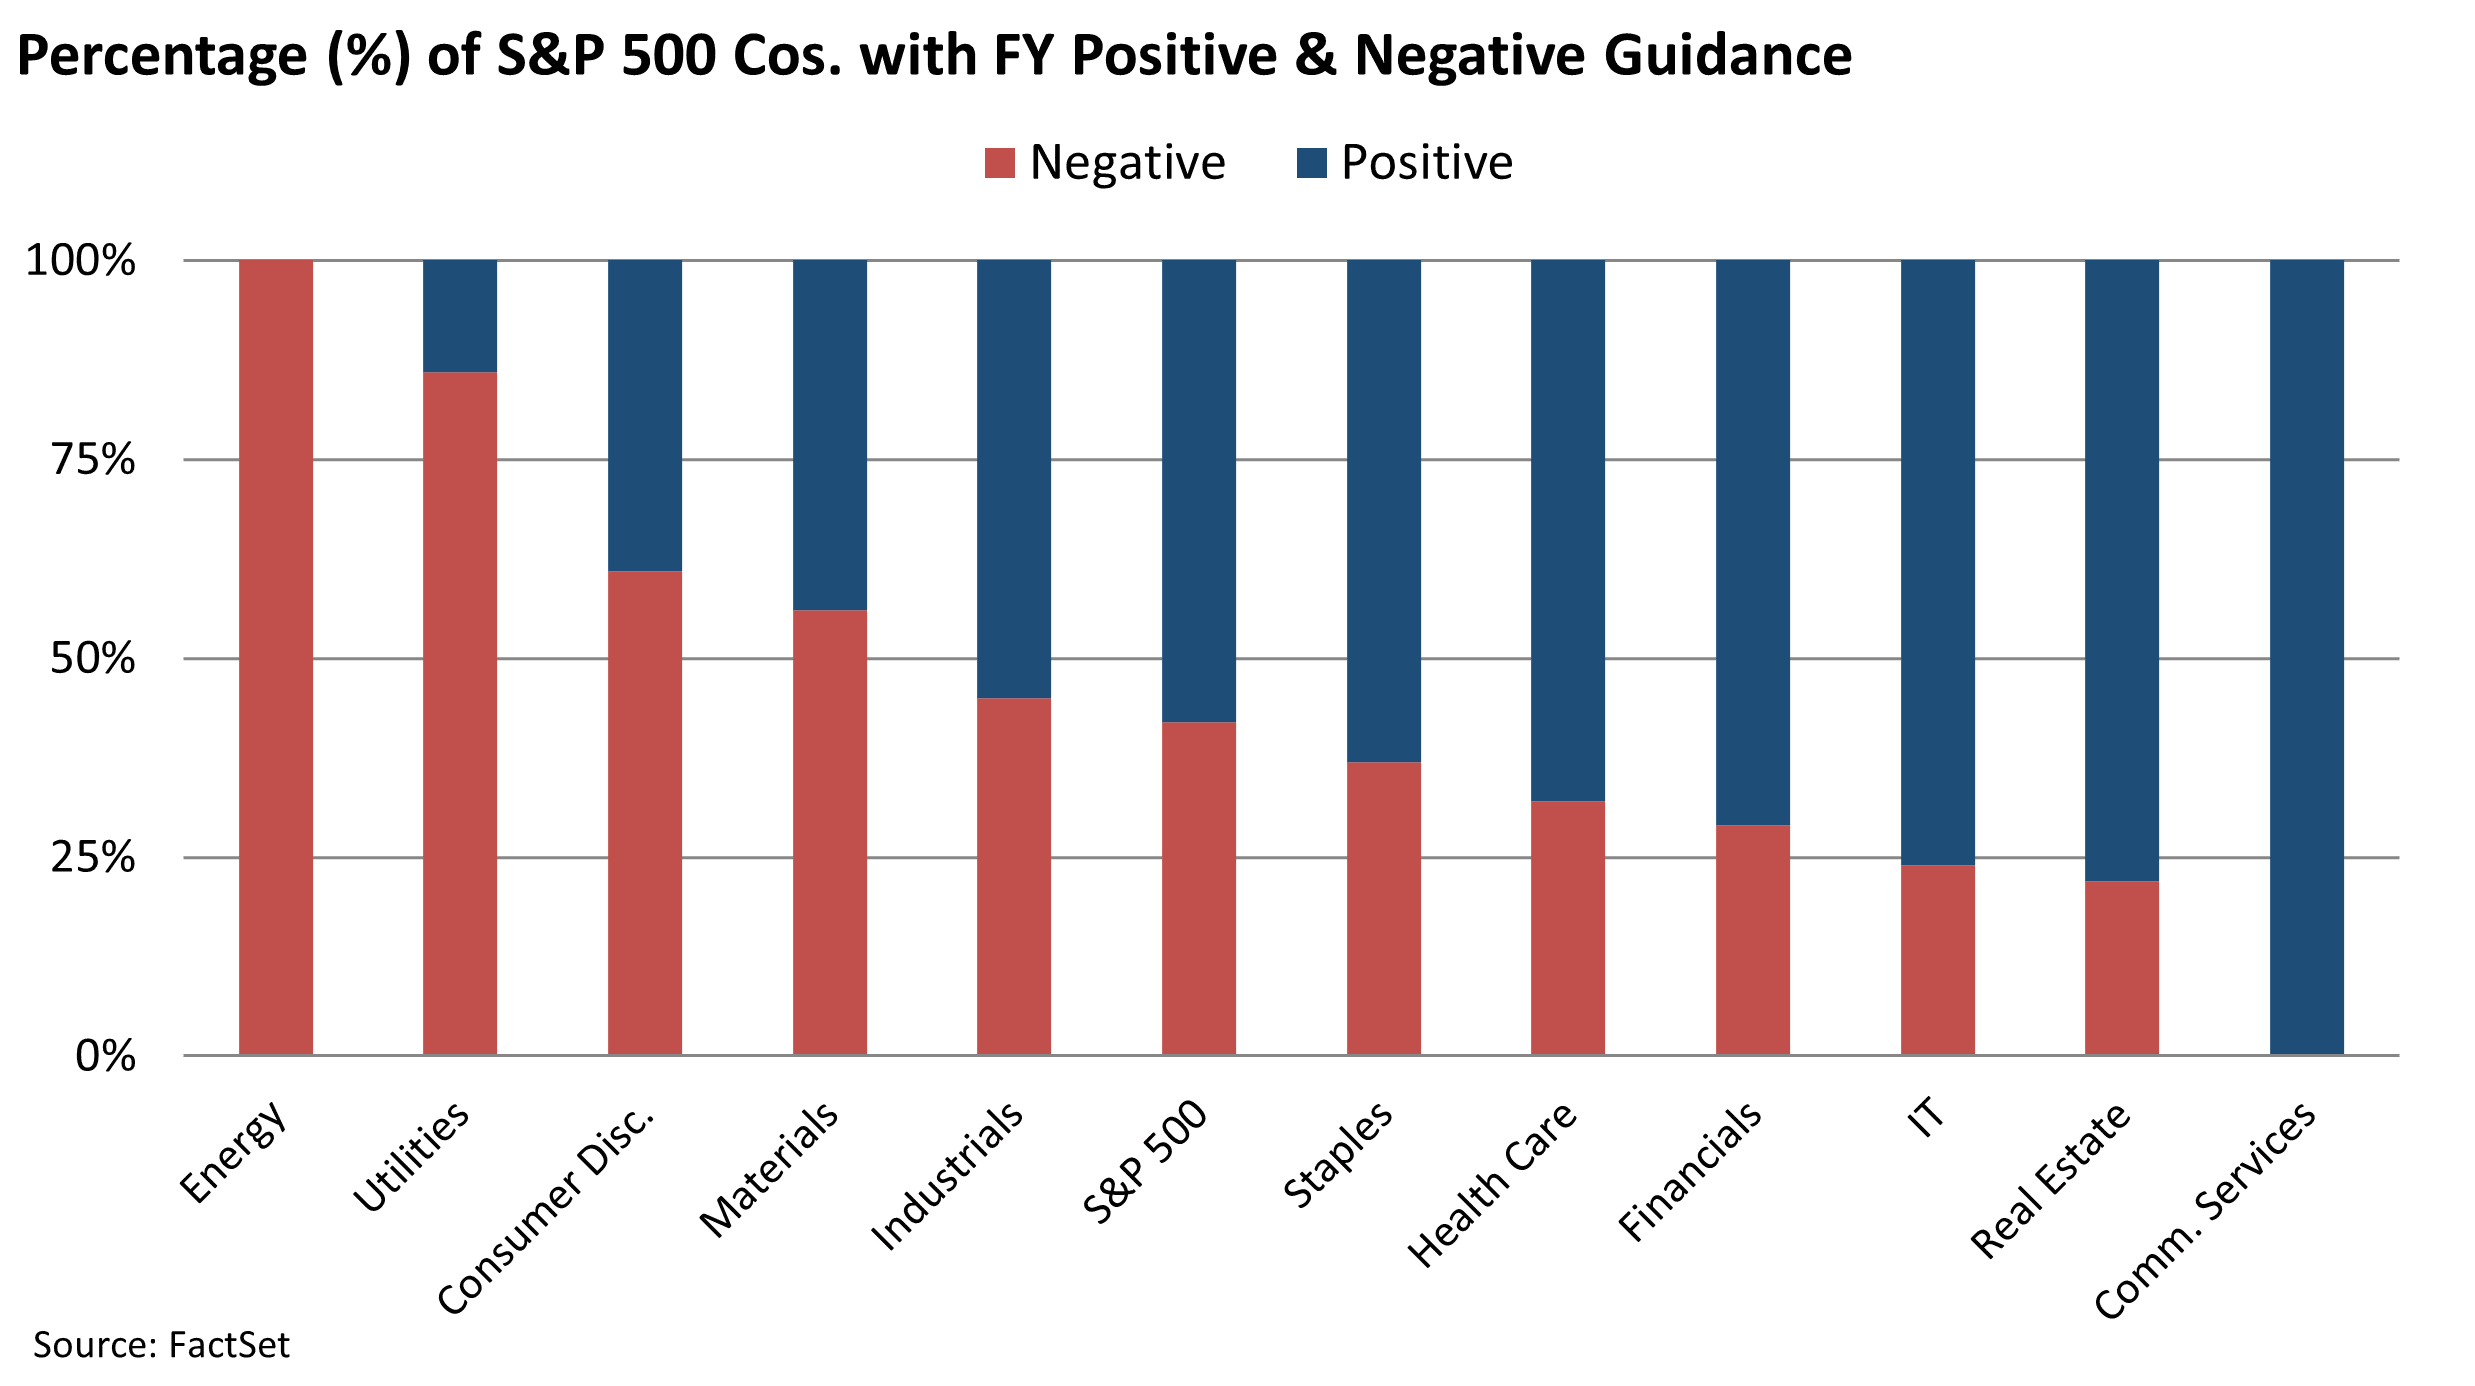
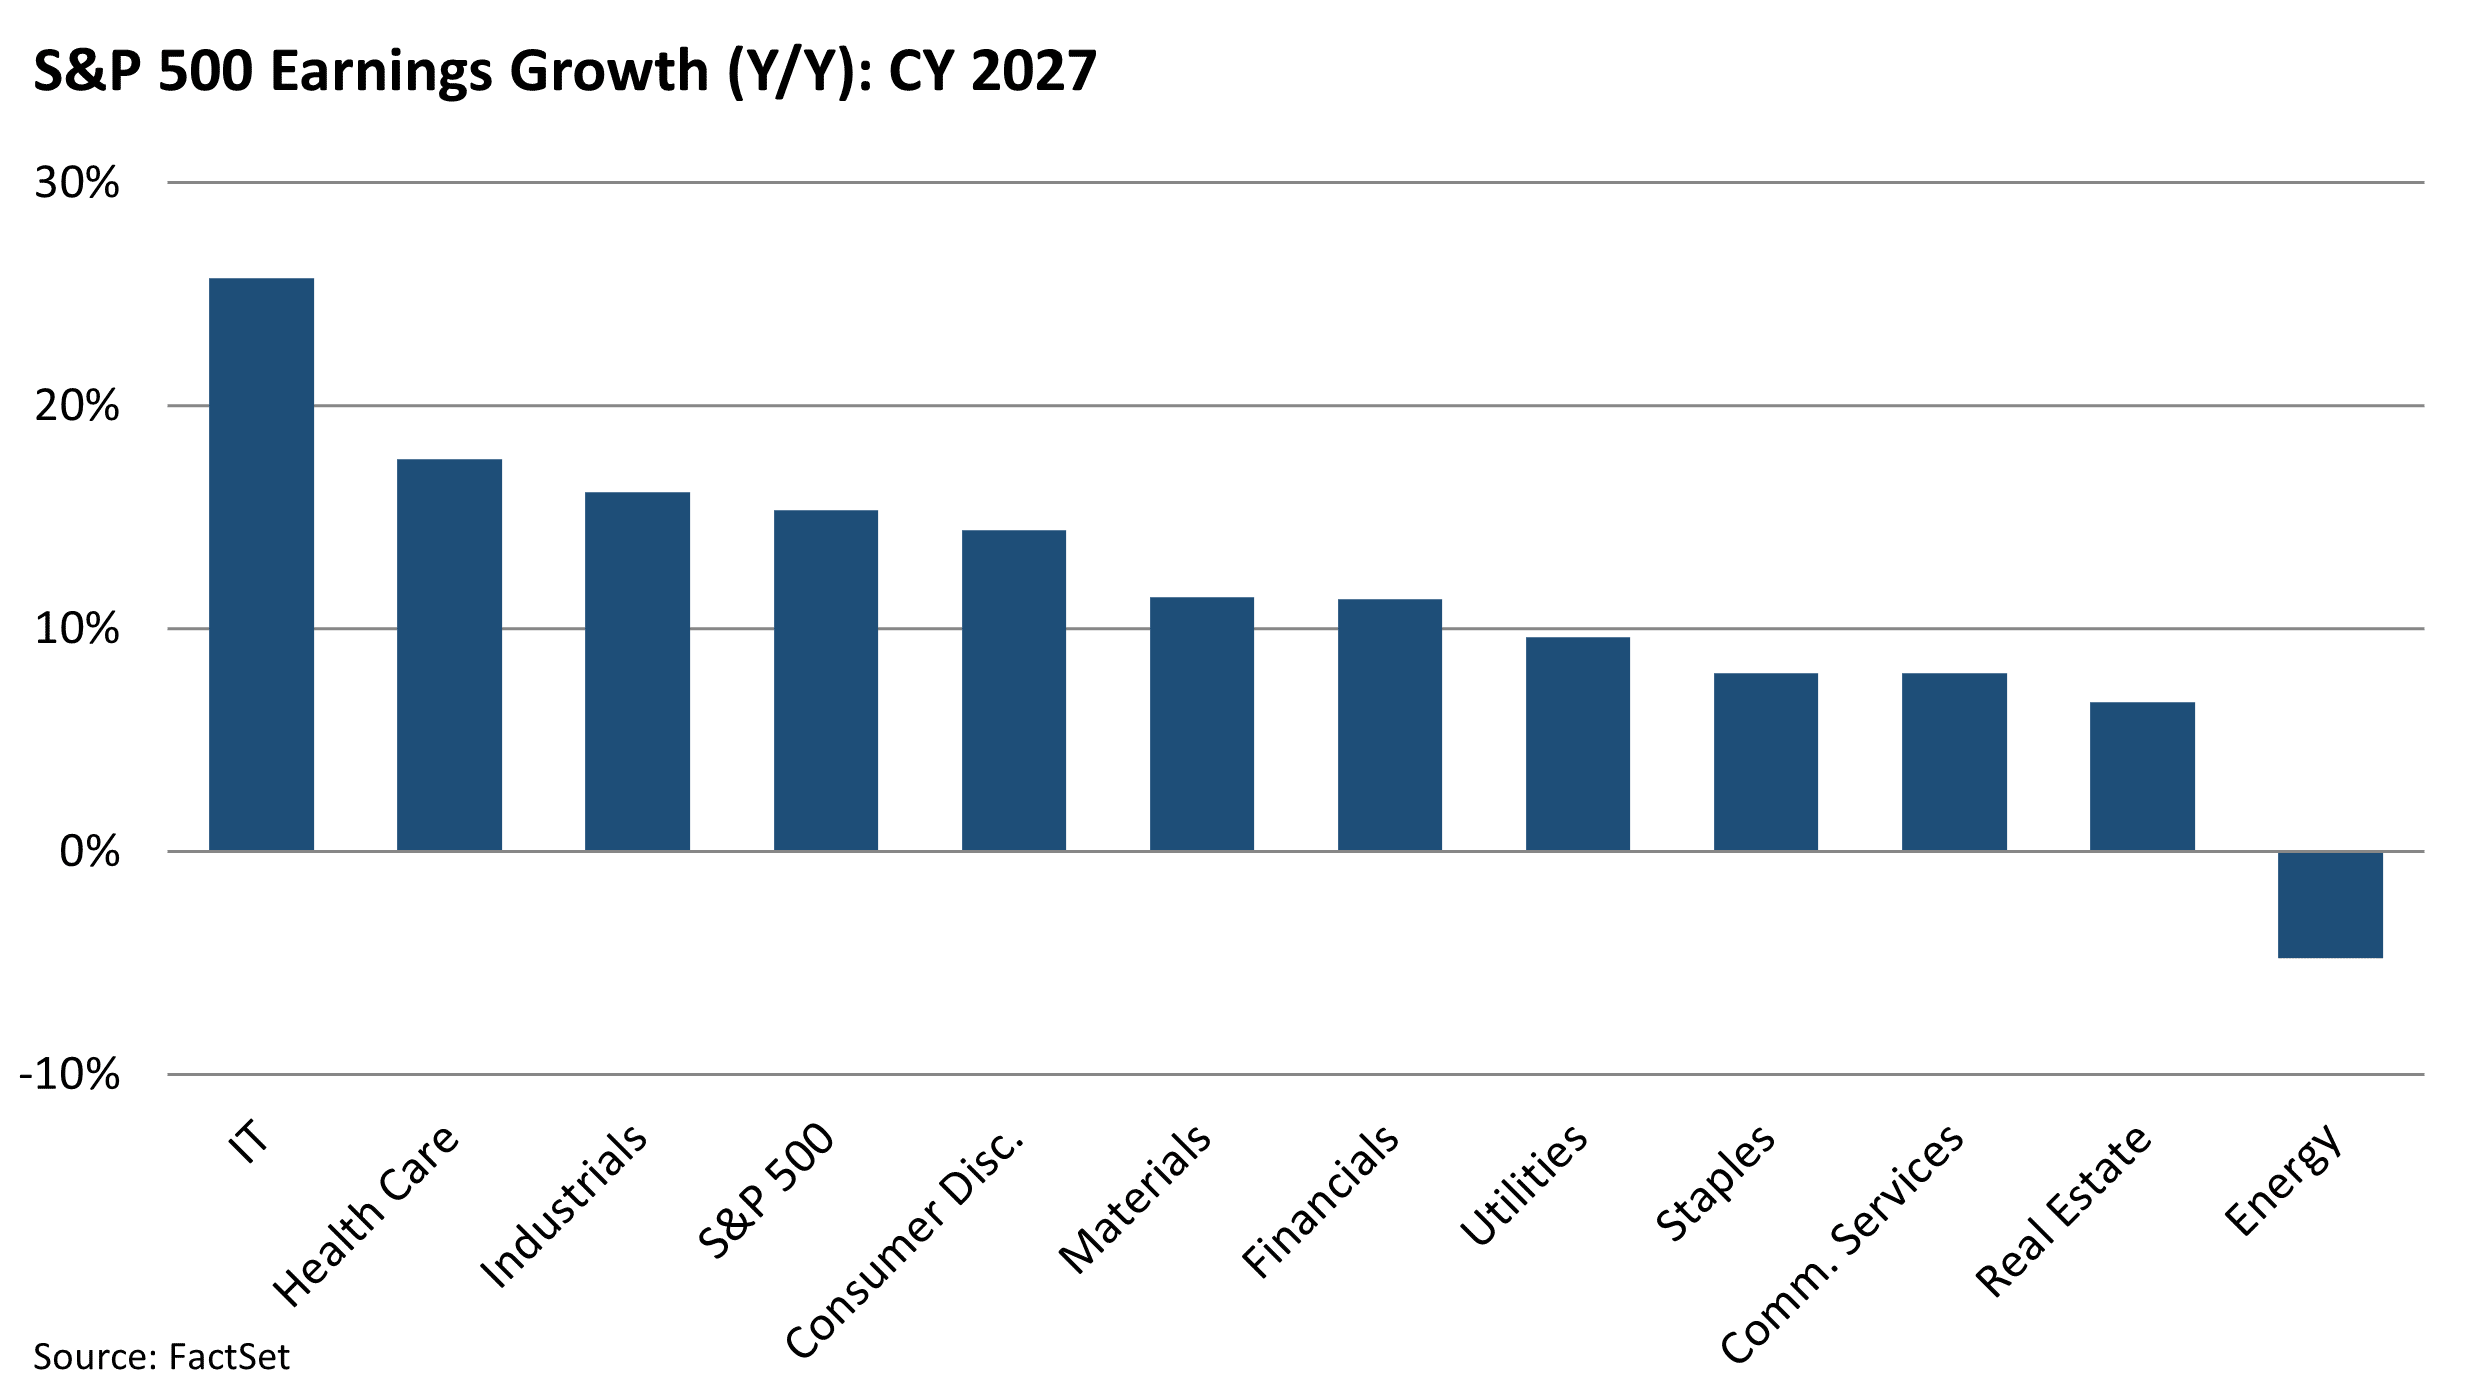
Part of the reason the increases in earnings expectations for Q2 2026 jumped so high for energy is that they were very low to begin with. But these same analysts are entirely confident that the recent increase in their Q2 earnings’ estimate is a short-term phenomenon. We can see this in the chart below which shows the expected earnings growth for every sector in 2027.
In an effort to make this more tactile and relatable we decided to look at the biggest stocks in each sector. In the table below we show the Q1 2026 earnings growth for the 10 largest companies in the S&P 500 Info Tech and Energy Sectors, side-by-side.
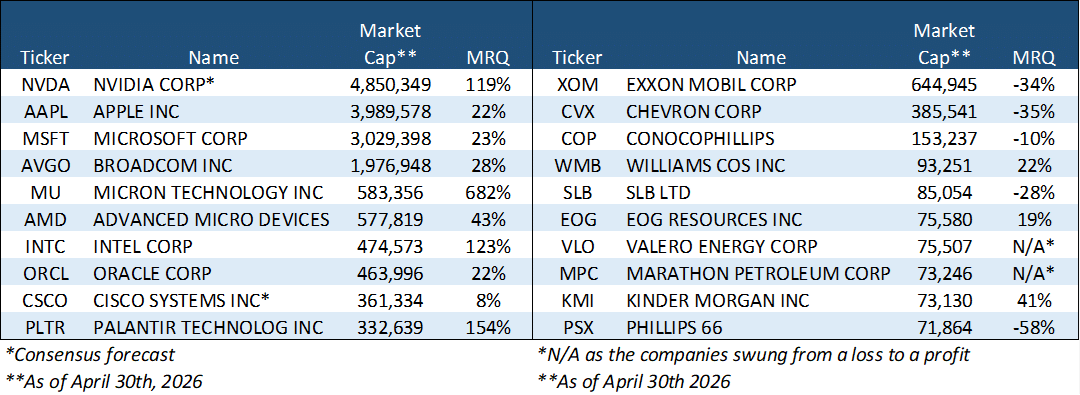
This is not complicated. On the left you can see the 10 biggest tech stocks have seen earnings growth explode higher. On the right you can see the biggest Energy stocks have been experiencing serious profit declines. As of April, analysts now believe tech will have explosive earnings growth in Q2 of this year but then are pessimistic on Energy’s future earnings growth.
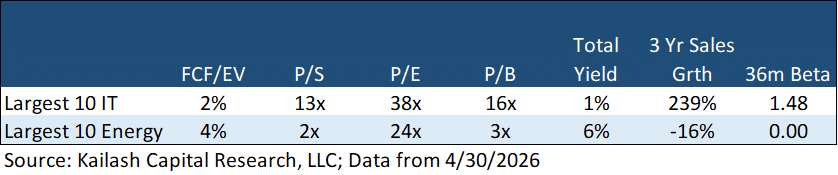
In the table below we show the fundamental data for the same 10 largest Information Technology companies (top row) and the 10 largest Energy companies (second row).
Again. This is not complicated.
The problem for investors is that the bullishness on tech now has these 10 big Tech stocks trading at 50x free cash flow (2% FCF Yield), 13x sales, and 38x earnings. That means if these giant companies, valued in the trillions, fail to deliver on these bullish expectations over the ensuing years, they could suffer serious declines. The setup today is obviously reminiscent of Tech stocks in the internet bubble.
Contrast that with the 10 largest Energy stocks. These stocks trade at a fraction of Tech’s multiples from FCF/EV, P/S, P/E, to P/B. And it is critical we remember that these are trailing numbers over the year ending March 31st, 2026, when oil traded at an average price of $65. [3] Oil is over $100 today as we write this.
So big Energy stocks are cheap vs. big Tech even when using oil prices that were significantly lower than current prices. Analysts are bearish on Energy’s prospects in 2027 because they believe they know what oil prices will be in that year. The term we use for such moments is “trough on trough” – low multiples on low earnings and we are fond of such situations.
We think it worth noting that the 10 largest Energy stocks have a Beta of 0.0003 – that is not a typo. Generally speaking we are critics of beta as an optimization process over long horizons. You can read some of our thinking in The Collapse of Common Sense: The Great Beta Breakdown and Is Equity Beta Broken. But we do acknowledge that it is widely used and therefore becomes a selection feature for many portfolios and being able to buy Energy – a group of stocks that investors perceive as being amplifiers of market moves – with a beta of zero is something we have never seen.
Below we show KCR’s top five ranked large cap Energy Stocks with our five worst ranked Tech stocks.

Do you want to get paid 5% a year in total yield to own dirt-cheap energy stocks that are generating an 8% FCF Yield on $65 oil prices?
OR
Would you rather own tech stocks that pay you nothing to own them and generate a nominal FCF Yield?
We think the choice is easy but to each their own. The stocks are listed below.


Disclaimer
The information, data, analyses, and opinions presented herein (a) do not constitute investment advice, (b) are provided solely for informational purposes and therefore are not, individually or collectively, an offer to buy or sell a security, (c) are not warranted to be correct, complete or accurate, and (d) are subject to change without notice. Kailash Capital Research, LLC and its affiliates (collectively, “KCR”) shall not be responsible for any trading decisions, damages, or other losses resulting from, or related to, the information, data, analyses or opinions or their use. The information herein may not be reproduced or retransmitted in any manner without the prior written consent of KCR. In preparing the information, data, analyses, and opinions presented herein, KCR has obtained data, statistics, and information from sources it believes to be reliable. KCR, however, does not perform an audit or seek independent verification of any of the data, statistics, and information it receives. KCR and its affiliates do not provide tax, legal, or accounting advice. This material has been prepared for informational purposes only and is not intended to provide, and should not be relied on for tax, legal, or accounting advice. You should consult your tax, legal, and accounting advisors before engaging in any transaction.
Nothing herein shall limit or restrict the right of affiliates of KCR to perform investment management or advisory services for any other persons or entities. Furthermore, nothing herein shall limit or restrict affiliates of KCR from buying, selling, or trading securities or other investments for their own accounts or for the accounts of their clients. Affiliates of KCR may at any time have, acquire, increase, decrease, or dispose of the securities or other investments referenced in this publication. KCR shall have no obligation to recommend securities or investments in this publication as a result of its affiliates’ investment activities for their own accounts or for the accounts of their clients.
© 2026 Kailash Capital Research, LLC – All rights reserved.
May 14, 2026 |
| Authors: Matthew Malgari, Nathan Przybylo, Dr. Sanjeev Bhojraj and John Durkin
May 14, 2026
Authors: Matthew Malgari, Nathan Przybylo, Dr. Sanjeev Bhojraj and John Durkin