What is driving this market (crazy)?
The S&P 500 is up roughly 9% so far in April – less than one month! This despite the fact that the ongoing blockades in the Strait of Hormuz could turn into another “endless war” and is preventing many countries from getting the oil, natural gas, jet fuel, fertilizer, and petrochemicals they need to keep their economies functioning. Sure, the U.S. is largely energy-independent, but we still live in a global economy. When our biggest trading partners are suffering the US will not be immune.
Get our insights direct to your inbox: SUBSCRIBE
Investors appear to be looking beyond all of this, even though experts say that even if the Strait of Hormuz opened tomorrow it would take two to five months for oil and natural gas supplies to return to normal. [1,2,3] Inflation in the U.S. was already moving in the wrong direction and prices at the pump go up quickly when an oil shock happens but come down much more slowly when the shock subsides.
None of that seems to matter. What does matter? It looks like AI optimism and AI pessimism are calling the shots, defining both the top and bottom performers.
A recent article in the Wall Street Journal notes that 16 of the 20 highest performing stocks in the S&P 500 so far this year are all tied to the AI infrastructure boom. [4] Most of them provide the “picks and shovels” AI datacenters need, such as chips, servers, optical connections, heating and cooling equipment, etc. These big winners include well-known names like Sandisk, Western Digital, Seagate and Micron, and some that are less familiar, such as Coherent and Monolithic.
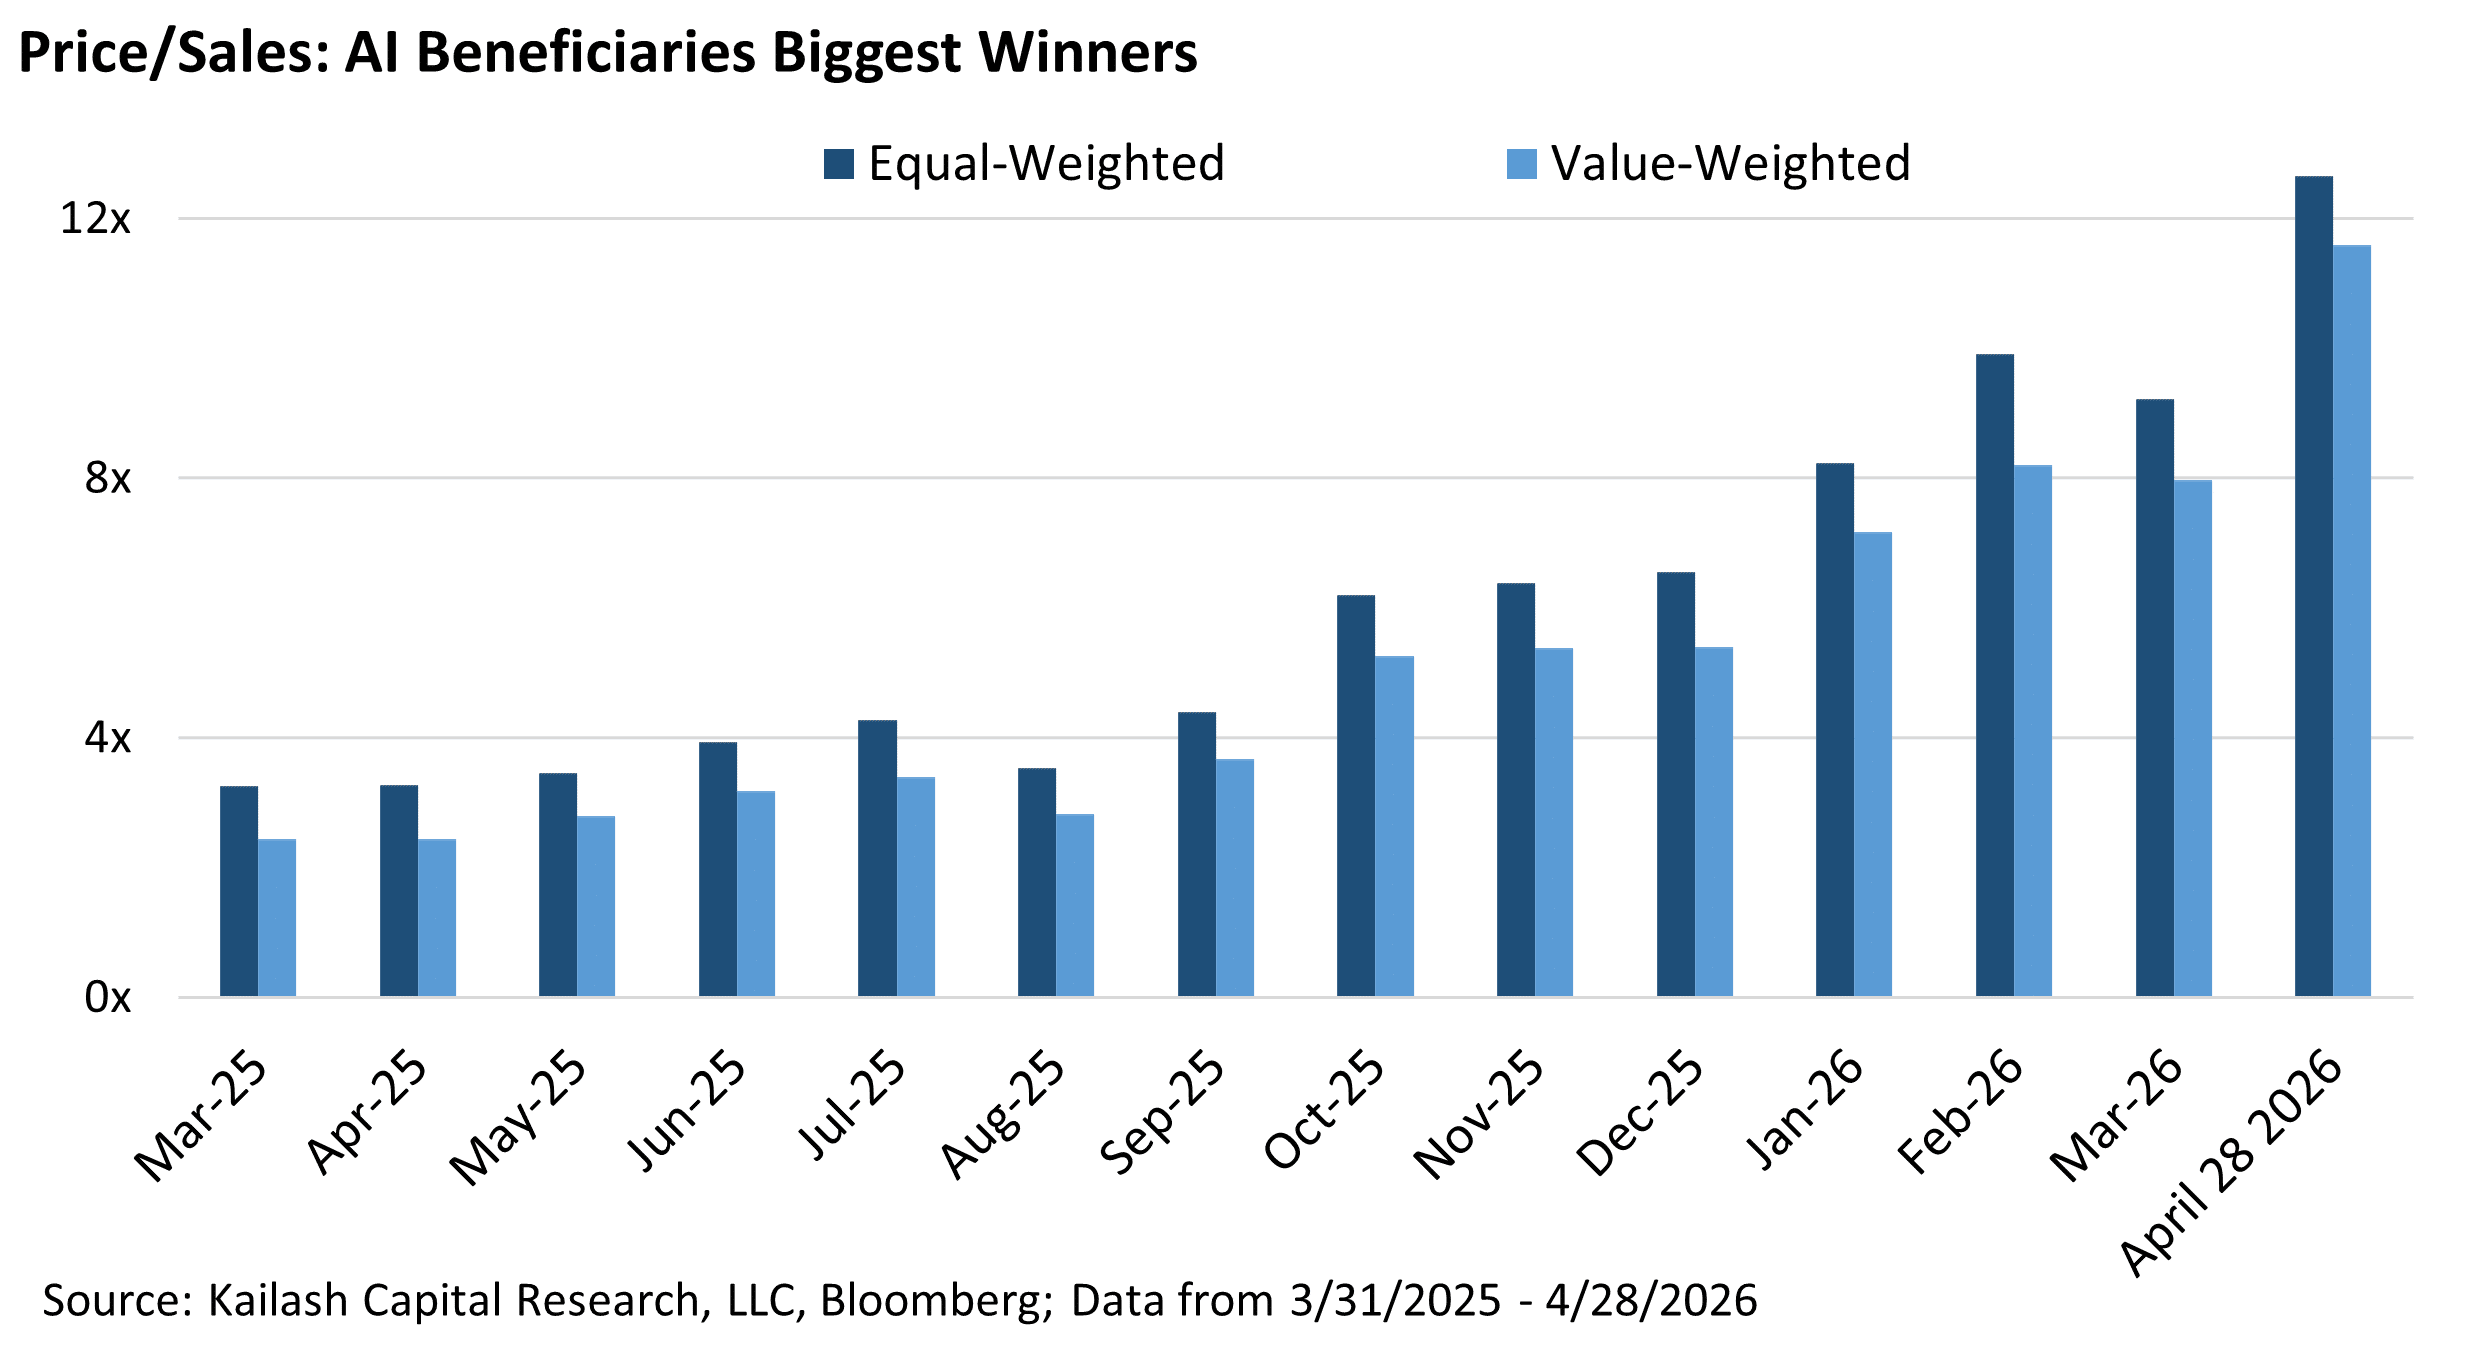
Just under a year ago these stocks were trading at roughly 3X sales. Since then, the price investors have been willing to pay for each $1 of revenue these companies generate has been climbing, except for a brief, minor dip in March, when the war in Iran was hot. Now (as of late April) the same stocks are trading at roughly 12X sales.
We have written about this before: a double-digit price-to-sales ratio is a big warning sign. There is no empirical evidence to suggest that investments made above 10x sales will be good for your portfolio. In fact, as
we have shown, the payoff vs. the market for stocks at 10x price to sales or higher has always been negative over the one, two, and three year forward horizon.
But wait – there’s more. The WSJ article also looks at the worst performers in the S&P 500 YTD and guess what – the AI story is also responsible. The biggest losers are mainly Software companies that were, just years ago, hailed as unassailable and destined to “eat the world.” Their recurring revenues seemed stable and highly attractive until AI coding tools were released early this year that caused the “SaaSpocalypse” in February. Those stocks sank as investors feared the SaaS business model could be blown to bits.
Software & Service stocks make up only 6% of the stocks in the S&P 500 ETF. Yet if we just look at the 50 worst performing stocks in the S&P 500, over 20% of them are Software & Service companies. Specifically, 11 of the S&P 500’s bottom 50 performers over the last year are software companies. These stocks had been trading at similar nosebleed price-to-sales ratios, roughly 10X, before they were pummeled by AI. Now they trade at just under 5x P/S, on average. Not exactly cheap, so it’s difficult to say these stocks are now a bargain, but as the WSJ article points out, this is “a huge shift in valuation for both groups.” [5]
The chart below shows that Software Stocks have seen their multiples cut in half in just the last year. This, in our view, is an extraordinary juxtaposition of how emotions drive multiples. A year ago investors were so certain that “software was eating the world” they paid nearly 10x sales for these baubles. What did they learn? Nothing.
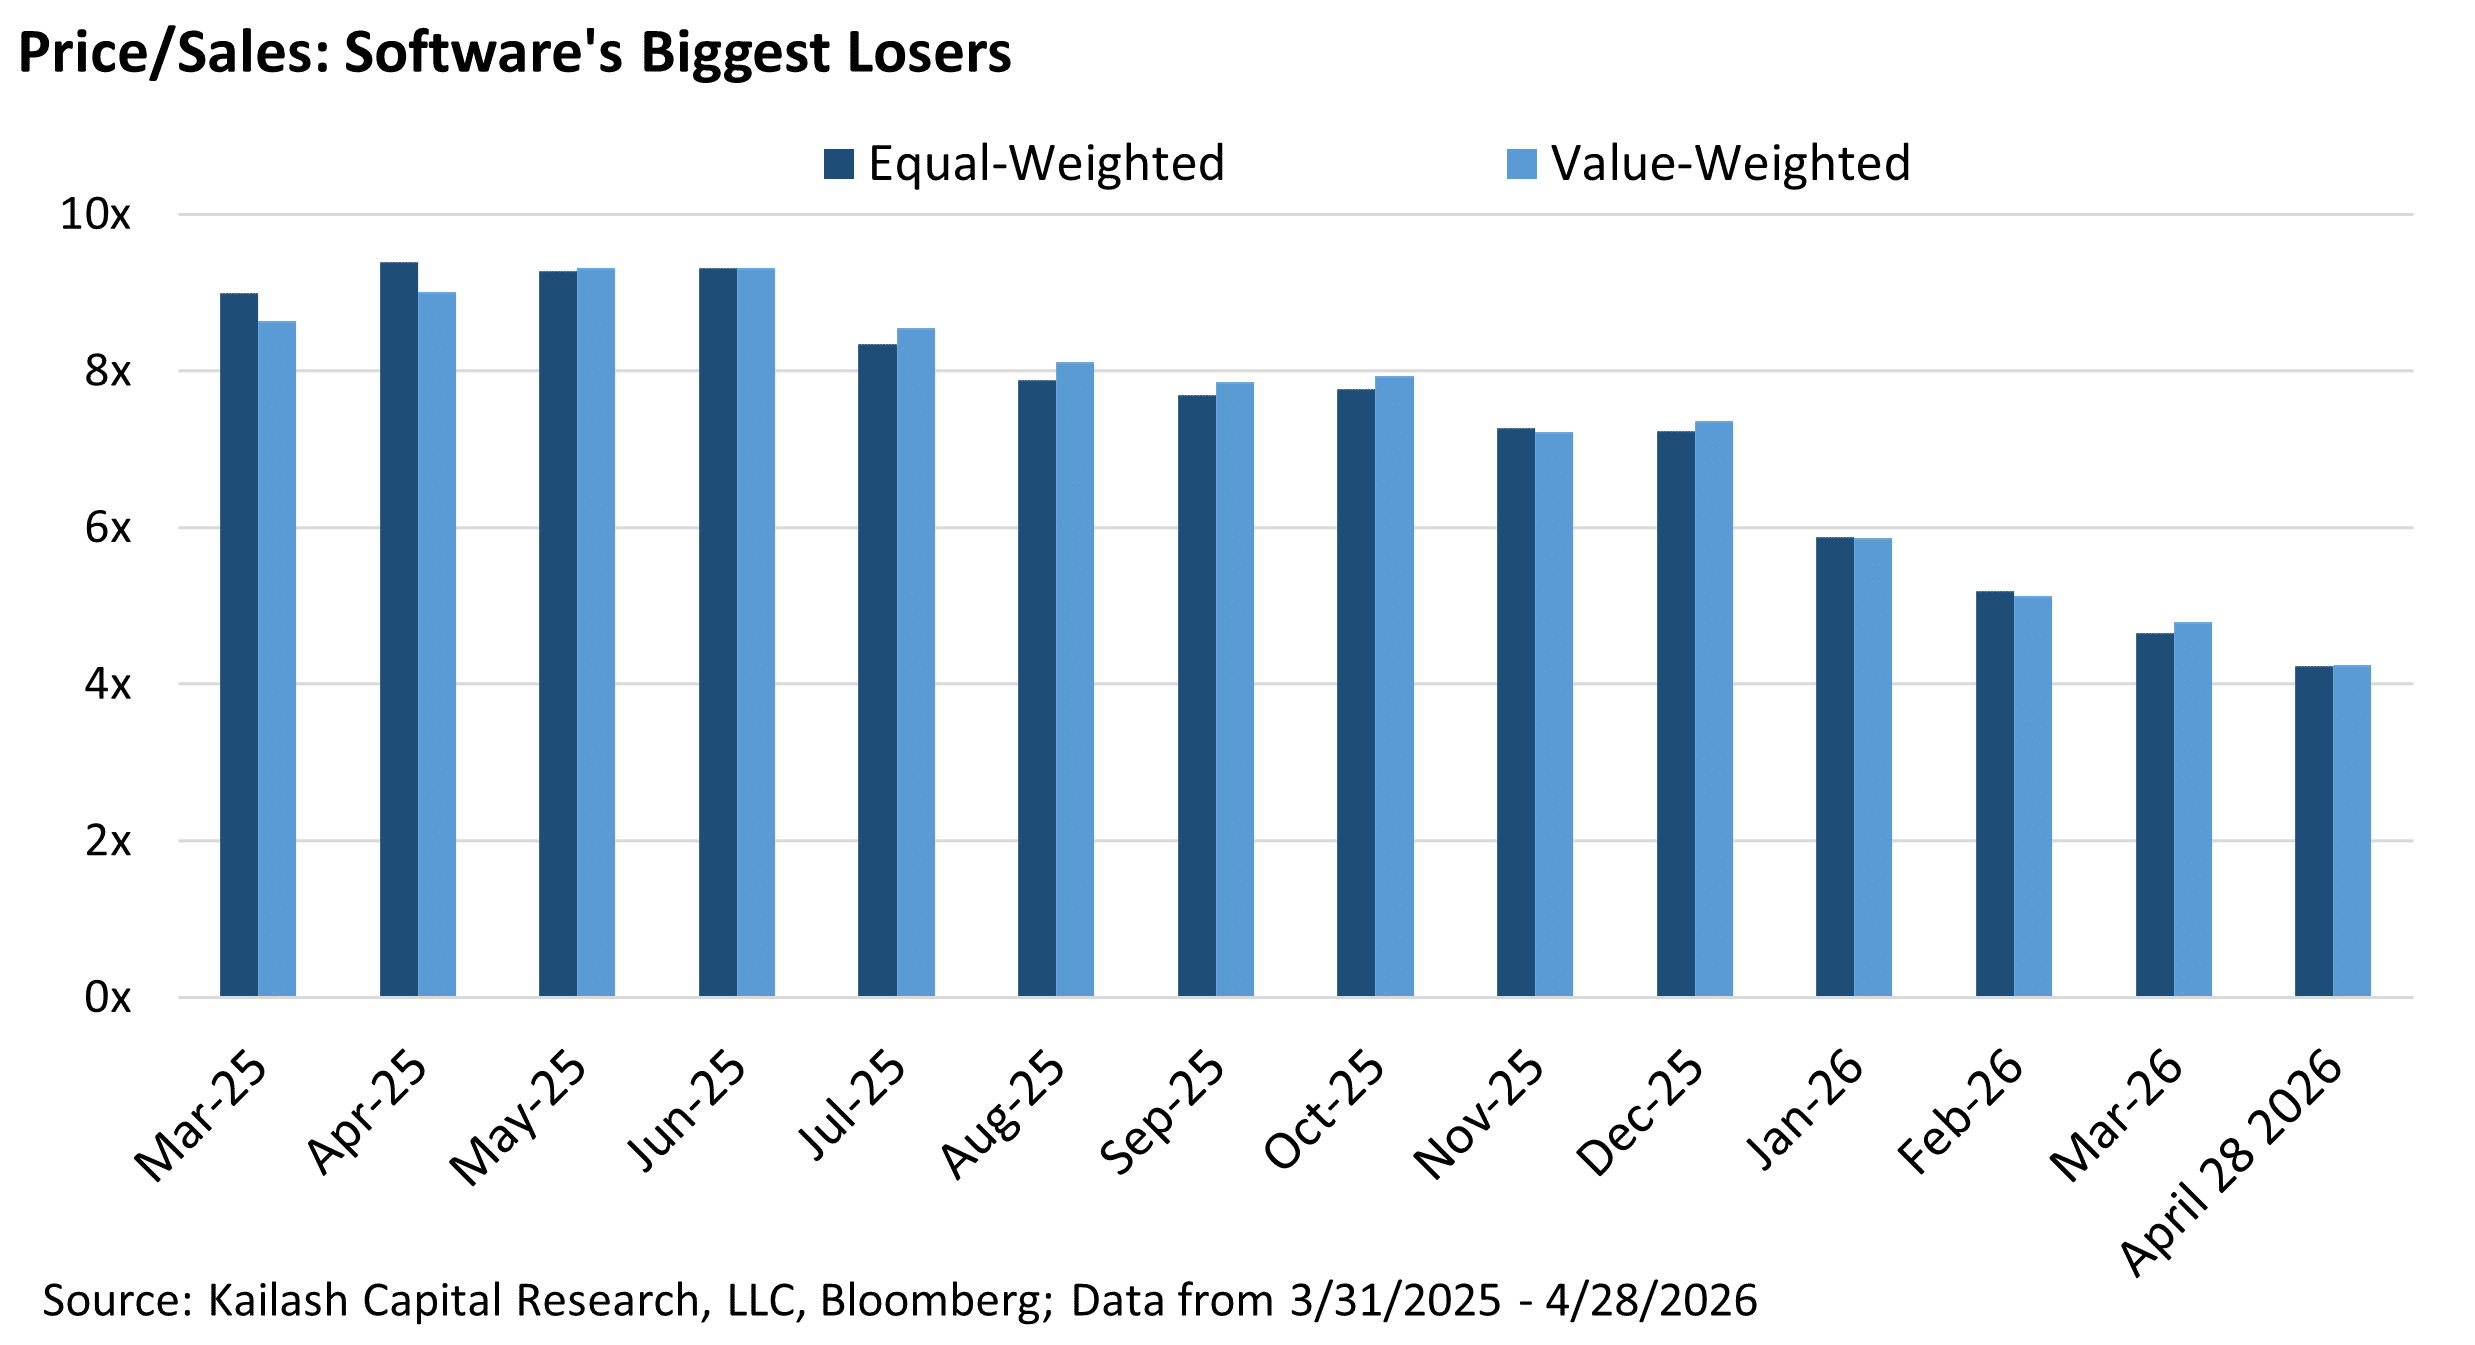
Investors simply shifted their capital from the shiny software stocks to shiny AI stocks. We expect the decision to buy AI darlings for over 10x price to sales will look just as foolish as paying those multiples for software stocks. There simply is no margin of safety at 10x price to sales.
Do you think software stocks are cheap now? Or some proximate question comes at us daily. The KCR team does not make forecasts. We follow the data.
And the data below shows that the software sector is not on our buy list at the moment.
Explanation in Brief:
- Every ranking methodology and model portfolio KCR creates is based on the fundamental data of all the underlying companies in the respective model’s universe
- The data we include works to balance a company’s quality with its valuation and historical track-record of capital allocation (reductive oversimplification – reach out if you would like to know more)
- The result is every stock gets an “aggregate rank” that measures a given company vs. all other companies in a given universe – the higher a stock’s aggregate rank, the better the opportunity
The chart below shows our Large Cap model’s average aggregate ranking of all Large Cap software stocks since 1994. For context, KCR was founded in 2010, and you can see that from 2010 through early 2019, software stocks were consistently at or above the 80th percentile meaning we liked them. But after the easy money mania that began after Covid, our model’s affection for software stocks plummeted to lows just above the 40th percentile.
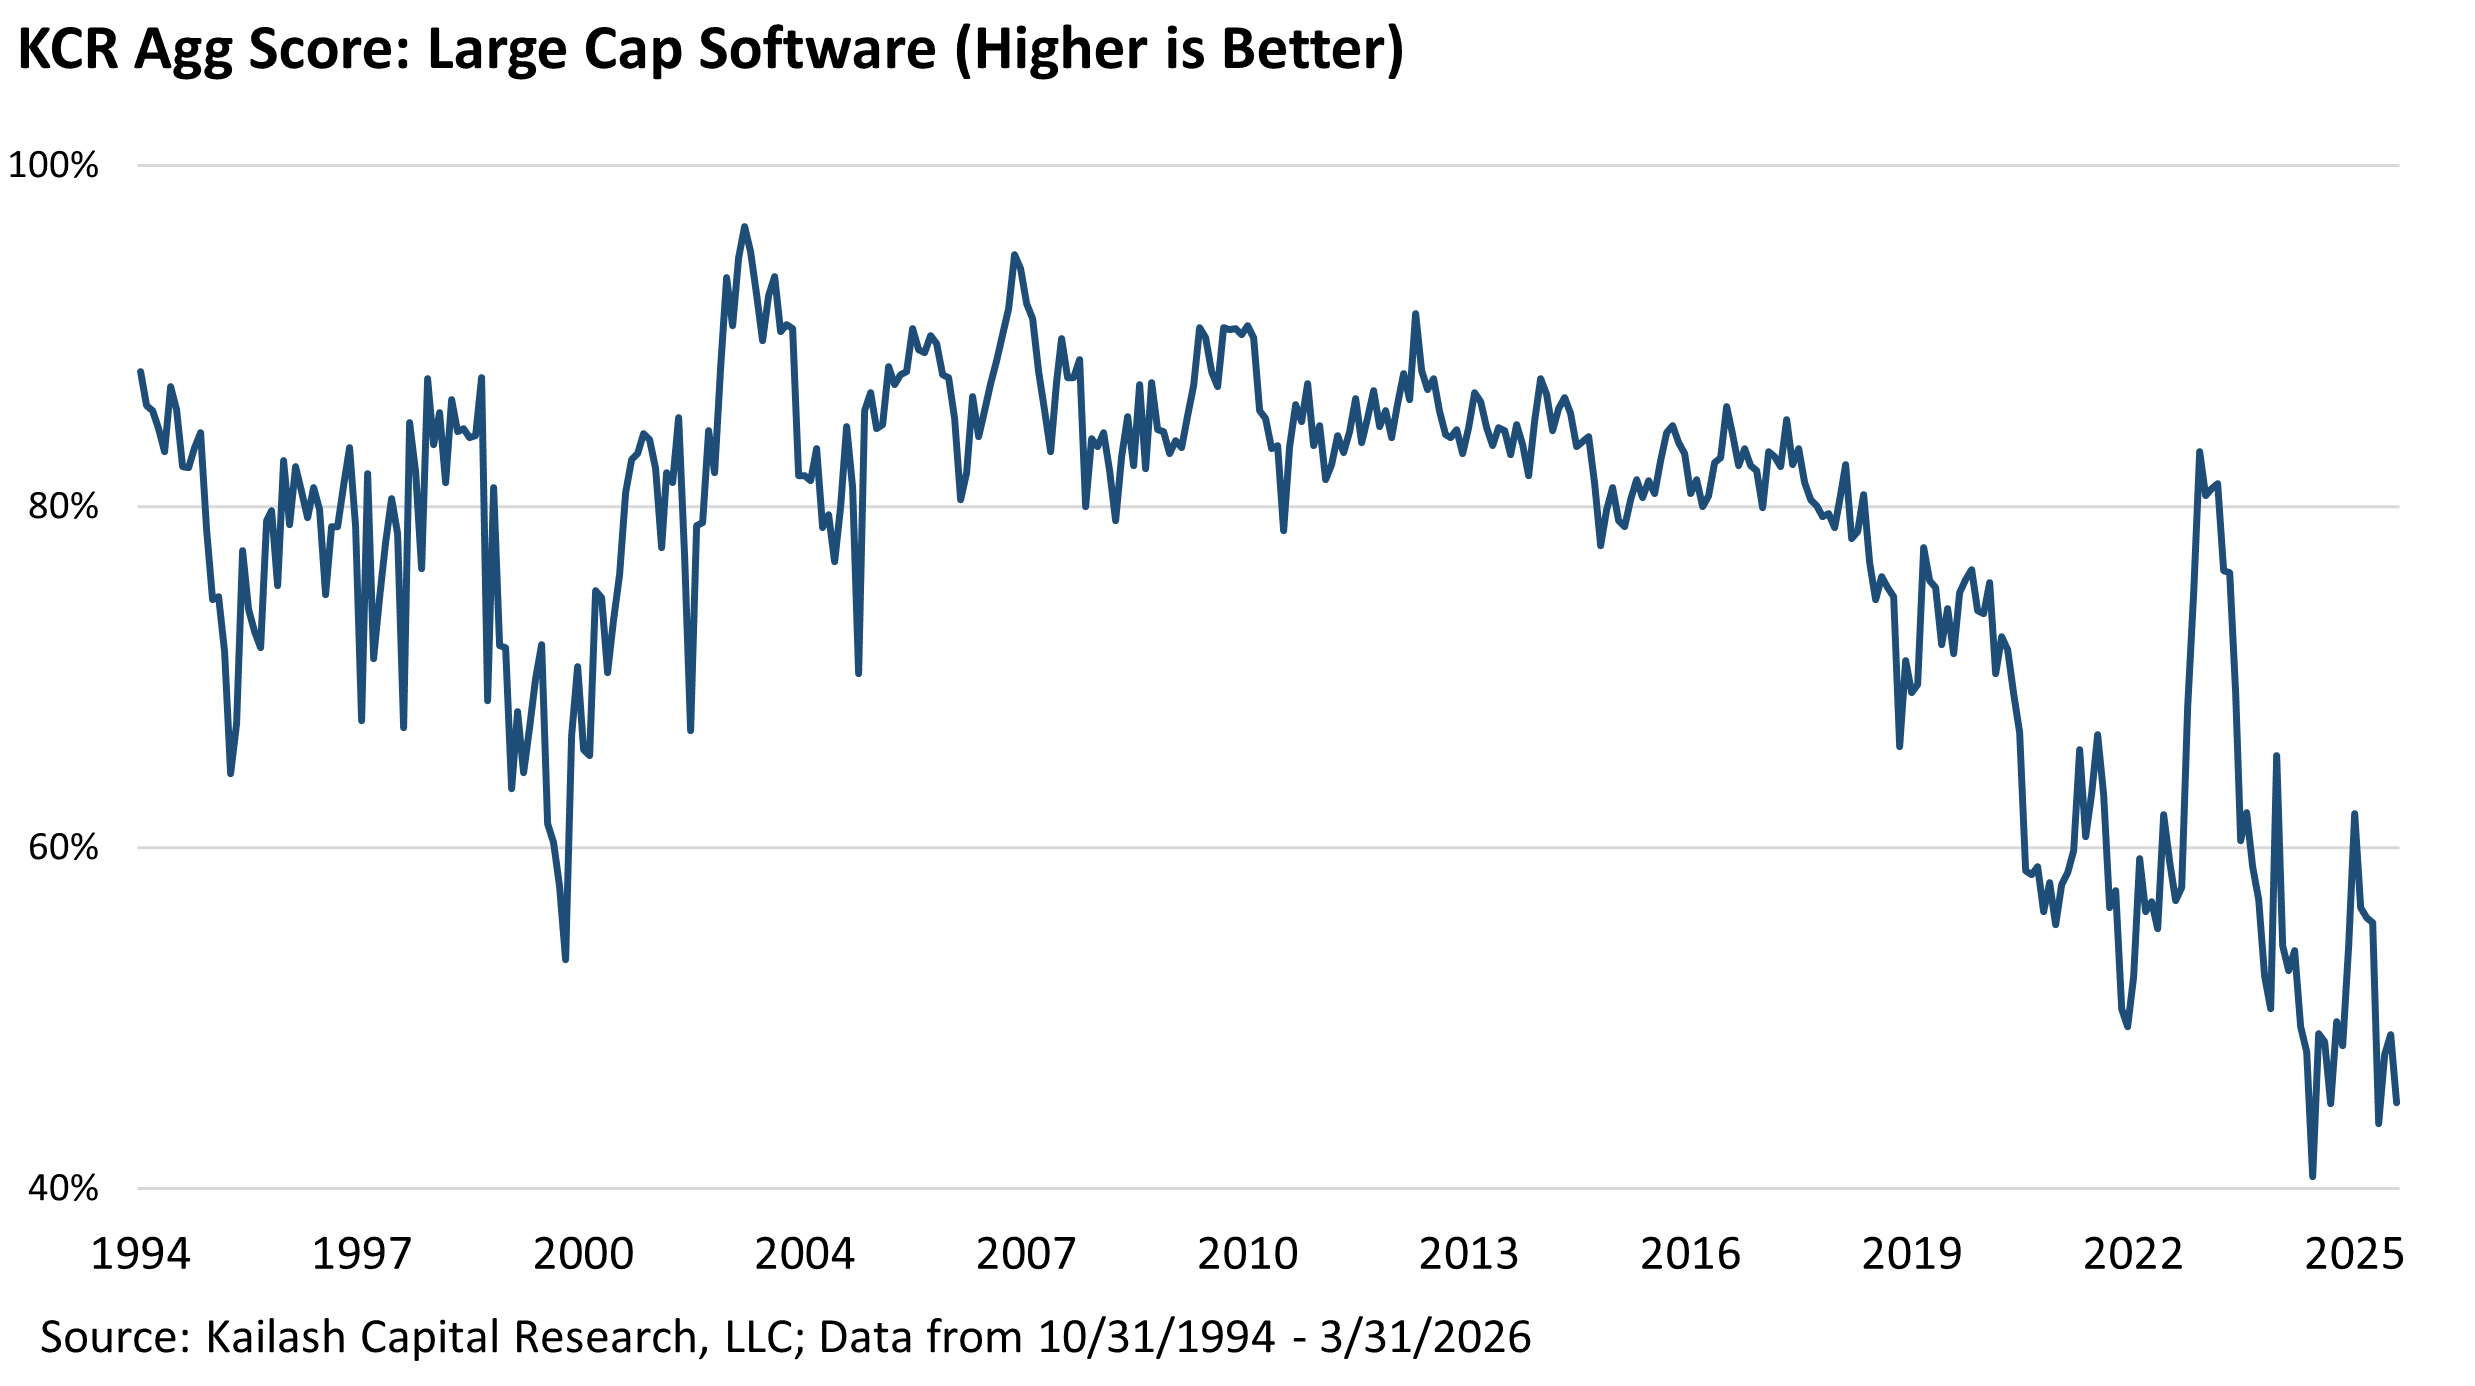
You will notice on the chart above that despite the sharp declines in the stock prices and multiples of the software sector, our model still does not like the sector, in aggregate. So at the sector level our models see far too much risk relative to the potential for reward.
But at the stock level we have found some very interesting individual companies/stocks among the wreckage we highlighted earlier.
Specifically, of the 11 software stocks that were among the 50 worst performers in all of large cap, a full seven of them are in the top quintile (80th percentile or higher) and of those seven, four of them are now in the top decile of our entire US Large Cap aggregate ranks.
Pessimistic emotions have run riot in software. Post a devastating software sell-off that has left the sector a grab bag of mediocrity, within the sector’s hardest hit names, we have found some very high quality, rapidly growing companies that are trading at significant discounts to the broad market.
The table below shows the following basic fundamental data for:
- First Row: the S&P 500 Index
- Second Row: the seven software stocks in the bombed out group that have leapt to the top 20% or top 10% of all stocks in the Large Cap Universe
- Third Row: the biggest AI winners highlighted at the very start of the paper
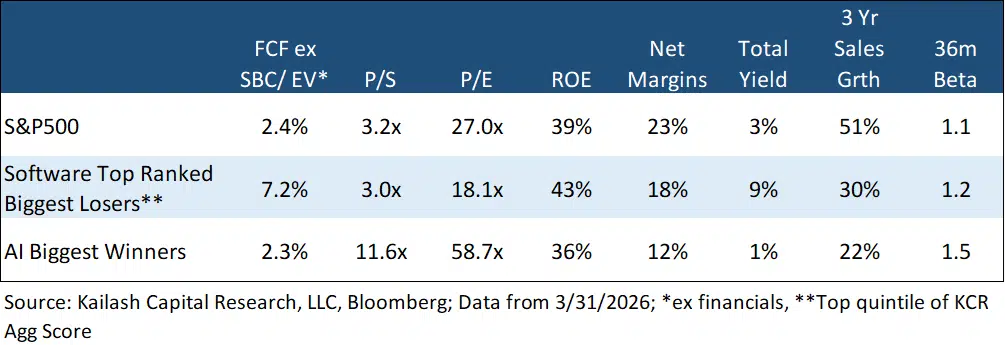
Let’s focus on that second row in comparison to the broader S&P 500 (top row) and the AI Winners that everyone thinks are the next great thing.
That second row is the seven software stocks that are among the highest ranked stocks in our entire Large Cap Universe. Those seven stocks now sport a 7.2% free cash flow yield. That is 300% higher than the S&P 500 and the AI stocks that everyone just ripped through the roof.
Even better, at 43% they have the highest ROEs of any of the three groups. They are paying you a 9% yield to wait and own them; we are tempted to describe them as a sort of junk bond with an equity participation feature.
Even more remarkable, in our view, is these seven highly ranked software stocks are growing sales 30%. Why is that relevant? Well they are growing faster than the AI Winners everyone just piled into. We are not here to say AI is not going to continue to displace, disrupt, and create significant efficiency and productivity improvements.
We just see a 7.2% free cash flow yield, a 3x price to sales multiple, a 9% yield, growing at 30% and think, well there may be a significant margin of safety in these names. Certainly worth further research in our view!
Please find below exhibits showing the AI winners which we believe are largely momentum plays now. Then the seven software stocks that we found in the rubble of the recent selloff. If you would like any specific screens run please just reach out to us so a team-member can assist you.


Disclaimer
The information, data, analyses, and opinions presented herein (a) do not constitute investment advice, (b) are provided solely for informational purposes and therefore are not, individually or collectively, an offer to buy or sell a security, (c) are not warranted to be correct, complete or accurate, and (d) are subject to change without notice. Kailash Capital Research, LLC and its affiliates (collectively, “KCR”) shall not be responsible for any trading decisions, damages, or other losses resulting from, or related to, the information, data, analyses or opinions or their use. The information herein may not be reproduced or retransmitted in any manner without the prior written consent of KCR. In preparing the information, data, analyses, and opinions presented herein, KCR has obtained data, statistics, and information from sources it believes to be reliable. KCR, however, does not perform an audit or seek independent verification of any of the data, statistics, and information it receives. KCR and its affiliates do not provide tax, legal, or accounting advice. This material has been prepared for informational purposes only and is not intended to provide, and should not be relied on for tax, legal, or accounting advice. You should consult your tax, legal, and accounting advisors before engaging in any transaction.
Nothing herein shall limit or restrict the right of affiliates of KCR to perform investment management or advisory services for any other persons or entities. Furthermore, nothing herein shall limit or restrict affiliates of KCR from buying, selling, or trading securities or other investments for their own accounts or for the accounts of their clients. Affiliates of KCR may at any time have, acquire, increase, decrease, or dispose of the securities or other investments referenced in this publication. KCR shall have no obligation to recommend securities or investments in this publication as a result of its affiliates’ investment activities for their own accounts or for the accounts of their clients.
© 2026 Kailash Capital Research, LLC – All rights reserved.
May 1, 2026 |
| Authors: Matthew Malgari, Nathan Przybylo, Dr. Sanjeev Bhojraj and John Durkin
May 1, 2026
Authors: Matthew Malgari, Nathan Przybylo, Dr. Sanjeev Bhojraj and John Durkin