

We would like to thank our friend Farris Shuggi, one of the portfolio managers on T Rowe’s low-beta and high-income ETF, TCAL. With a six-month beta of 0.20, elegant structure of writing calls on the equities they actually own creating a historically tax-efficient yield of nearly 10%, we think the product is interesting to say the least. This paper’s entire structure and inspiration stemmed from the work done by Farris and his team. We have, for internal purposes, done an extensive amount of research on the product – if you are a Financial Advisor and would like to learn more, please connect with us here.
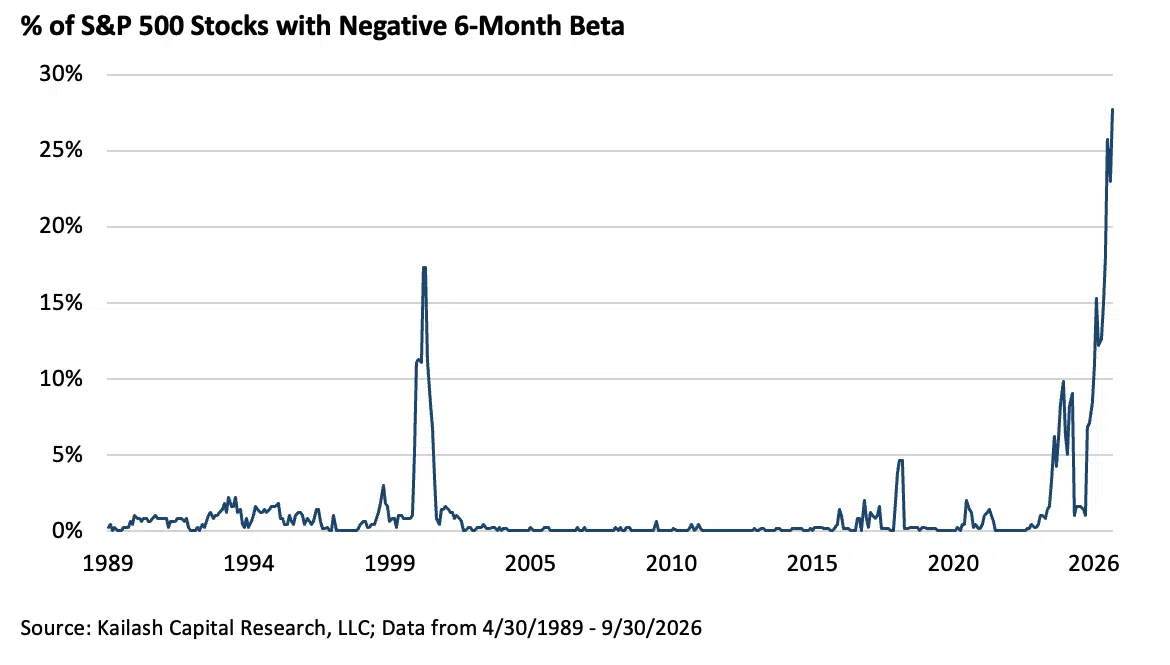
Beta used to be the most boring number in finance. Regress six months of daily returns on the S&P 500 and the typical stock came back close to 1.0, decade after decade. From April 1989 through December 2023, the share of S&P 500 members with a negative six-month beta averaged 0.7%. In 168 of those 417 months it was exactly zero. Today it is 27.7%. As of September 30, 2026, 138 of the index’s 498 members spent the last six months moving against it.
Last month, in The High Price of High Volatility, we showed that investors are paying internet-bubble prices for the market’s most volatile, least profitable stocks. This paper looks at the same problem from inside the S&P 500, using six-month daily betas for every constituent at each month-end from April 1989 through September 2026. What it finds is an index that has split in two. A small group of very large, very high-beta technology companies drives most of the index’s moves, while the typical stock has quietly stopped participating. Investors are paying record multiples for the first group and, in our view, ignoring the second.
Get our insights direct to your inbox: SUBSCRIBE
A Quarter of the Index Now Moves Against It
The chart below shows the percentage of S&P 500 stocks with a negative trailing six-month beta at each month-end since 1989. For 35 years the line barely left the floor. Before 2024 it reached 5% in just nine months, all of them during the dot-com bust. The prior record of 17.3%, set in January and February 2001, has been broken in each of the last four months.
More S&P 500 stocks are moving against the index today than at any point in 37 years, including the collapse of the internet bubble.
The Typical Stock No Longer Tracks the Market
The median six-month beta across the S&P 500 is 0.42, the lowest in our data. Since 1989 the median has been 0.97, and it has spent 86% of all months between 0.8 and 1.2. A year ago it was 0.89. The drop since a year ago is the largest twelve-month decline on record.
- Before 2024 the median had never been below 0.56, set in July 1999. It has been at or below 0.6 in only eleven of 450 months: four in mid-1999, three in late 2000, one in July 2024 and the last three.
- This is not a few outliers at the bottom dragging the number down. The middle of the index has moved.
The S&P 500’s own members have never followed it less closely. The median stock now captures less than half of the index’s moves.

The Two Ends of the Index
The negative betas are not spread evenly. Every stock in the lowest fifth of the index now has a negative beta. The highest fifth has gone the other way and is more sensitive to the market than in 97% of months since 1989.
The chart below, and the rest of this paper, compare those two groups: the highest and lowest quintiles of six-month beta among S&P 500 stocks, which we call High Beta and Low Beta. High Beta’s cap-weighted beta is 2.10, in the top 3% of its history. Low Beta’s is -0.51, the lowest in our data. The 2.6 point gap between them is the widest on record, ahead of the 2.5 reached in January 2001.
- The bottom quintile’s beta has been negative in only 17 months since 1989: six from October 2000 to March 2001, November 2024, and each of the last ten. Before 2024 it had never been below -0.16.
- A top-quintile beta above 2.0 is rare but not new. It happened in 2000–2001, in 2008–2009 and once in 2016, and the record of 2.53 was set in June 2009. What is rare is a High Beta above 2.0 while Low Beta sits below zero. Before this year, that combination had appeared only in late 2000 and early 2001.
- Last cycle, the gap was still only 0.9 in March 2000, at the market peak. It reached 2.5 in January 2001, after the index had already started to fall. This time it went from 1.3 in September 2025 to 2.6 in September 2026, a year in which the S&P 500 returned 16%.
One fifth of the S&P 500 now moves twice as much as the index. Another fifth moves against it. The two have never been further apart.

Consensus Long-Term EPS Growth
Analysts expect High Beta to compound earnings at 34.8% a year over the long term. That is the 99.6th percentile of the group’s history. The all-time high, 39.1%, was set in June 2026. The long-run median is 15.4%. Low Beta carries an expectation of 10.9%. In our view, this is a disaster on the make – impossible earnings expectations do not mix well for retail investors who do not realize how unbelievably sensitive their positions are to disappointments. The issue is exacerbated by the high beta group’s record valuation which we show on the following page.
- During the internet bubble, consensus long-term growth for High Beta peaked at 25.8%, in January 2001. Before October 2025, forecasts above 25% had appeared in only six months. They have now appeared in eleven of the last twelve.
- The expectation has more than doubled from 14.9% at the end of 2022 and is up from 21.4% at the end of 2024. It is being extrapolated from the fastest three-year sales growth since the internet bubble.
Analysts expect more from High Beta today than they did at any point in the internet bubble but…

Price/Sales: Record Multiples + Record Expectations (prior page) + Record Volatility = Trouble
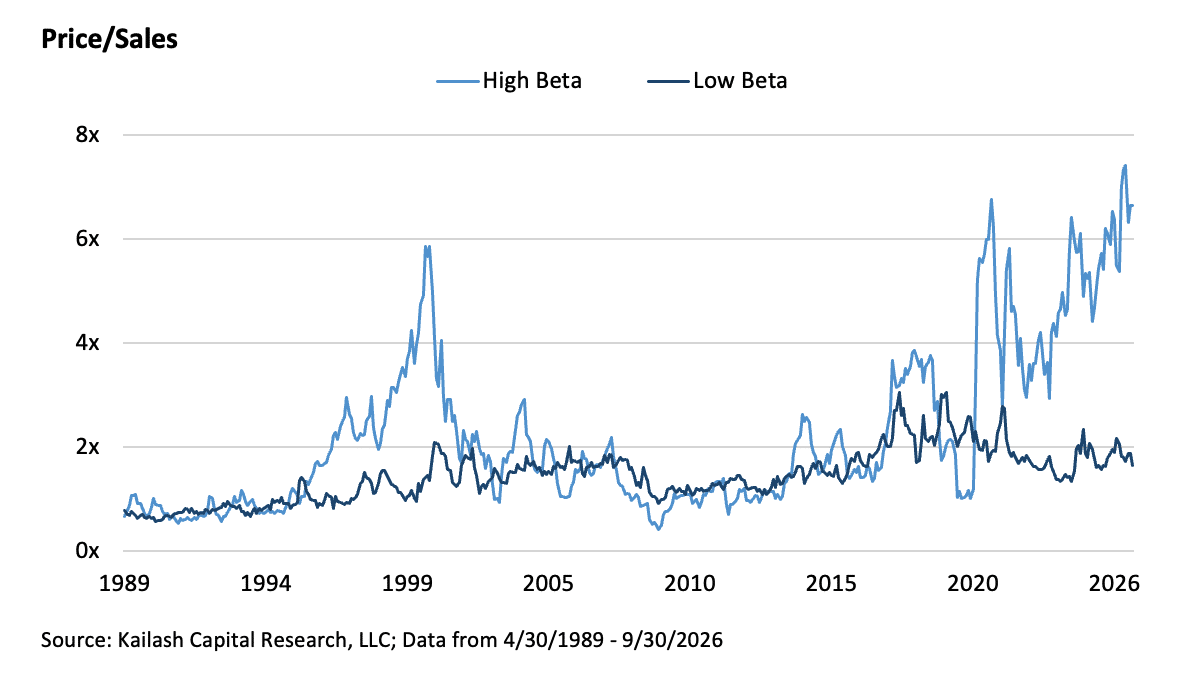
High Beta trades at 6.7x sales. Low Beta trades at 1.7x. High Beta’s multiple is in the 99th percentile of its own history, and its all-time high of 7.4x was set just three months ago, in June 2026. The 5.0x premium over Low Beta has been wider in only four months: June 2024 and April through June of this year.
- At the peak of the internet bubble in March 2000, High Beta traded at 4.2x sales.
- From 2010 through 2022, High Beta traded at or below Low Beta’s Price/Sales in 48% of months; a brutal reminder that the high beta stocks that trade at a record premium to low beta stocks, actually have a long history of trading at a discount.
- Low Beta’s 1.7x is only modestly above its own 1.4x median. The premium has opened almost entirely from the High Beta side.
In 37 years the market has never paid more per dollar of sales for High Beta firms. At the March 2000 market peak, High Beta traded at a 37% discount to today’s multiple.
After the Last Peak
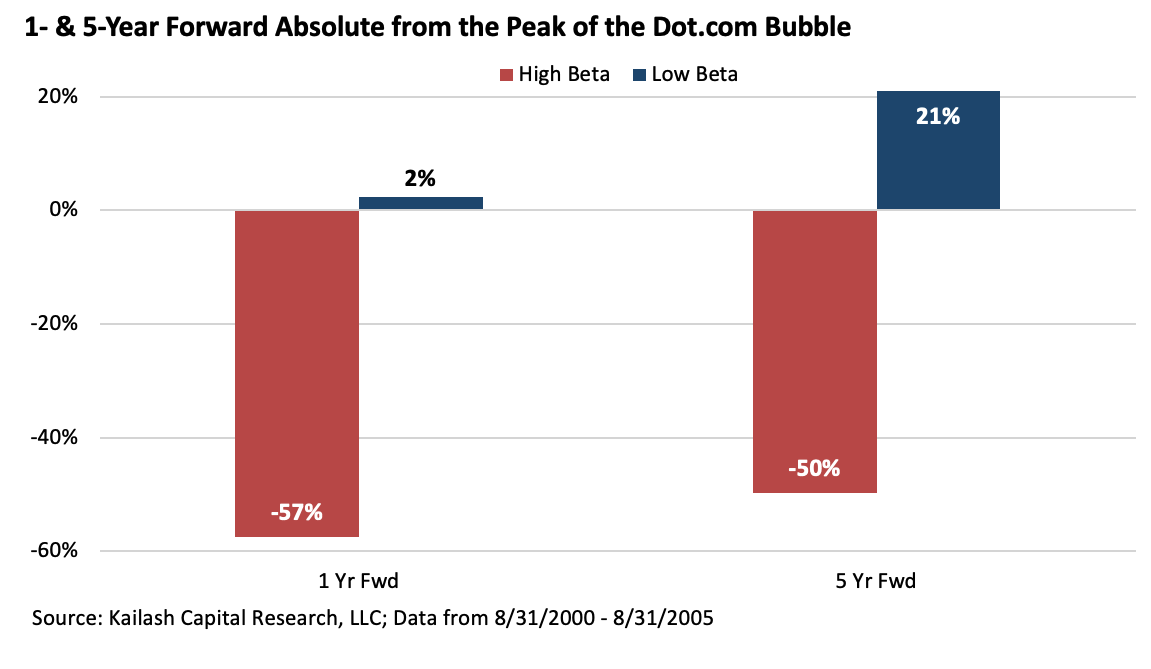
The aftermath of the dot-com peak shows how long the damage to High Beta stocks endured. High Beta lost 57% over the following year and remained down 50% after five years, while Low Beta gained 2% and 21% over those same horizons. Even a five-year holding period left High Beta with roughly half its starting value, while Low Beta’s advantage had grown.
- The initial losses were severe: Using the chart’s rounded returns, a hypothetical $100 in High Beta fell to approximately $43 after one year, compared with $102 in Low Beta.
- Time provided limited relief: After five years, that starting $100 translated to approximately $50 in High Beta versus $121 in Low Beta.
- The divide widened: Based on the displayed figures, Low Beta’s lead increased from 59 percentage points after one year to 71 percentage points after five years.
Fundamentals
High Beta’s strong growth comes with a steep price and a thin cash return. Investors are paying 30.0x earnings and 6.7x sales for a portfolio that generates just a 1.6% free cash flow yield and a 0.9% total shareholder yield. A 41% return on equity may help sell the story. It does little to protect investors from paying too much.
- Low Beta generates a 5.0% free cash flow yield, more than three times High Beta’s 1.6%. Its total shareholder yield is 4.4%, versus just 0.9% for High Beta. Investors chasing High Beta accept far less cash return while taking far more risk.
- At 6.7x sales, High Beta costs nearly four times as much as Low Beta which trades at 1.7x sales. Those premiums raise the bar for High Beta: strong businesses can still deliver poor investment returns when the purchase price demands too much.
- High Beta’s sales rose 117% and earnings climbed 494% over three years. Those gains are already in the price. The risk is paying a premium today because an exceptional past makes an exceptional future feel assured. Low Beta grew sales 16% and earnings 53% over the same period, yet carries a much lower multiple. Getting paid a 4.4% cash covered yield to own businesses with double digit earnings growth strikes us as a compelling opportunity.

Conclusion
A record 28% of the S&P 500 now moves against the S&P 500. The median member captures less than half of the index’s moves, and betas across the index have never been further apart. None of this shows up in the index’s own risk statistics, because High Beta, anchored by very large technology stocks with betas of two, three and four, is doing the moving for everyone else. That group is 43% of the index, trades at the 99th percentile of its own Price/Sales history, and carries growth expectations above the peak of the internet bubble.
The other side of the index is cheaper than it has been in 83% of months since 1989, pays its owners nearly five times as much cash, and has had a negative beta for ten straight months. In our view the first group is where the risk is, and the second is where the opportunity is. The index will not make that distinction for you.
Please find below our most recent Top Ranked Low Beta and Bottom Ranked High Beta stocks.


Disclaimer
The information, data, analyses, and opinions presented herein (a) do not constitute investment advice, (b) are provided solely for informational purposes and therefore are not, individually or collectively, an offer to buy or sell a security, (c) are not warranted to be correct, complete or accurate, and (d) are subject to change without notice. Kailash Capital Research, LLC and its affiliates (collectively, “KCR”) shall not be responsible for any trading decisions, damages, or other losses resulting from, or related to, the information, data, analyses or opinions or their use. The information herein may not be reproduced or retransmitted in any manner without the prior written consent of KCR. In preparing the information, data, analyses, and opinions presented herein, KCR has obtained data, statistics, and information from sources it believes to be reliable. KCR, however, does not perform an audit or seek independent verification of any of the data, statistics, and information it receives. KCR and its affiliates do not provide tax, legal, or accounting advice. This material has been prepared for informational purposes only and is not intended to provide, and should not be relied on for tax, legal, or accounting advice. You should consult your tax, legal, and accounting advisors before engaging in any transaction.
Nothing herein shall limit or restrict the right of affiliates of KCR to perform investment management or advisory services for any other persons or entities. Furthermore, nothing herein shall limit or restrict affiliates of KCR from buying, selling, or trading securities or other investments for their own accounts or for the accounts of their clients. Affiliates of KCR may at any time have, acquire, increase, decrease, or dispose of the securities or other investments referenced in this publication. KCR shall have no obligation to recommend securities or investments in this publication as a result of its affiliates’ investment activities for their own accounts or for the accounts of their clients.
© 2026 Kailash Capital Research, LLC – All rights reserved.
November 6, 2026 |
| Authors: Matthew Malgari, Nathan Przybylo, Dr. Sanjeev Bhojraj and John Durkin
November 6, 2026
Authors: Matthew Malgari, Nathan Przybylo, Dr. Sanjeev Bhojraj and John Durkin
