

In December 2024 we published Part I and led with a single chart: investors’ allocation to midcap stocks had collapsed to a level last seen at the peak of the dot.com bubble. In February 2025 we followed with Part II, which argued that the prices attached to America’s largest companies had turned the case for midcaps into one of the fattest pitches we had seen. This piece updates both. Every chart has been re-run through August 31, 2026.
Part I’s argument was structural. Midcaps — the 800 smallest stocks in the Russell 1000 — had shrunk to 22% of that index, the lowest weight in six decades of data and a level seen only once before, at the peak of the dot.com bubble. Anyone holding a large cap index fund, or an active manager who quietly hugs one, owned far less midcap exposure than they assumed. The last investors to find themselves in that position, in 1999, spent five years earning nothing while unloved midcaps compounded. The record backed the point up showing that midcap’s historical record of beating Large Caps in 71% of years did not end in the run-up to the dot.com bubble – it was just on pause as the bubble peaked.
Get our insights direct to your inbox: SUBSCRIBE
Once the crash ensued, Midcaps became powerful compounders year-after-year as Large Cap investors bled red. How? Well in 1999 the Russell 1000’s 25% technology weight crowded other sectors out while Midcap exposure was more evenly distributed and representative of the US economy. Better, Midcaps were trading at a discount in every sector but Energy. Better balance, at a discount. The setup today is even better.
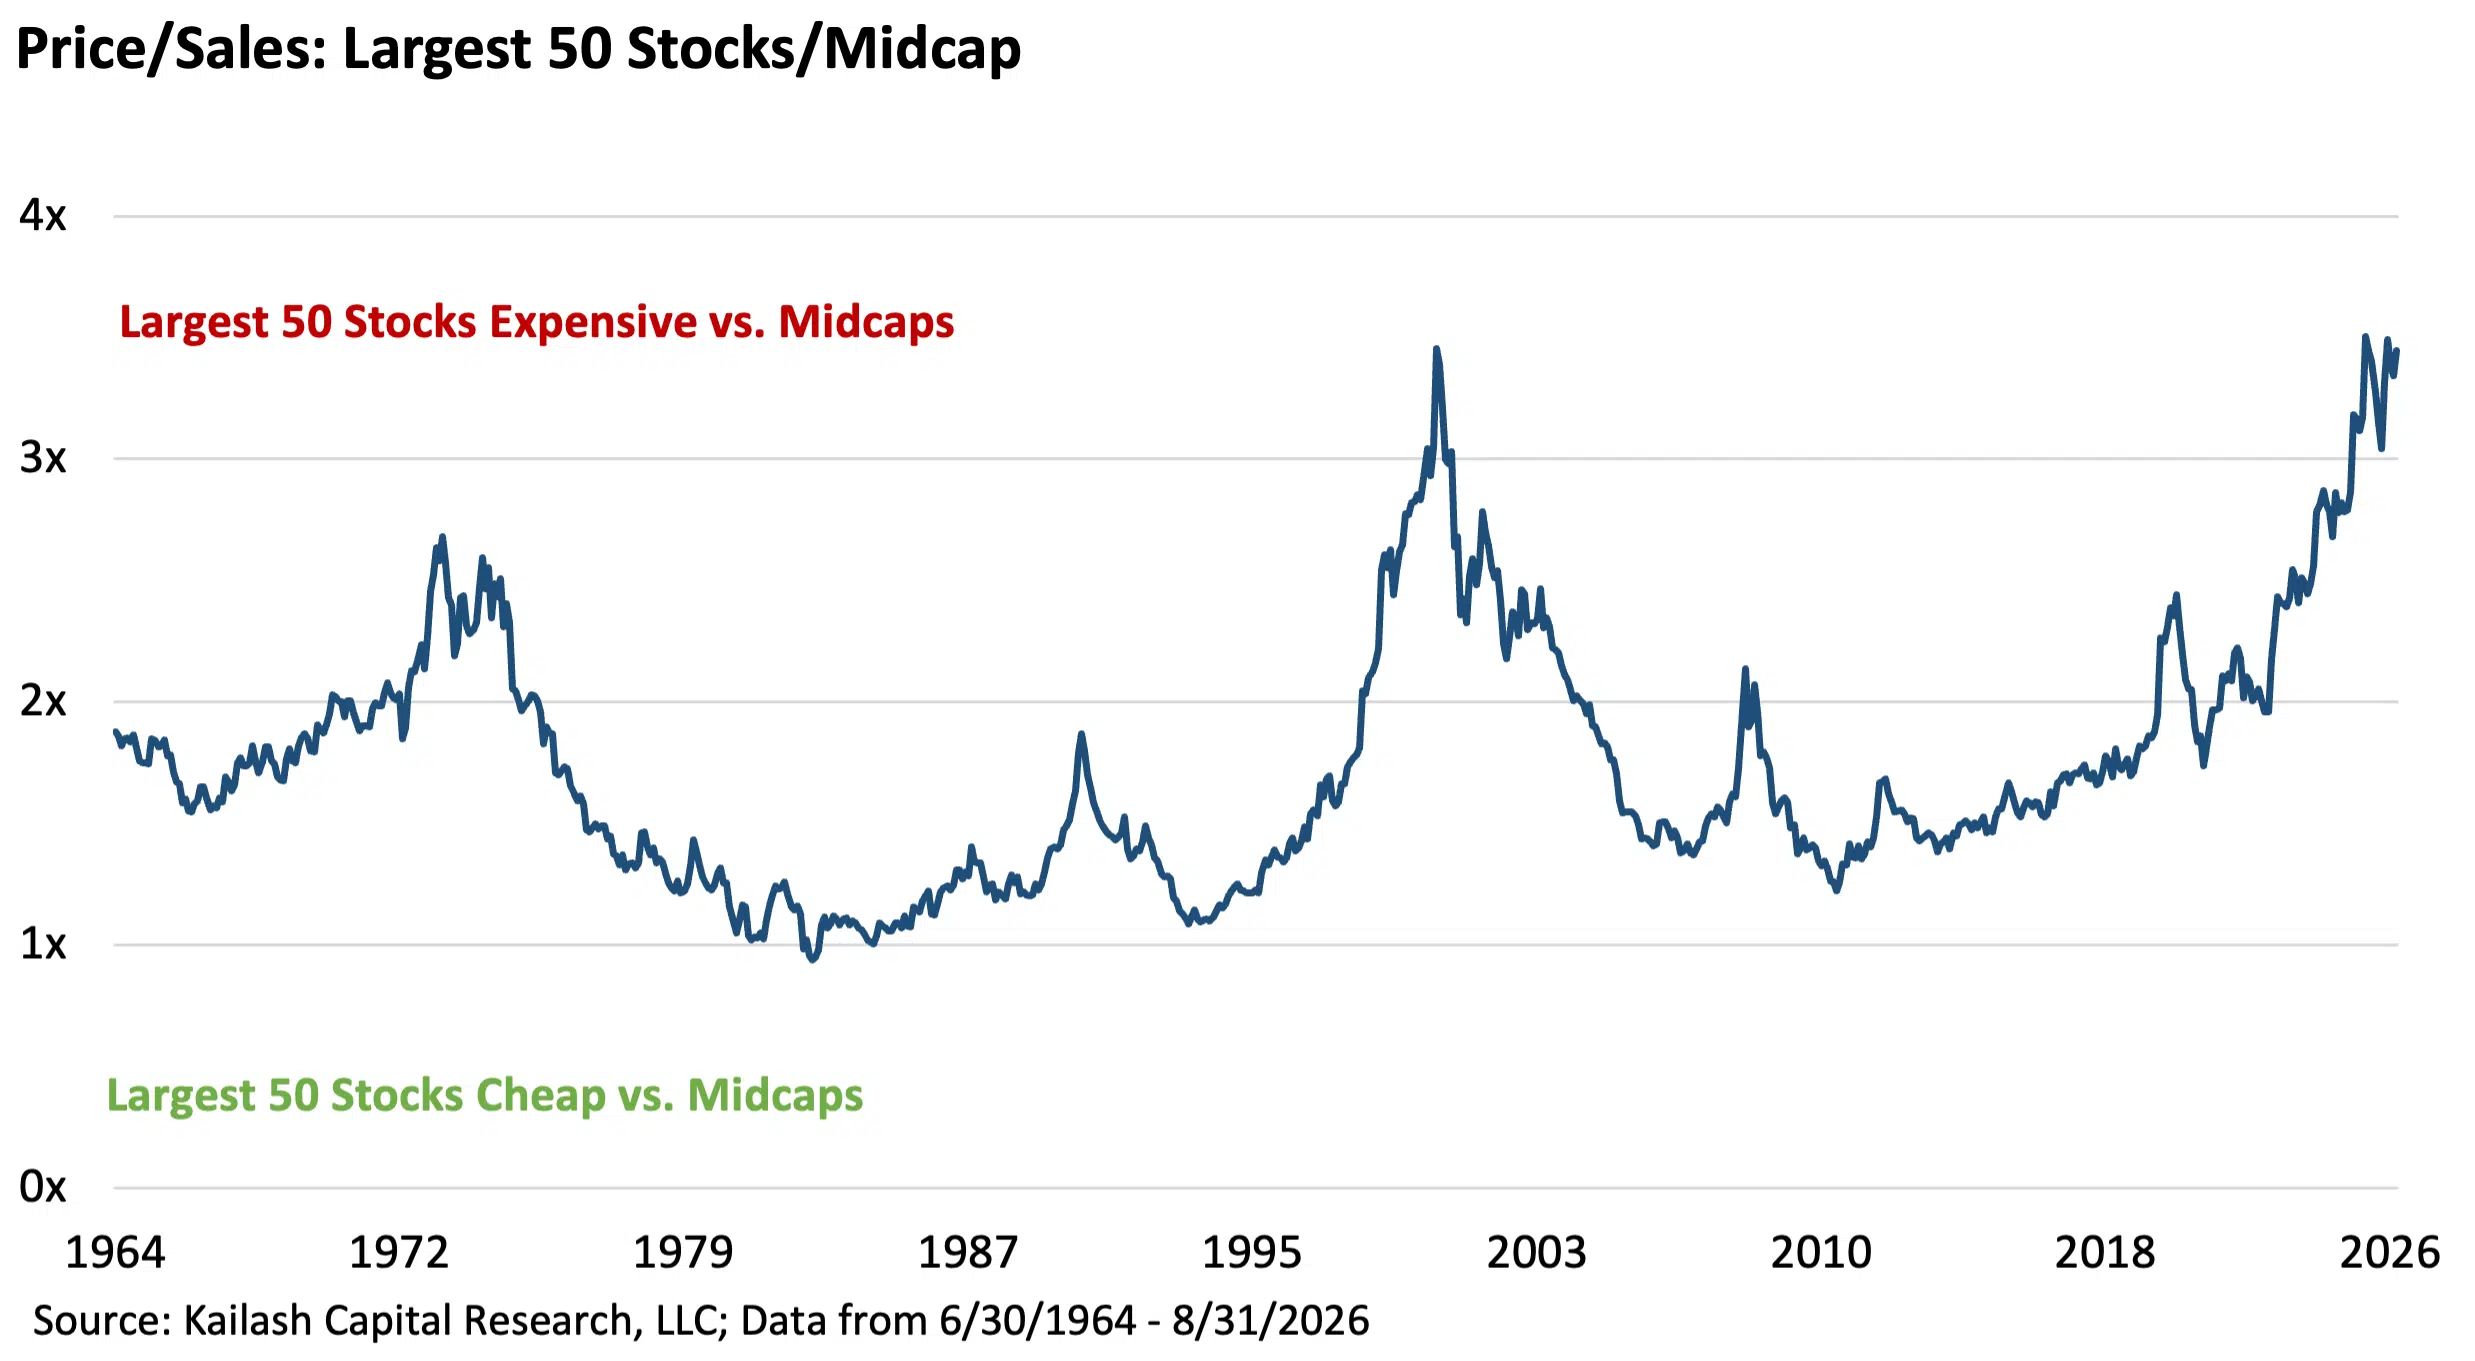
Part II asked the obvious follow-up: if not now, when? Our 2025 piece showed the Russell 1000’s price-to-sales ratio had passed its dot.com high while midcaps sat near the multiple they carried in 1999 prior to their decade of outperformance. We also showed how the largest 50 stocks traded at roughly three times the midcap multiple of sales. As we explained in that paper, the growth needed to justify the premium valuations ascribed to large caps was extrapolation bias on steroids. The situation is just as dire today, in our view.
Our conclusion: fund a midcap allocation from the overpriced mega caps everyone owns too much of.
Simple to say but not easy to do. So what has happened?
We will start with the uncomfortable part rather than bury it. The trade has not paid off. Yet. From 12/31/2024 through 8/31/2026 the Russell 1000 returned 32.3% against 28.7% for midcaps. The case we are making is a relative one. The data is clear: based on history midcaps should beat large cap stocks over the next decade.
The pages that follow show why we are more confident, not less, in this thesis. Here’s why:
- Ownership, concentration and valuation — the three numbers that carried the case in our original publications are now more compelling than our original pieces demonstrated.
- In many cases, Midcaps are now at levels that suggest future returns relative to Large Cap may be better than the post dot.com experience.
- We take each in turn and let the data do the talking – we hope some readers will listen!
Ownership: The Hole in Investors’ Portfolios Got Deeper
The chart below updates the exhibit we led with in Part I. Midcaps’ weight in the Russell 1000 has fallen to 19.4%, having set an all-time low of 20.0% in October 2025. Part I called 22.3% a record; the figure has dropped another three points since.
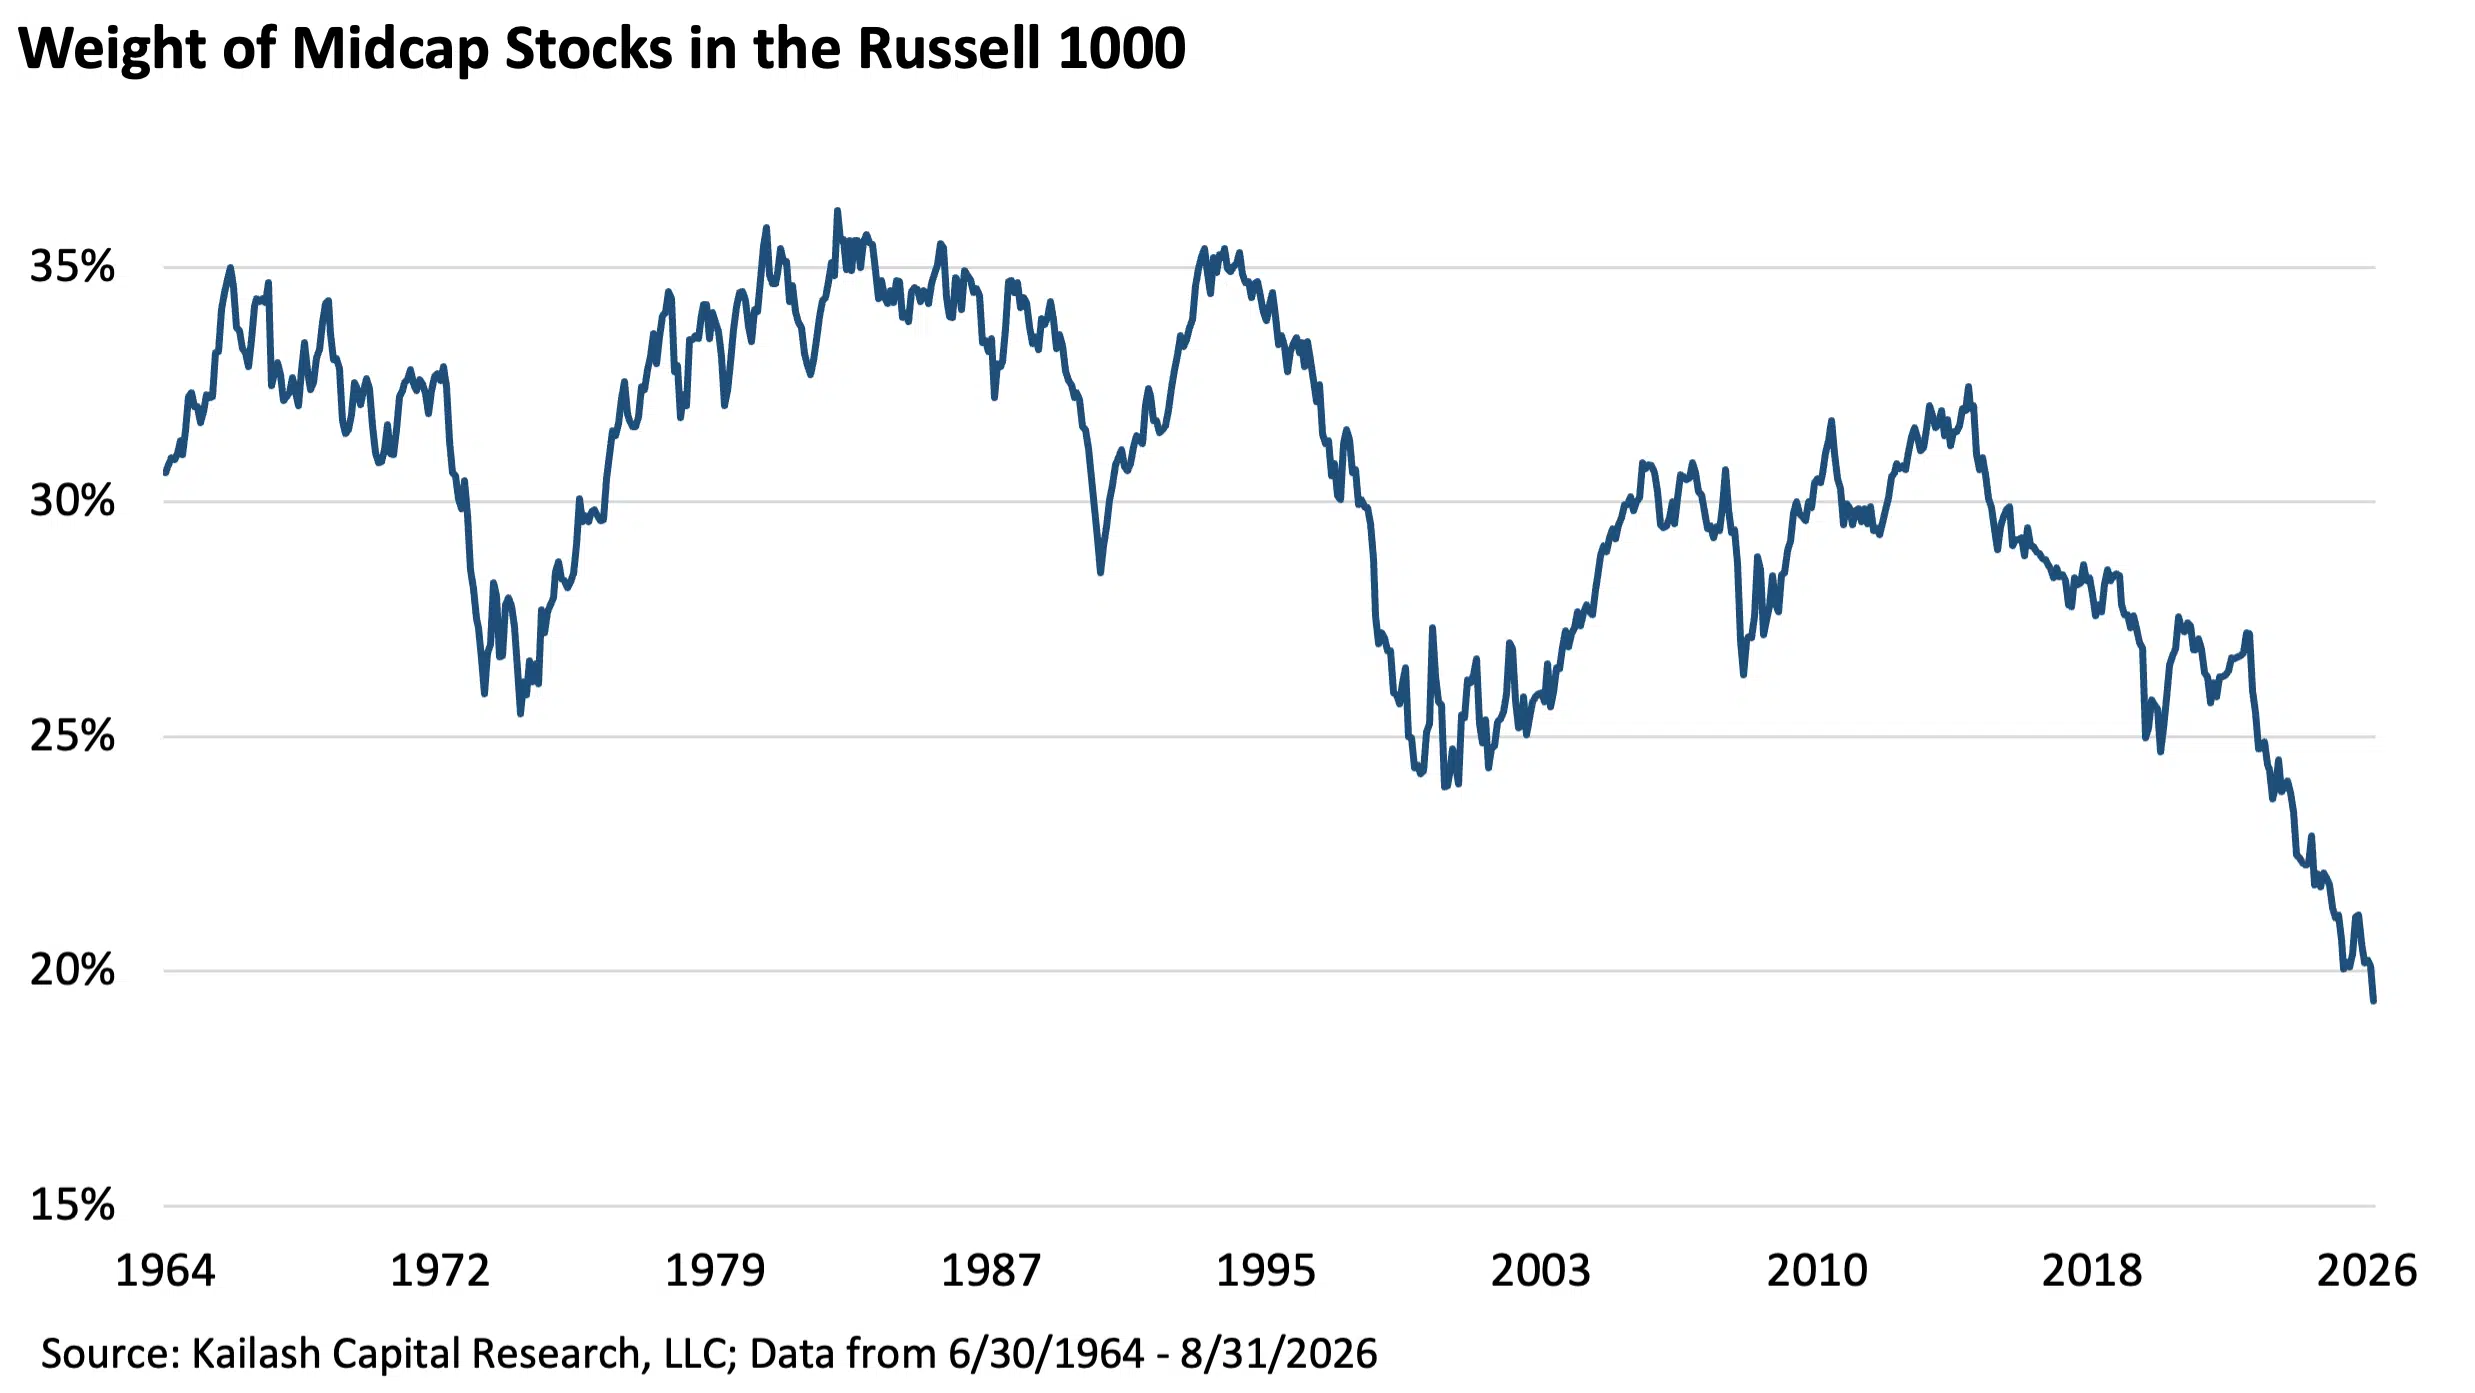
For context, the average weight since 1964 is 30.2% and the dot.com trough never breached 24%. Every one of the eight months in six decades below 21% has occurred since December 2024. Investors holding a Large Cap Index Fund, or an active manager benchmarked to one, now own the least midcap exposure on record.
The Long Record Still Favors Midcaps – With Recent Concessions
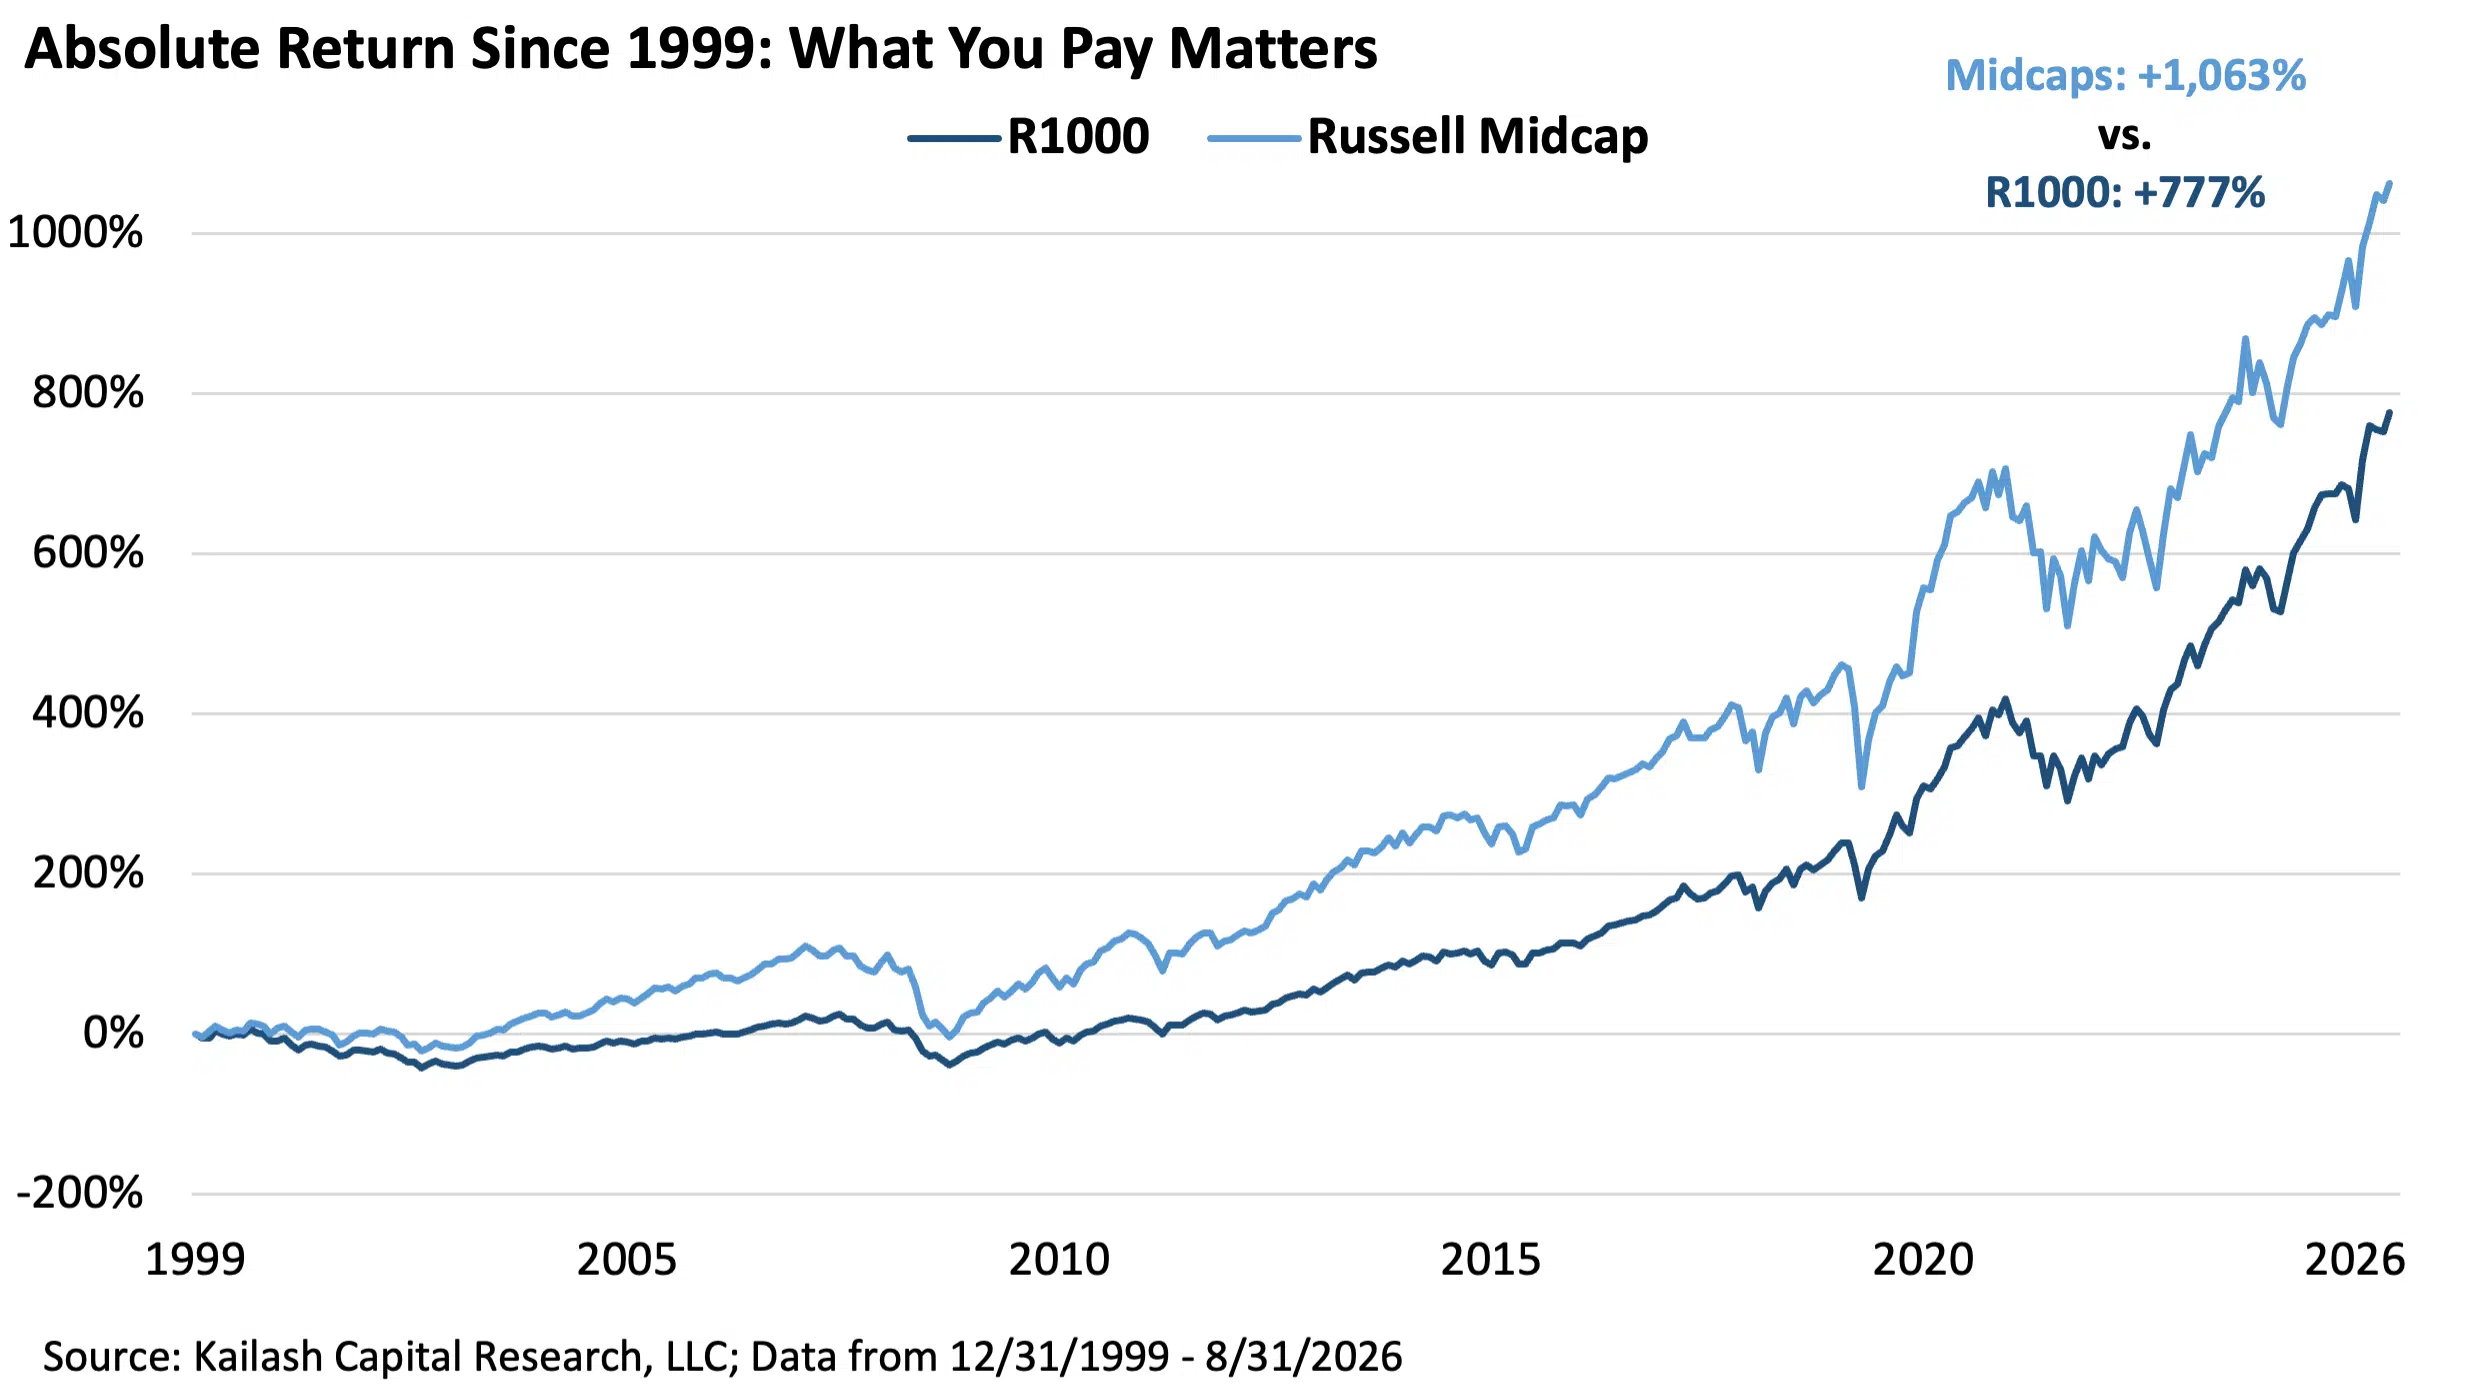
Since 12/31/1999, midcaps have compounded to +1,063% against +777% for the Russell 1000. The data provides a ruthless reminder that what you pay matters. Large cap stocks have had their biggest run in history vs. Midcaps over the last decade and they are still lagging behind their Midcap peers since 1999. And today the value spreads are right back at the dot.com peak levels. If your investment horizon is 10 years, this is not complicated, in our view.
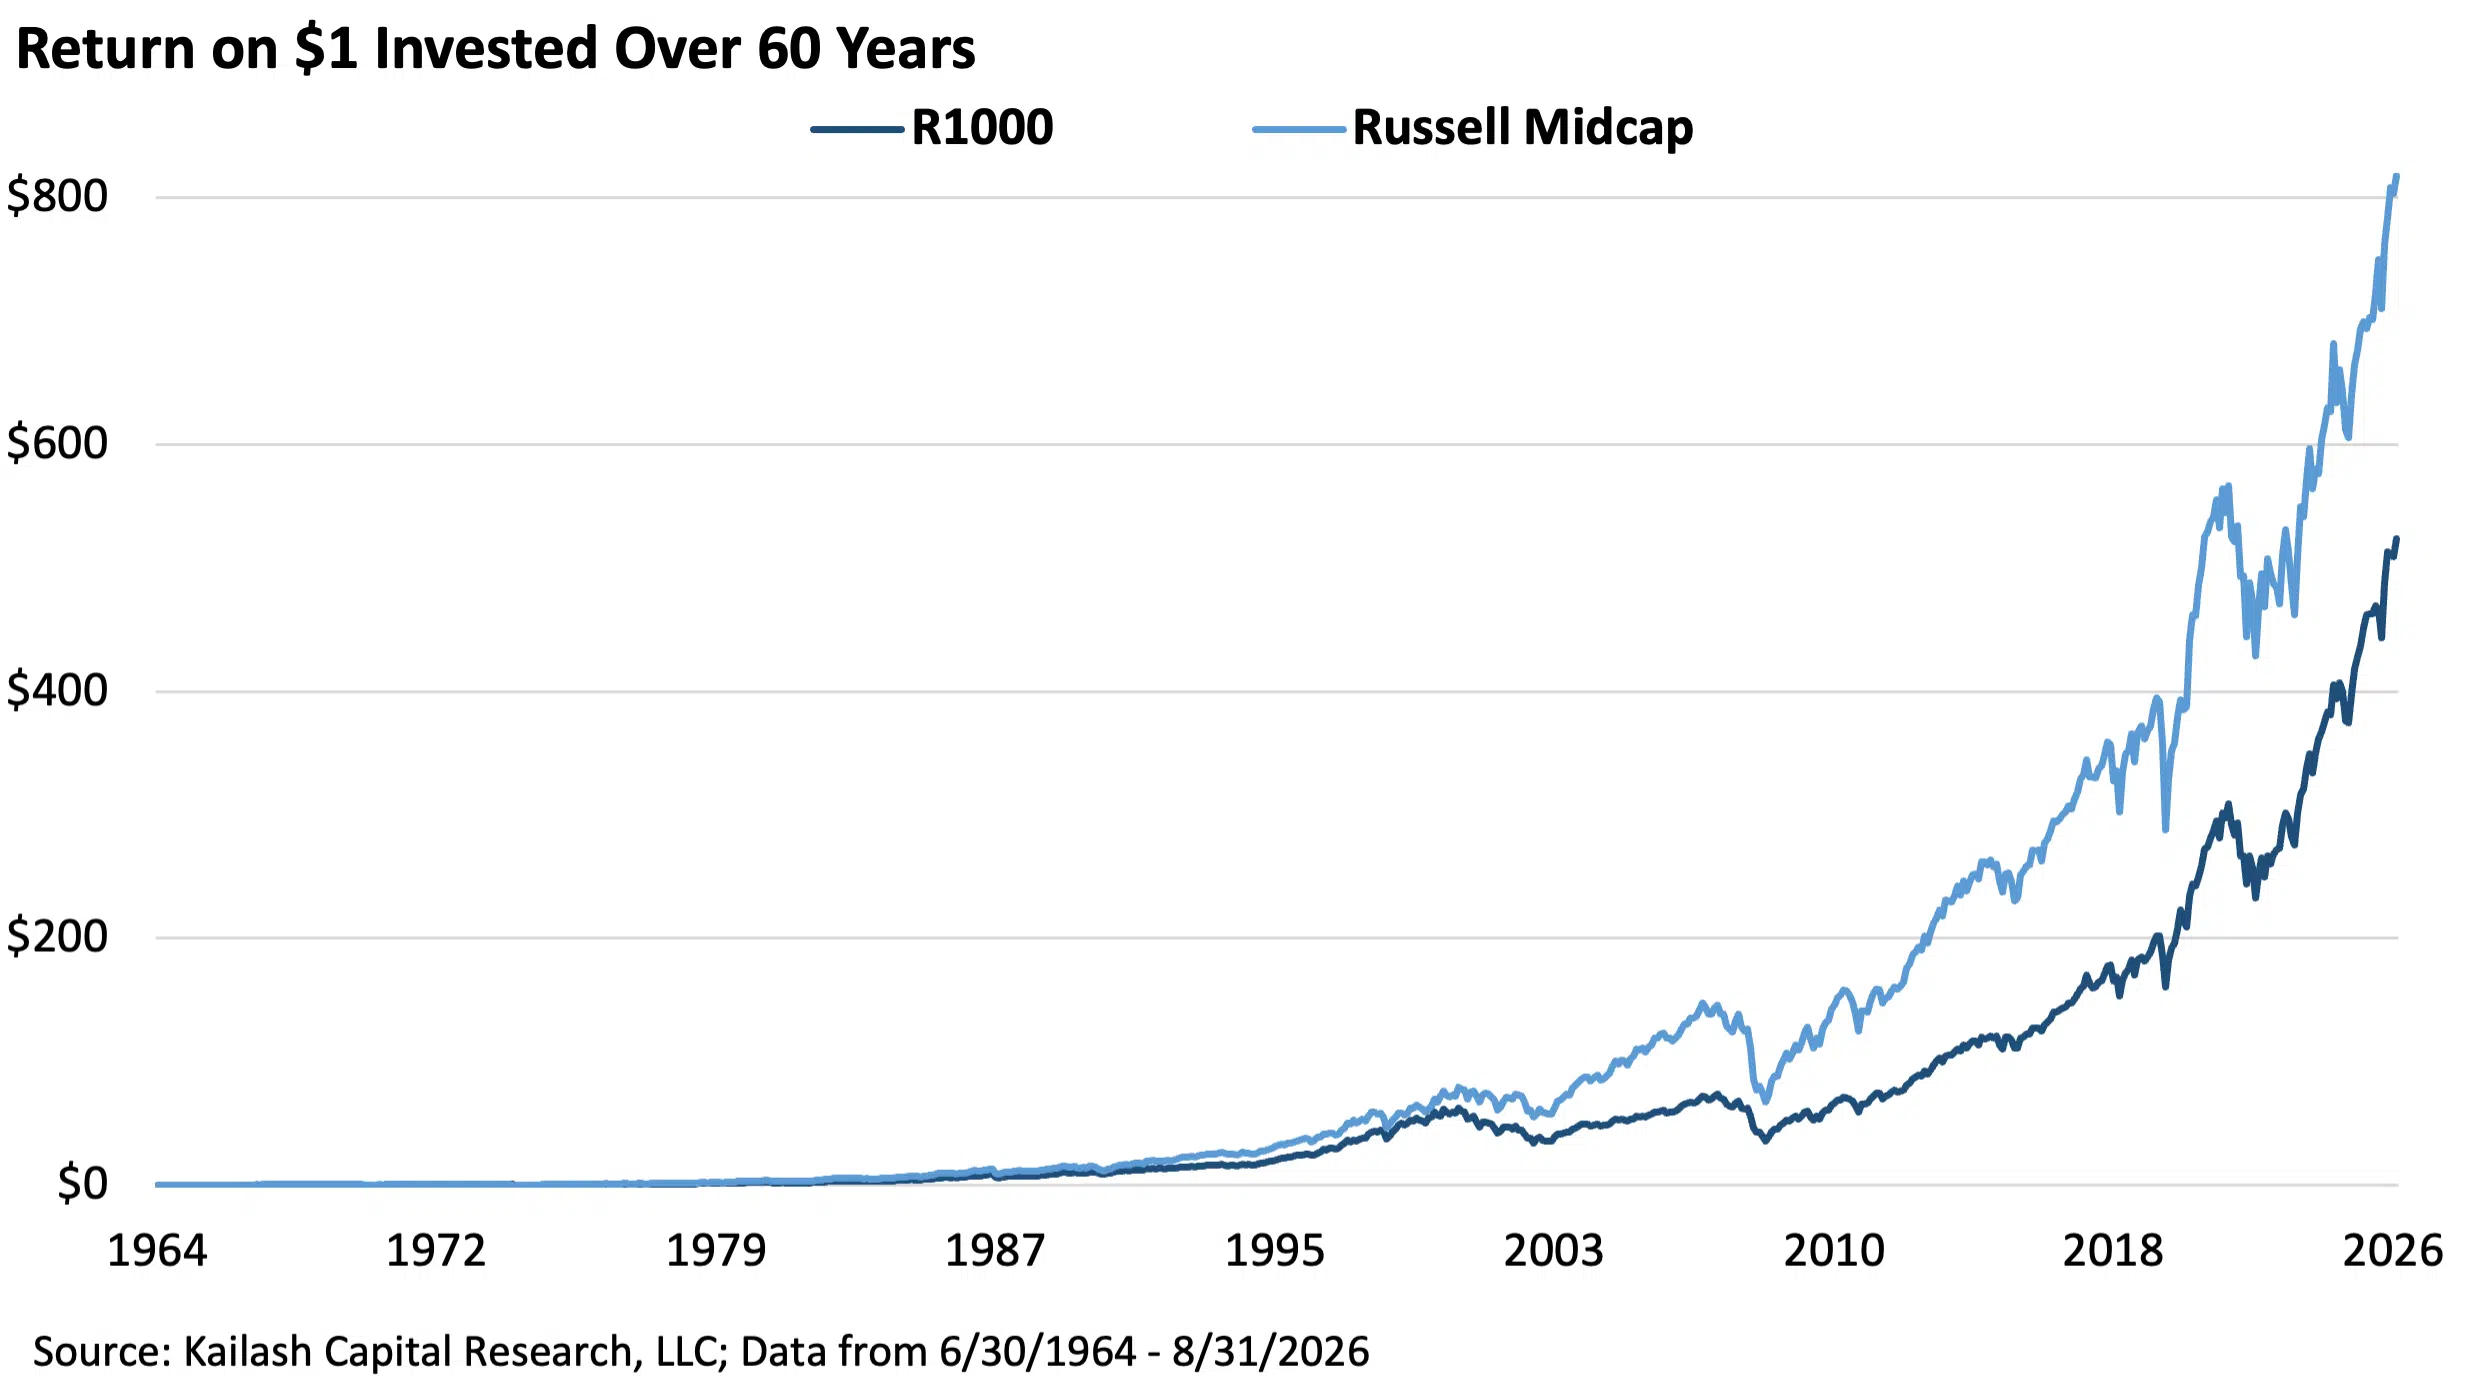
Over the full sixty-two years the picture is the same. $1 invested in June 1964 grew to $819 in midcaps versus $523 in the Russell 1000 – 11.4% versus 10.6% annualized. Eight-tenths of a point a year compounds into a 56% larger ending balance.
The batting averages have softened, which is exactly what two years of large cap dominance should do to them.
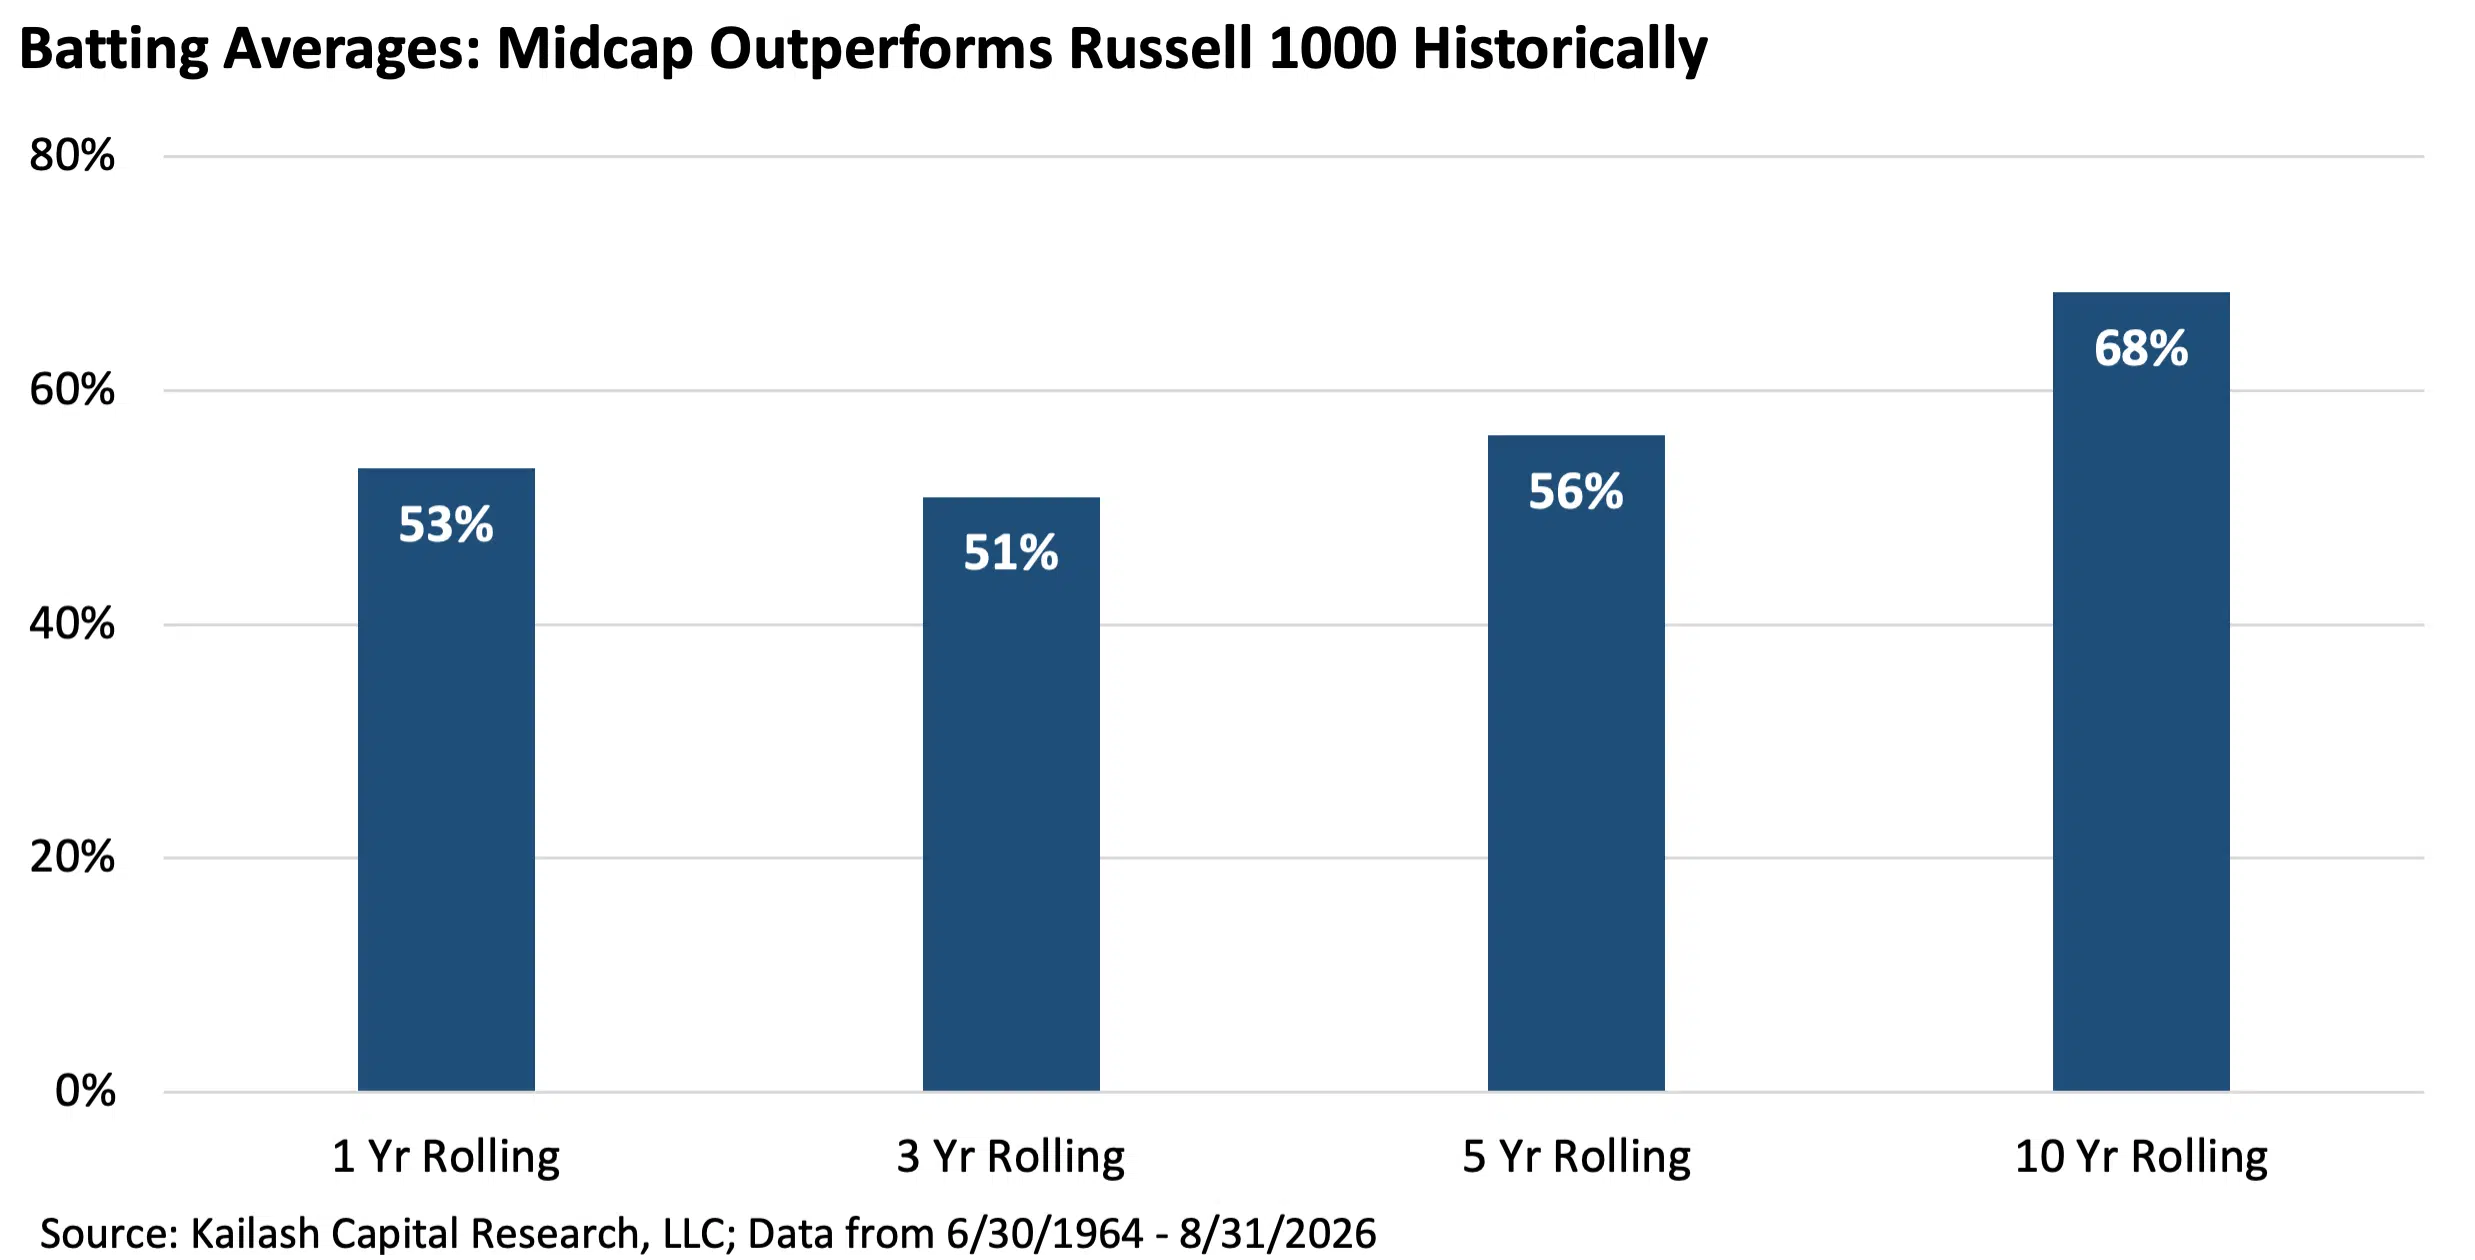
Midcaps now beat the Russell 1000 in 53% of rolling 1-year, 51% of 3-year, 56% of 5-year and 68% of rolling 10-year periods. The 10-year number is the one that matters for allocation policy, and it remains close to seven-in-ten.
Sector Composition: Concentration Has Gone Further Than We Wrote
Part I flagged Information Technology at more than 25% of the Russell 1000. It is now 36%.
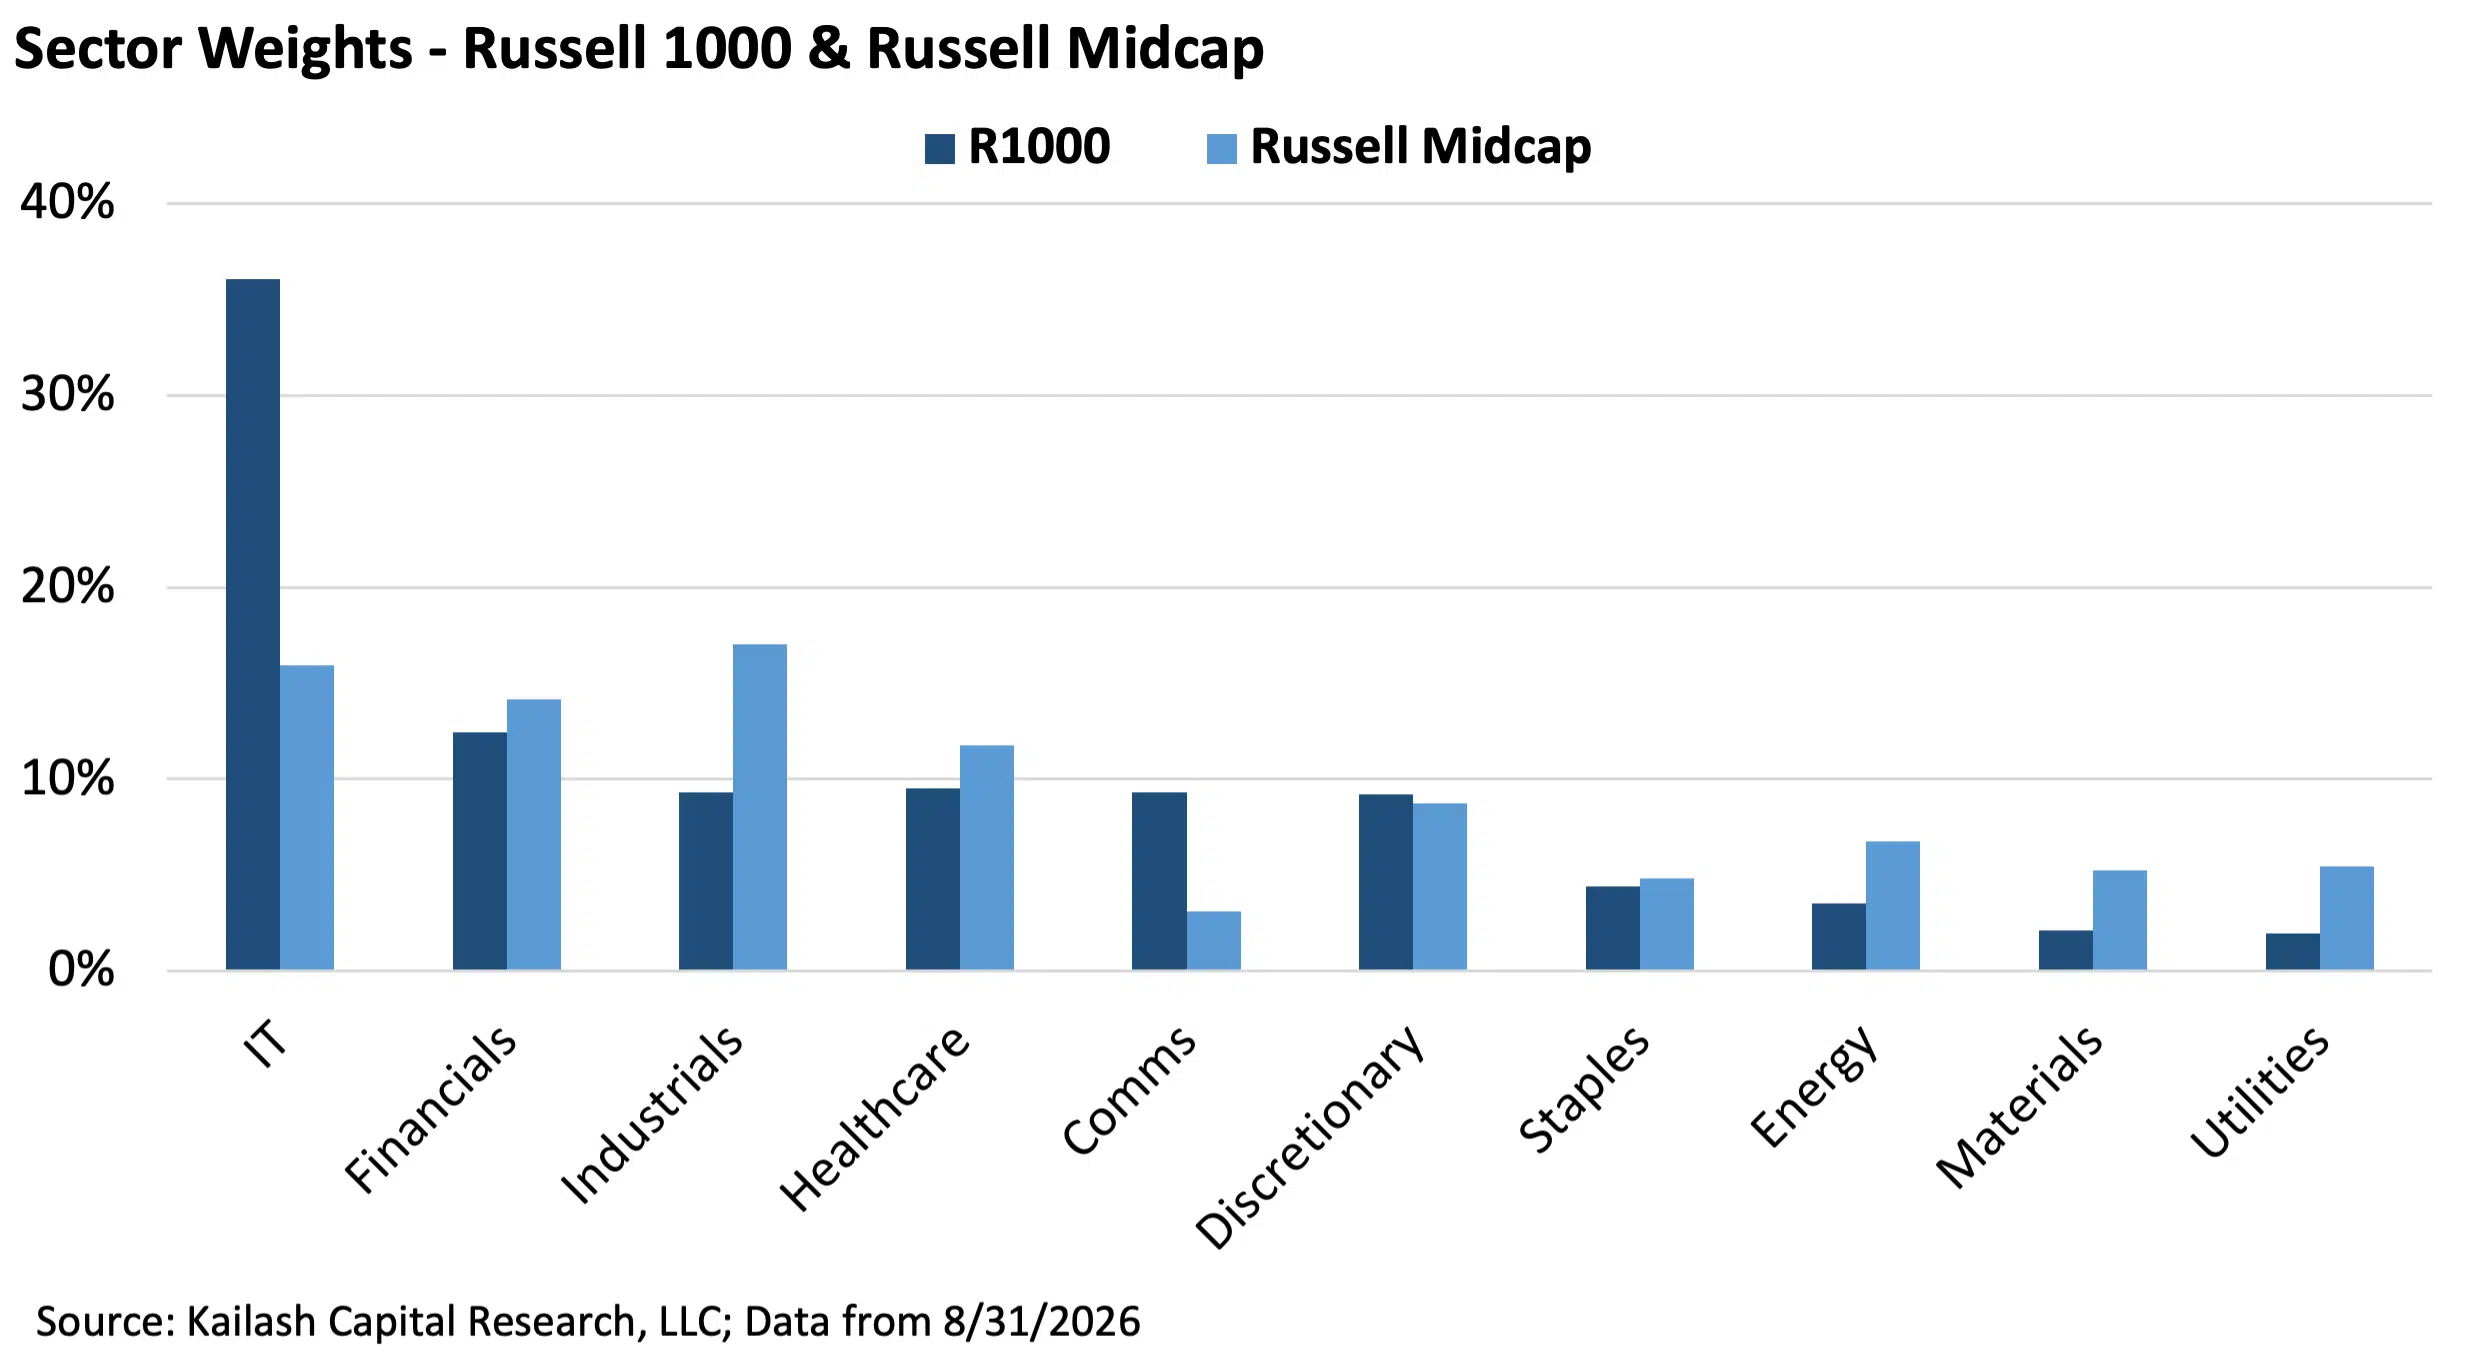
Add Communication Services and 45% of the large cap index sits in two sectors. The midcap benchmark carries just 16% in technology, and its largest single sector is Industrials at 17%, with more weight than the Russell 1000 in Financials, Industrials, Healthcare, Staples, Energy, Materials and Utilities. A diversification argument made at 25% technology weight is a considerably stronger argument at 36%, in our view.
Valuation: Every Gap in Part II Is Wider
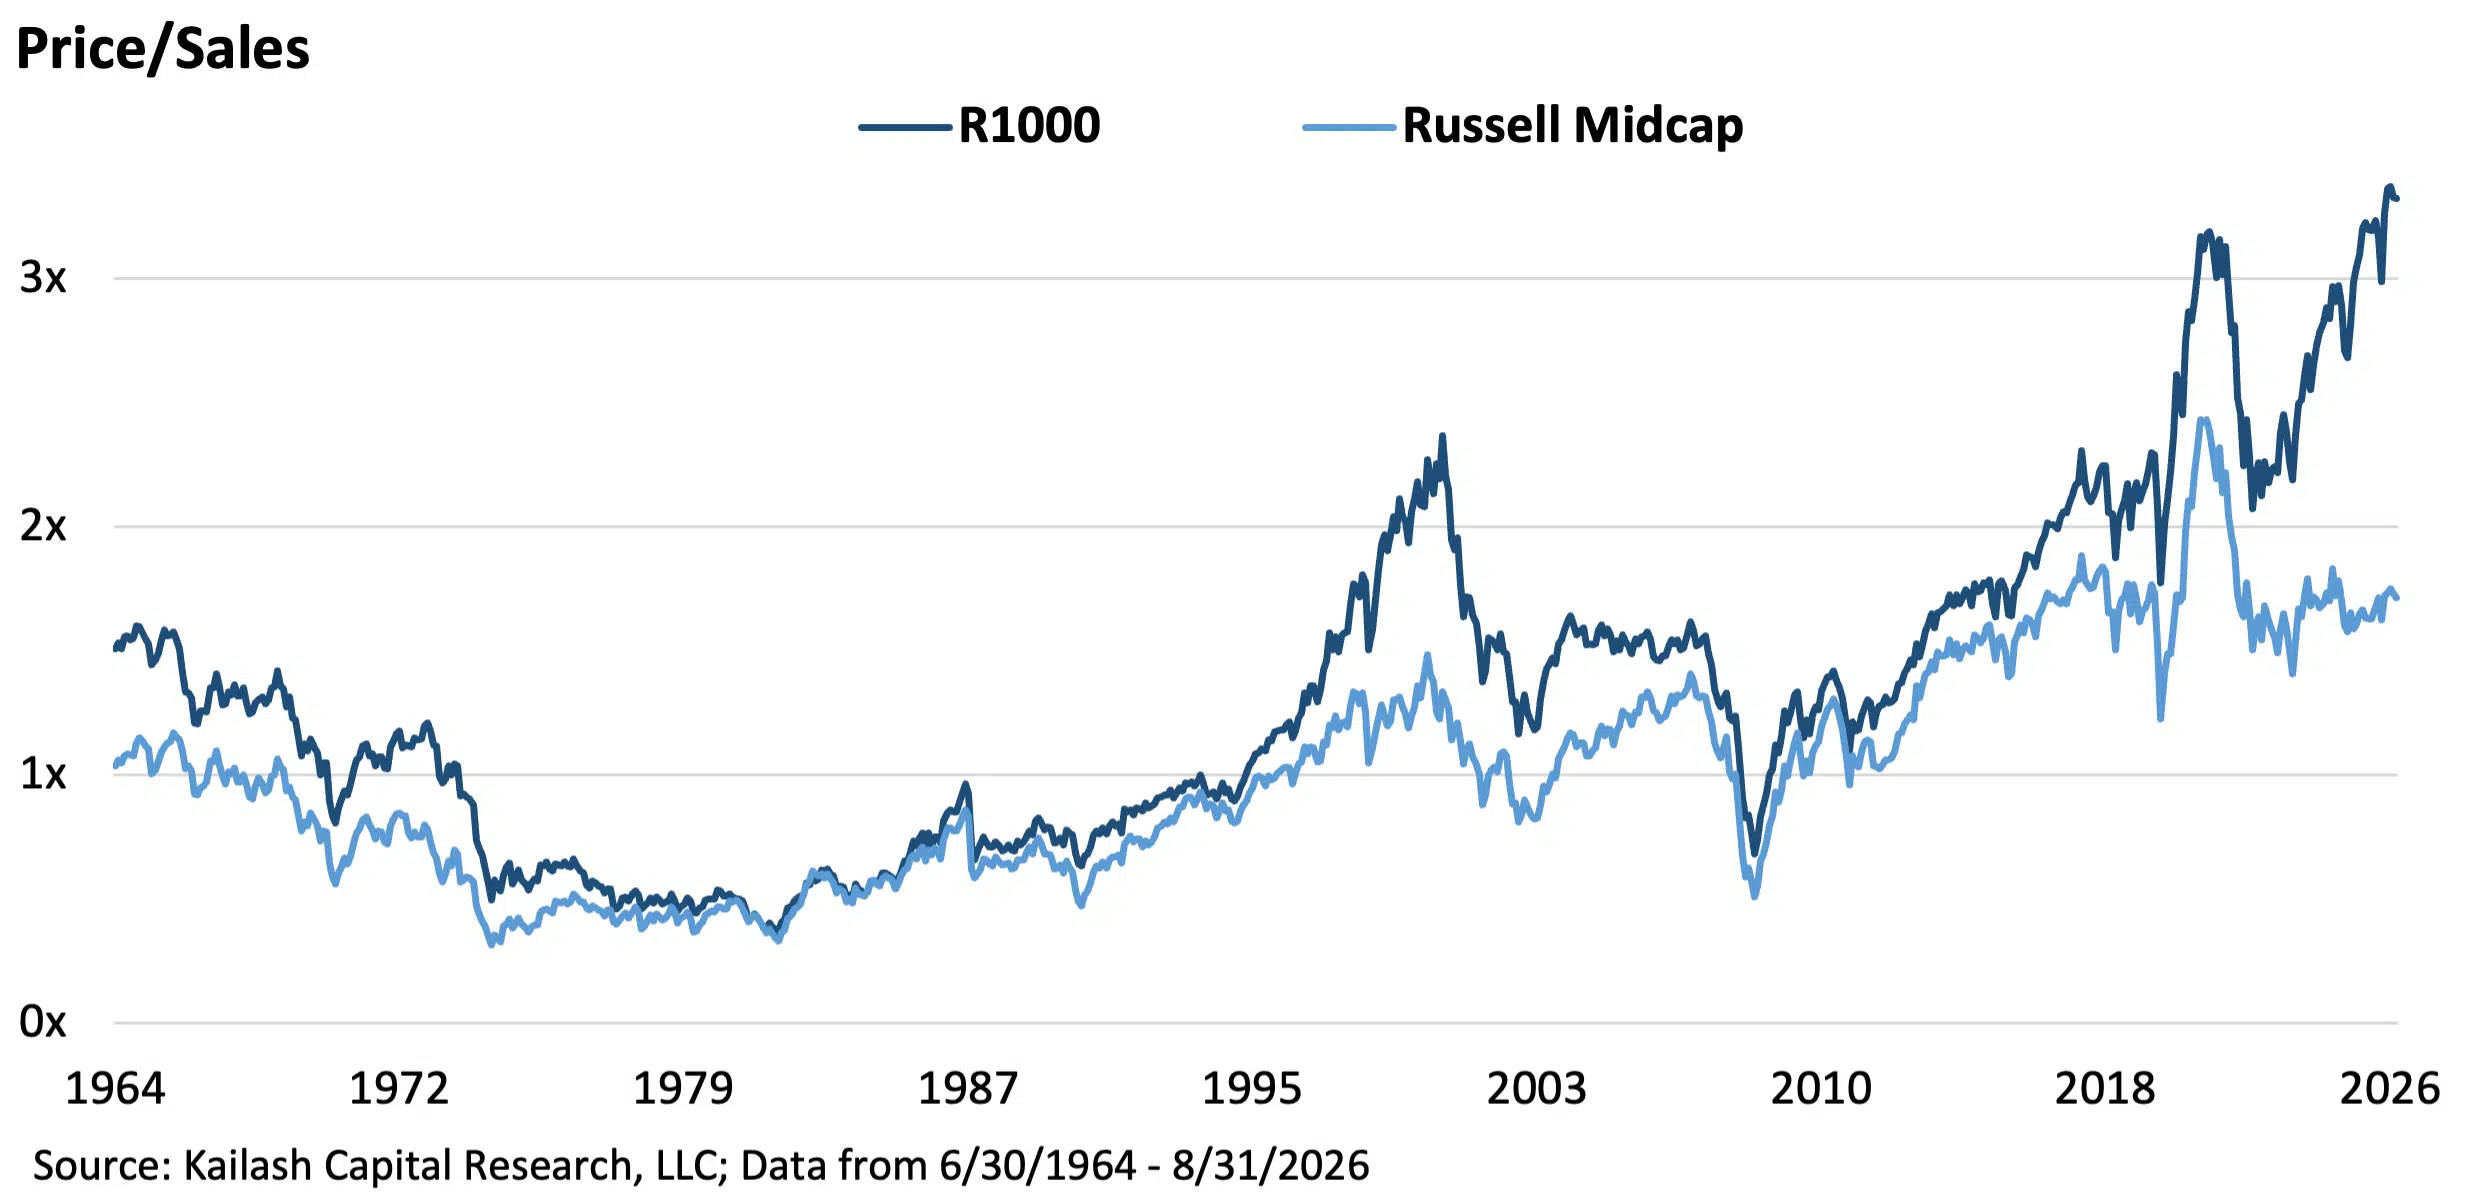
The Russell 1000 trades at 3.3x sales, an all-time high and the 99.9th percentile of its own sixty-two-year history. That is 40% above the dot.com peak of 2.4x. Midcaps trade at 1.7x – expensive by their own standards, but 28% cheaper than their April 2021 record.
Dividing the two multiples makes the point without commentary. The ratio reached a record 2.0x in October 2025 and sits at 1.9x today, the 99th percentile of history. At the 2000 peak it was 1.7x.
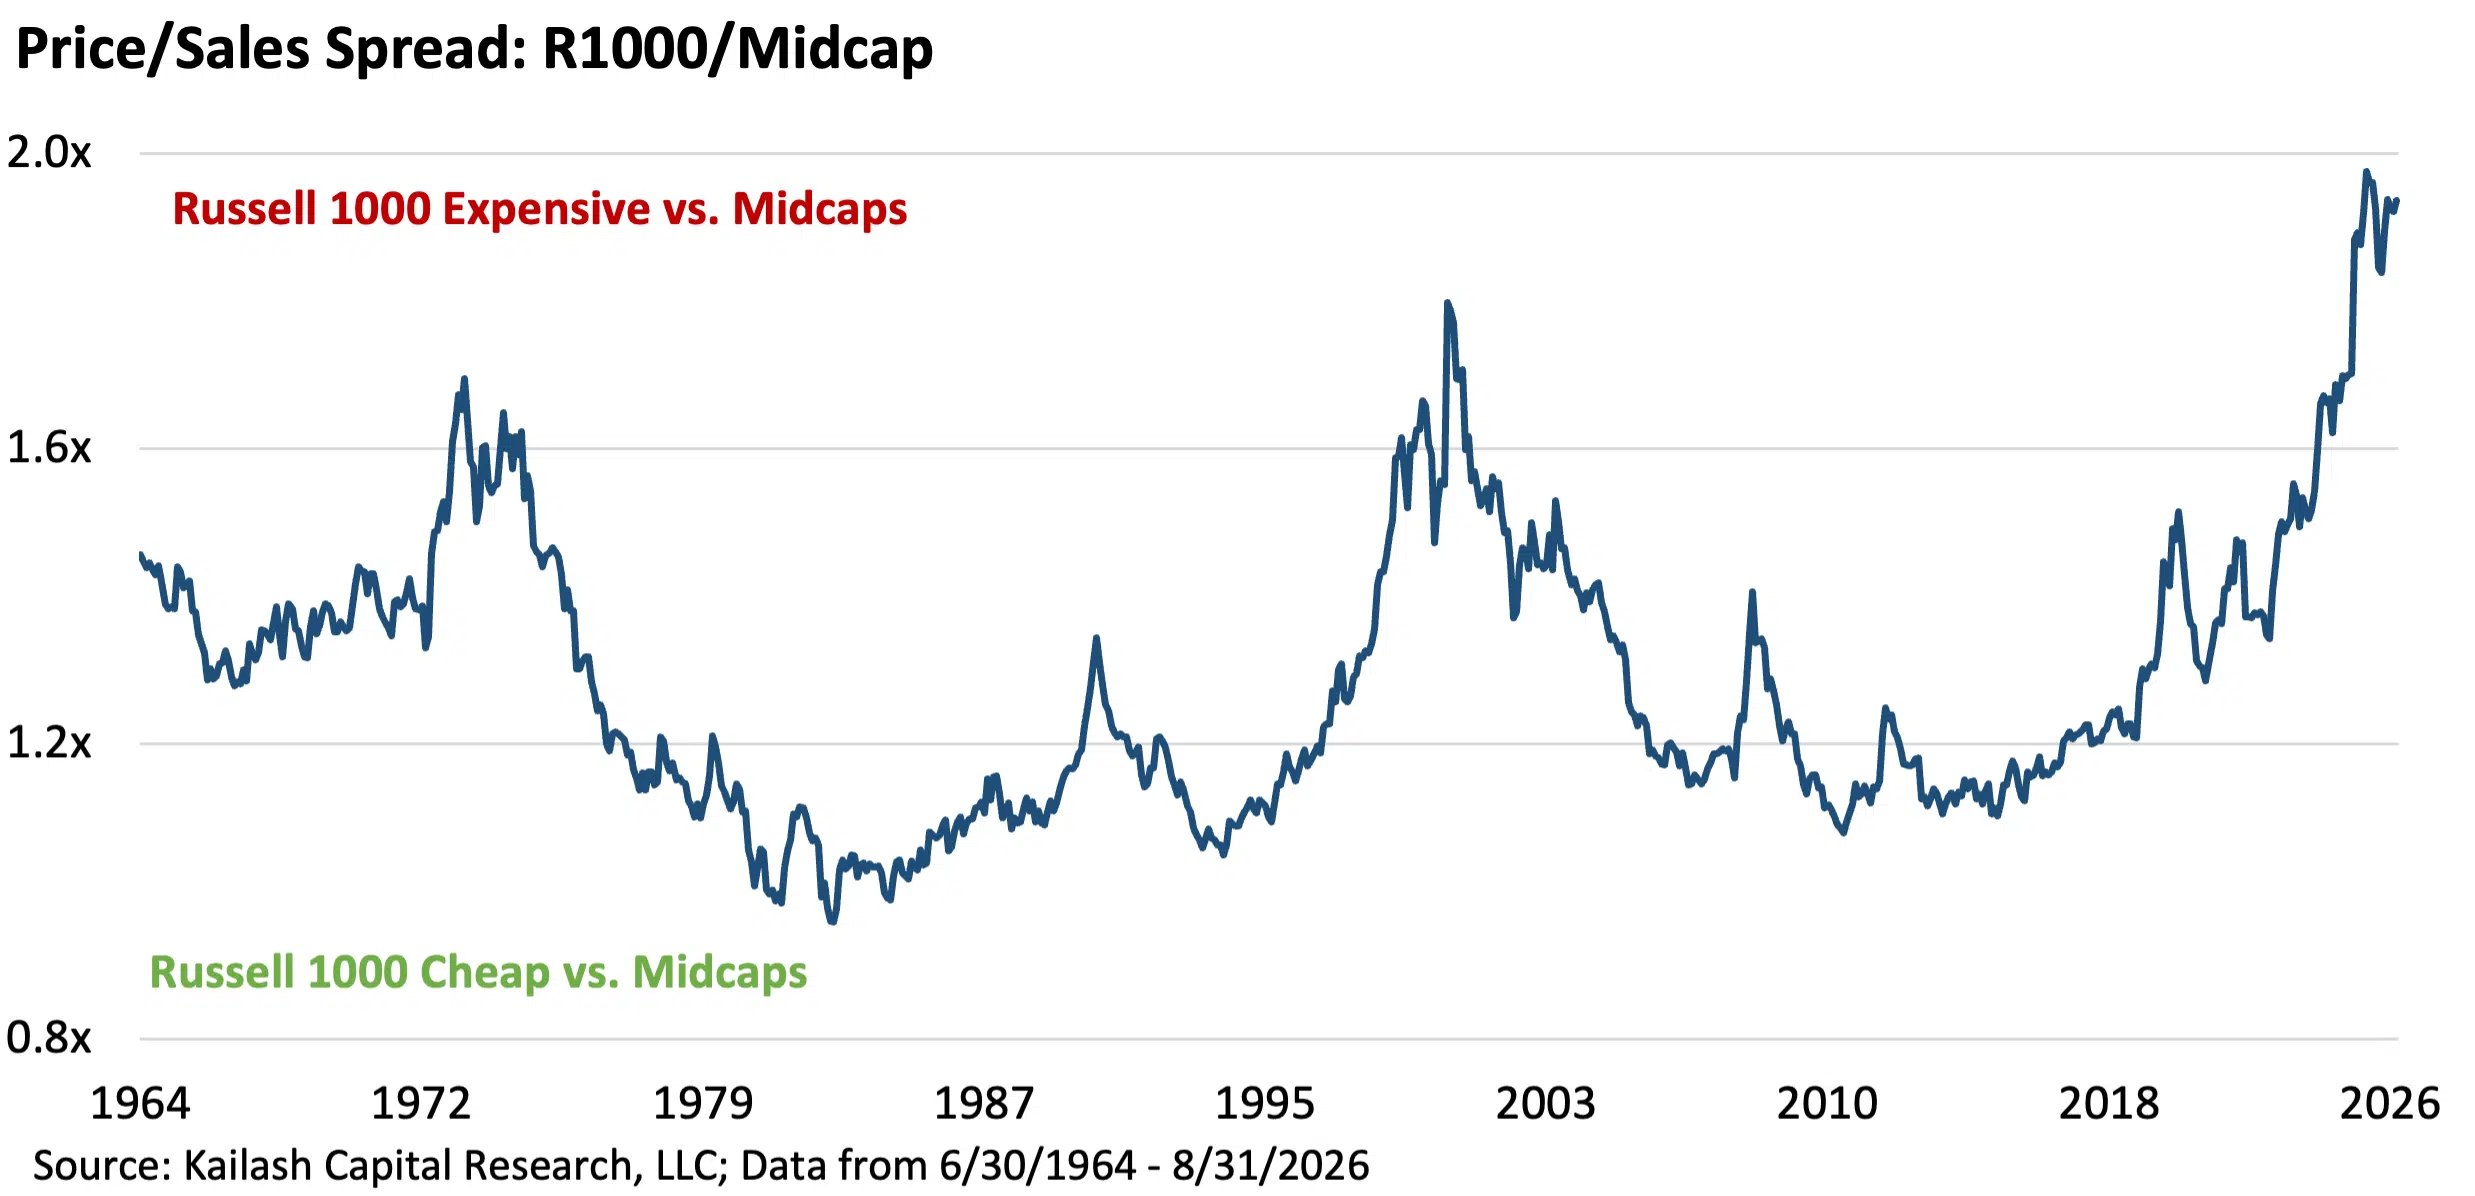
Large caps are more expensive relative to midcaps than they were at the peak of the dot.com bubble, by a wide margin. At the top of the index the picture is starker still. The largest 50 stocks trade at 6.0x sales against 4.5x at the March 2000 high.
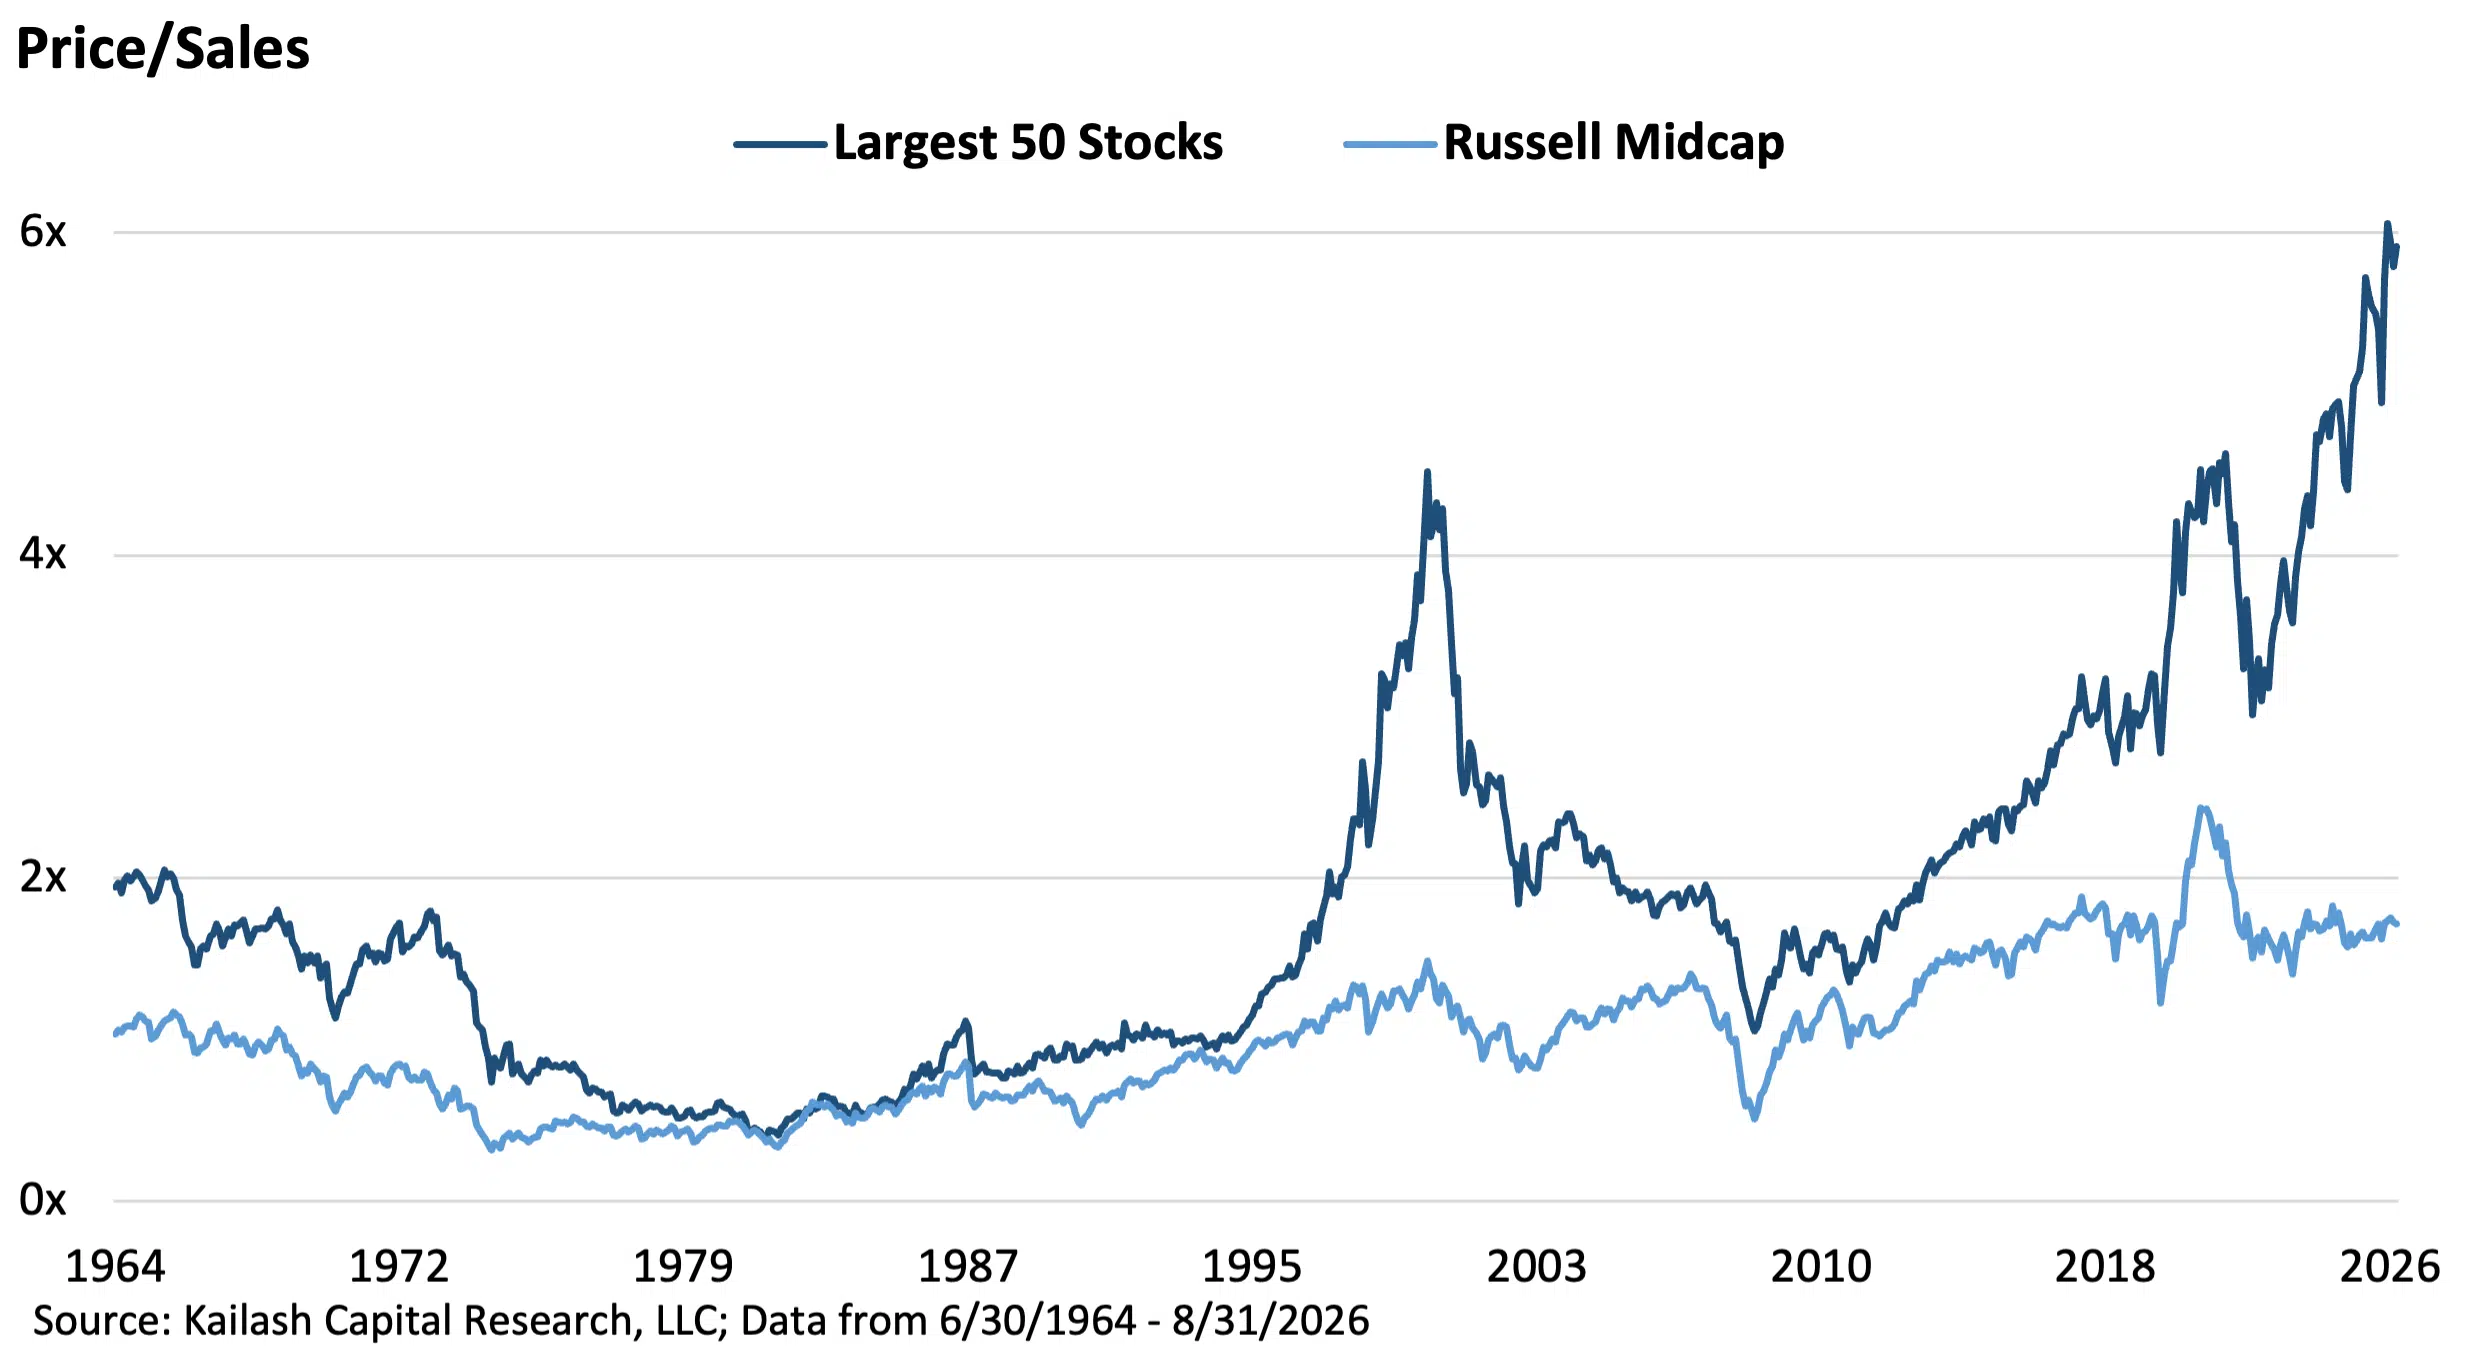
Divide those by the midcap multiple and you get the exhibit Part II built its argument around, now at a level with only one precedent in the data. The largest 50 stocks trade at a record high 3.5x the midcap multiple. The dot.com peak was also 3.5x. Not complicated.
Conclusion
Nothing in the last eighteen months has weakened the argument in Parts I and II. The data has simply moved further in the direction that made the argument in the first place despite Midcaps only lagging large caps by 3.6% in the 20 months since year end 2024. Investors own less midcap exposure than at any point on record, the large cap index is more concentrated in a single sector than it was at the top of the dot.com bubble, and the valuation gap between the largest 50 stocks and midcaps has set a new all-time high.
What has changed is that the trade is now almost two years older and has not reversed. We believe it is critical to note that while spreads have continued to widen in favor of Midcaps, the penalty for owning midcaps has only been 3.6%. That is a small relative price to pay in an up market for the significant diversification and valuation benefits offered by midcap stocks, in our view. This is particularly important when we look at the dot.com crash – in that reversion scenario, Midcap stocks went up year after year while large caps collapsed.
Relative value is not a timing signal, and the market’s answer to Part II’s title question has been “not yet.” Prices, however, are the mechanism by which the eventual answer becomes large. Every month the gap widens, the arithmetic of the eventual reversion improves for the investor holding midcaps and worsens for the investor holding the index. This is based on the historical context which foots very tightly with fundamental intuition.
Our position is unchanged: a dedicated midcap allocation belongs in any disciplined long-term program, and the case for funding it from large cap exposure is stronger today than it was when we made it.
Please find below our most recent Top Ranked Midcap stocks.


Disclaimer
The information, data, analyses, and opinions presented herein (a) do not constitute investment advice, (b) are provided solely for informational purposes and therefore are not, individually or collectively, an offer to buy or sell a security, (c) are not warranted to be correct, complete or accurate, and (d) are subject to change without notice. Kailash Capital Research, LLC and its affiliates (collectively, “KCR”) shall not be responsible for any trading decisions, damages, or other losses resulting from, or related to, the information, data, analyses or opinions or their use. The information herein may not be reproduced or retransmitted in any manner without the prior written consent of KCR. In preparing the information, data, analyses, and opinions presented herein, KCR has obtained data, statistics, and information from sources it believes to be reliable. KCR, however, does not perform an audit or seek independent verification of any of the data, statistics, and information it receives. KCR and its affiliates do not provide tax, legal, or accounting advice. This material has been prepared for informational purposes only and is not intended to provide, and should not be relied on for tax, legal, or accounting advice. You should consult your tax, legal, and accounting advisors before engaging in any transaction.
Nothing herein shall limit or restrict the right of affiliates of KCR to perform investment management or advisory services for any other persons or entities. Furthermore, nothing herein shall limit or restrict affiliates of KCR from buying, selling, or trading securities or other investments for their own accounts or for the accounts of their clients. Affiliates of KCR may at any time have, acquire, increase, decrease, or dispose of the securities or other investments referenced in this publication. KCR shall have no obligation to recommend securities or investments in this publication as a result of its affiliates’ investment activities for their own accounts or for the accounts of their clients.
© 2026 Kailash Capital Research, LLC – All rights reserved.
October 8, 2026 |
| Authors: Matthew Malgari, Nathan Przybylo, Dr. Sanjeev Bhojraj and John Durkin
October 8, 2026
Authors: Matthew Malgari, Nathan Przybylo, Dr. Sanjeev Bhojraj and John Durkin
