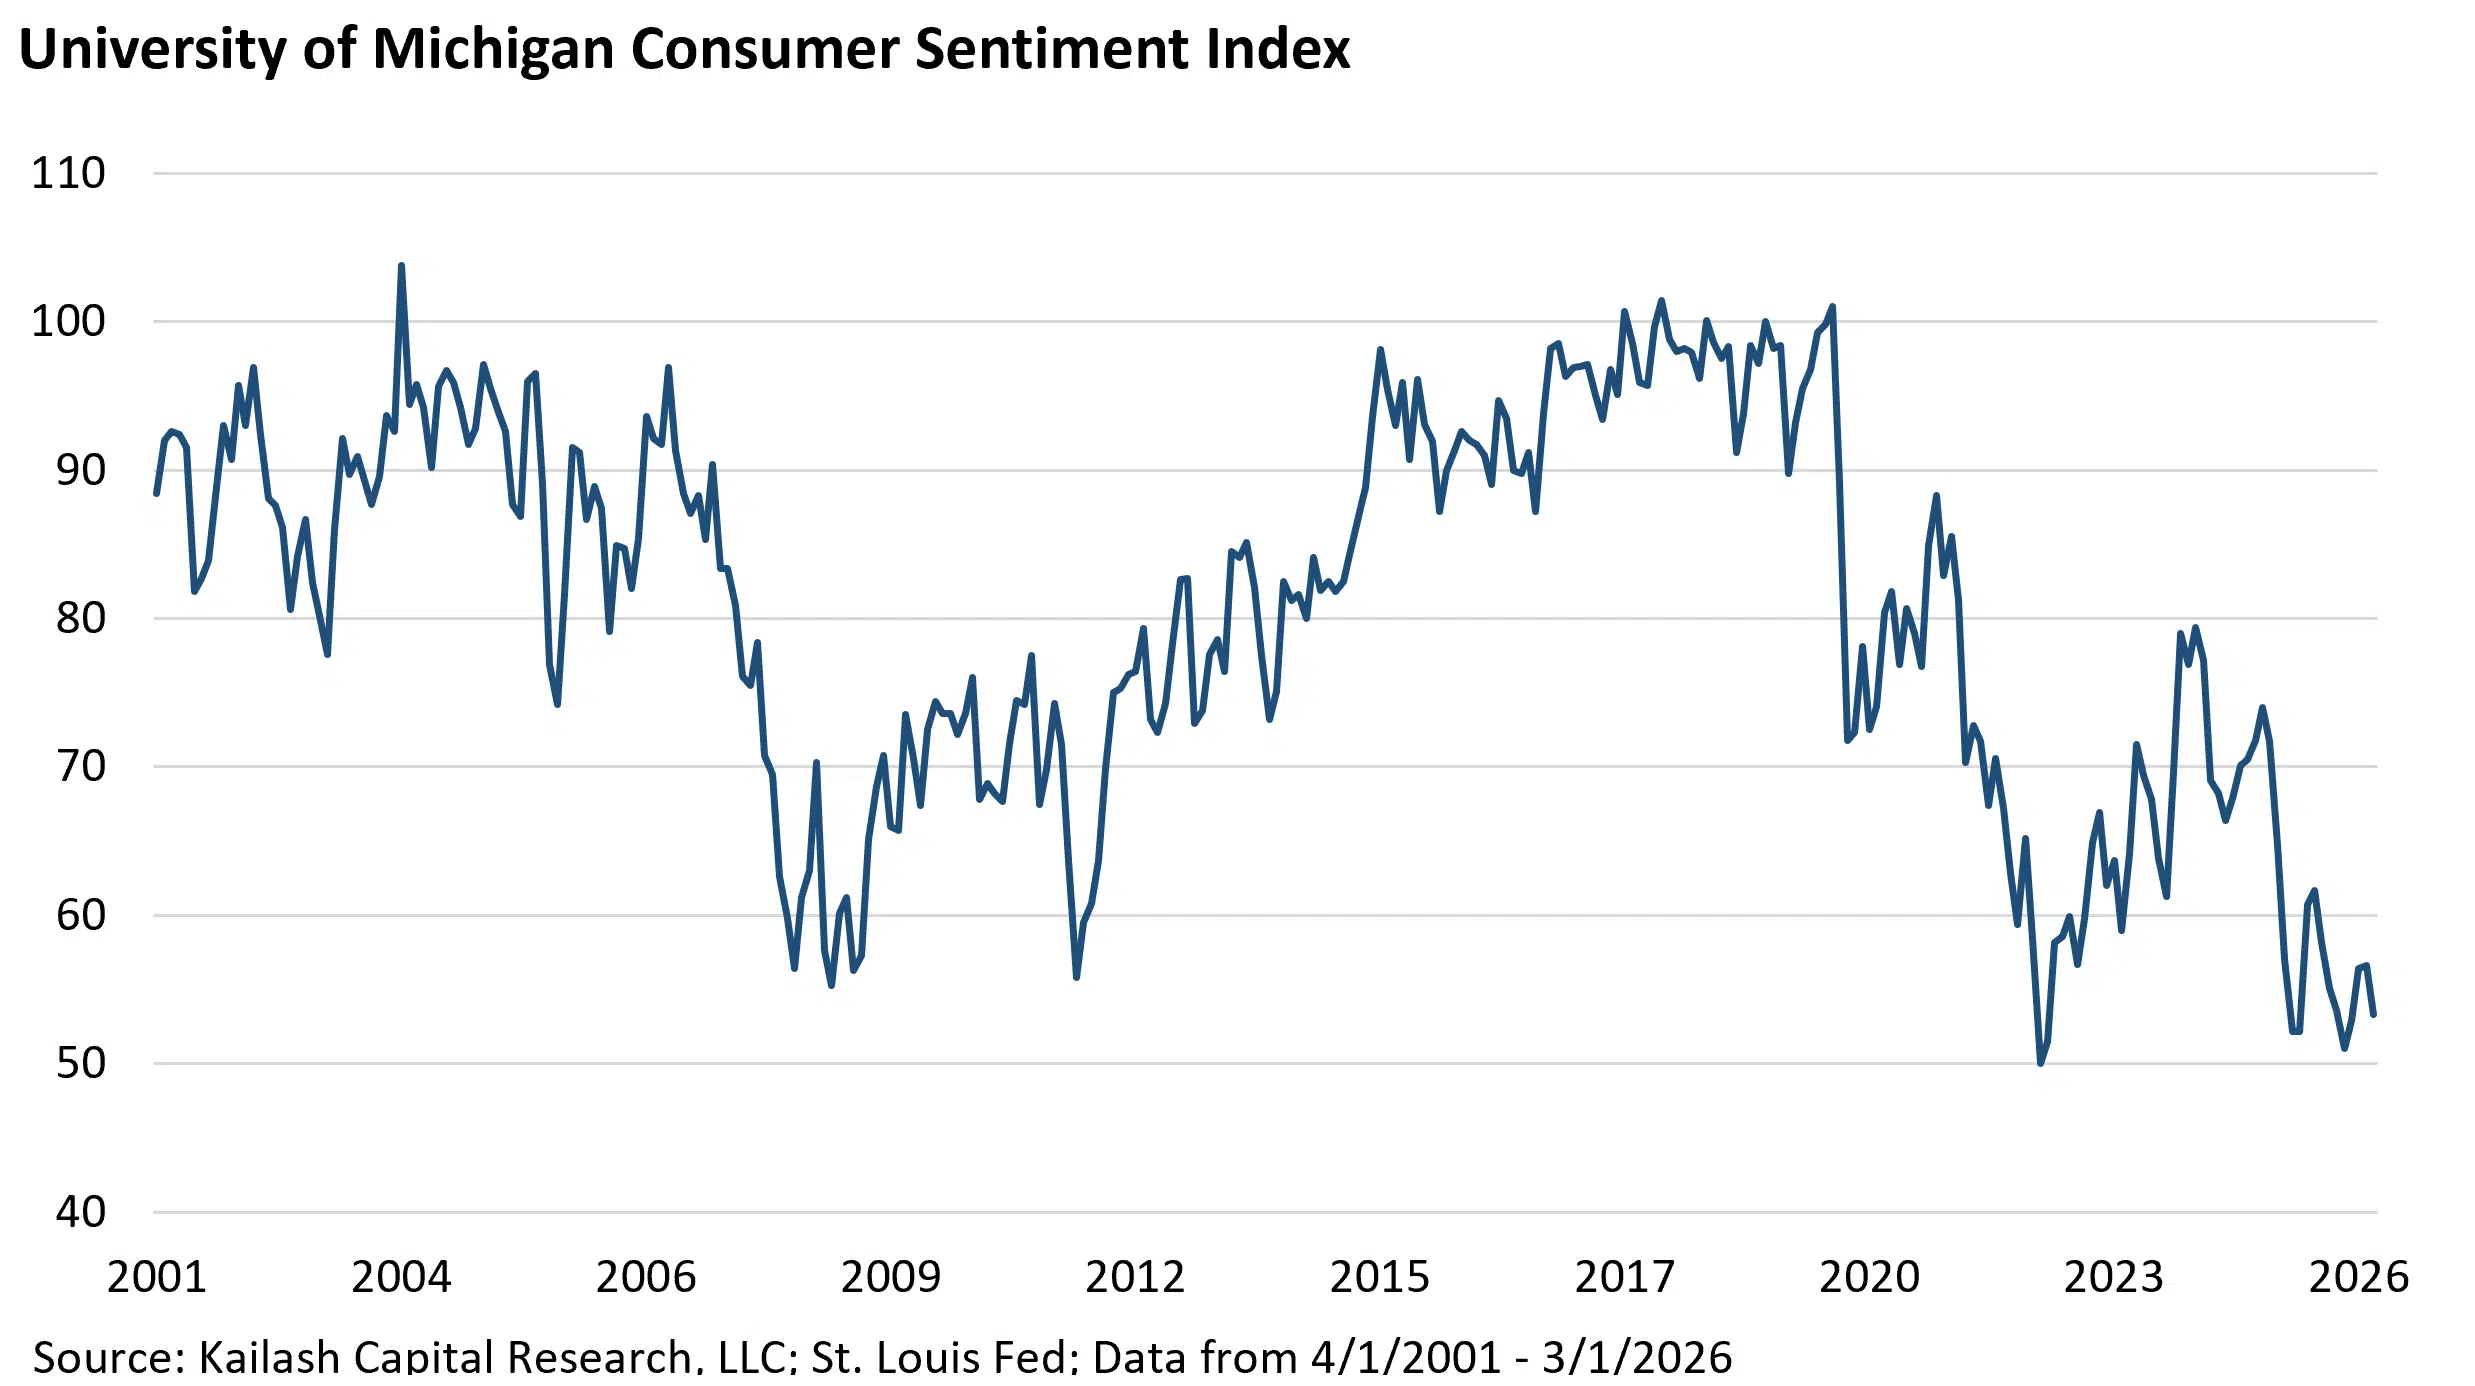
Consumers haven’t been this glum since COVID pandemic supply chain snarls met up with stimulus payments to push inflation up to levels not seen in decades. The University of Michigan Consumer Sentiment Index, which often correlates more tightly with grocery and gas prices than the stock market, is lower than it was during the global financial crisis of 2008.
Get our insights direct to your inbox: SUBSCRIBE
Americans are unhappier than any time in the last 25 years:
And while the average consumer is being squeezed by rising prices for essentials as wages are barely keeping up with rising inflation, [1] the U.S. stock market keeps hitting new highs. Can the stock market highs and consumers’ grim mood both be a reflection of what’s going on in the U.S. economy? They can, when the economy is two-faced, as it appears to be today.
The market’s ability to keep hitting new highs despite the economic blow from the closure of the Strait of Hormuz lies in expectations for tech sector profits from AI. Consider that chip manufacturers’ stock prices, measured by the Philadelphia Semiconductor Index, jumped 70% in two months. [2] Seem reasonable? It is not.
That works out to a 2,217% annualized rate of return. [3]
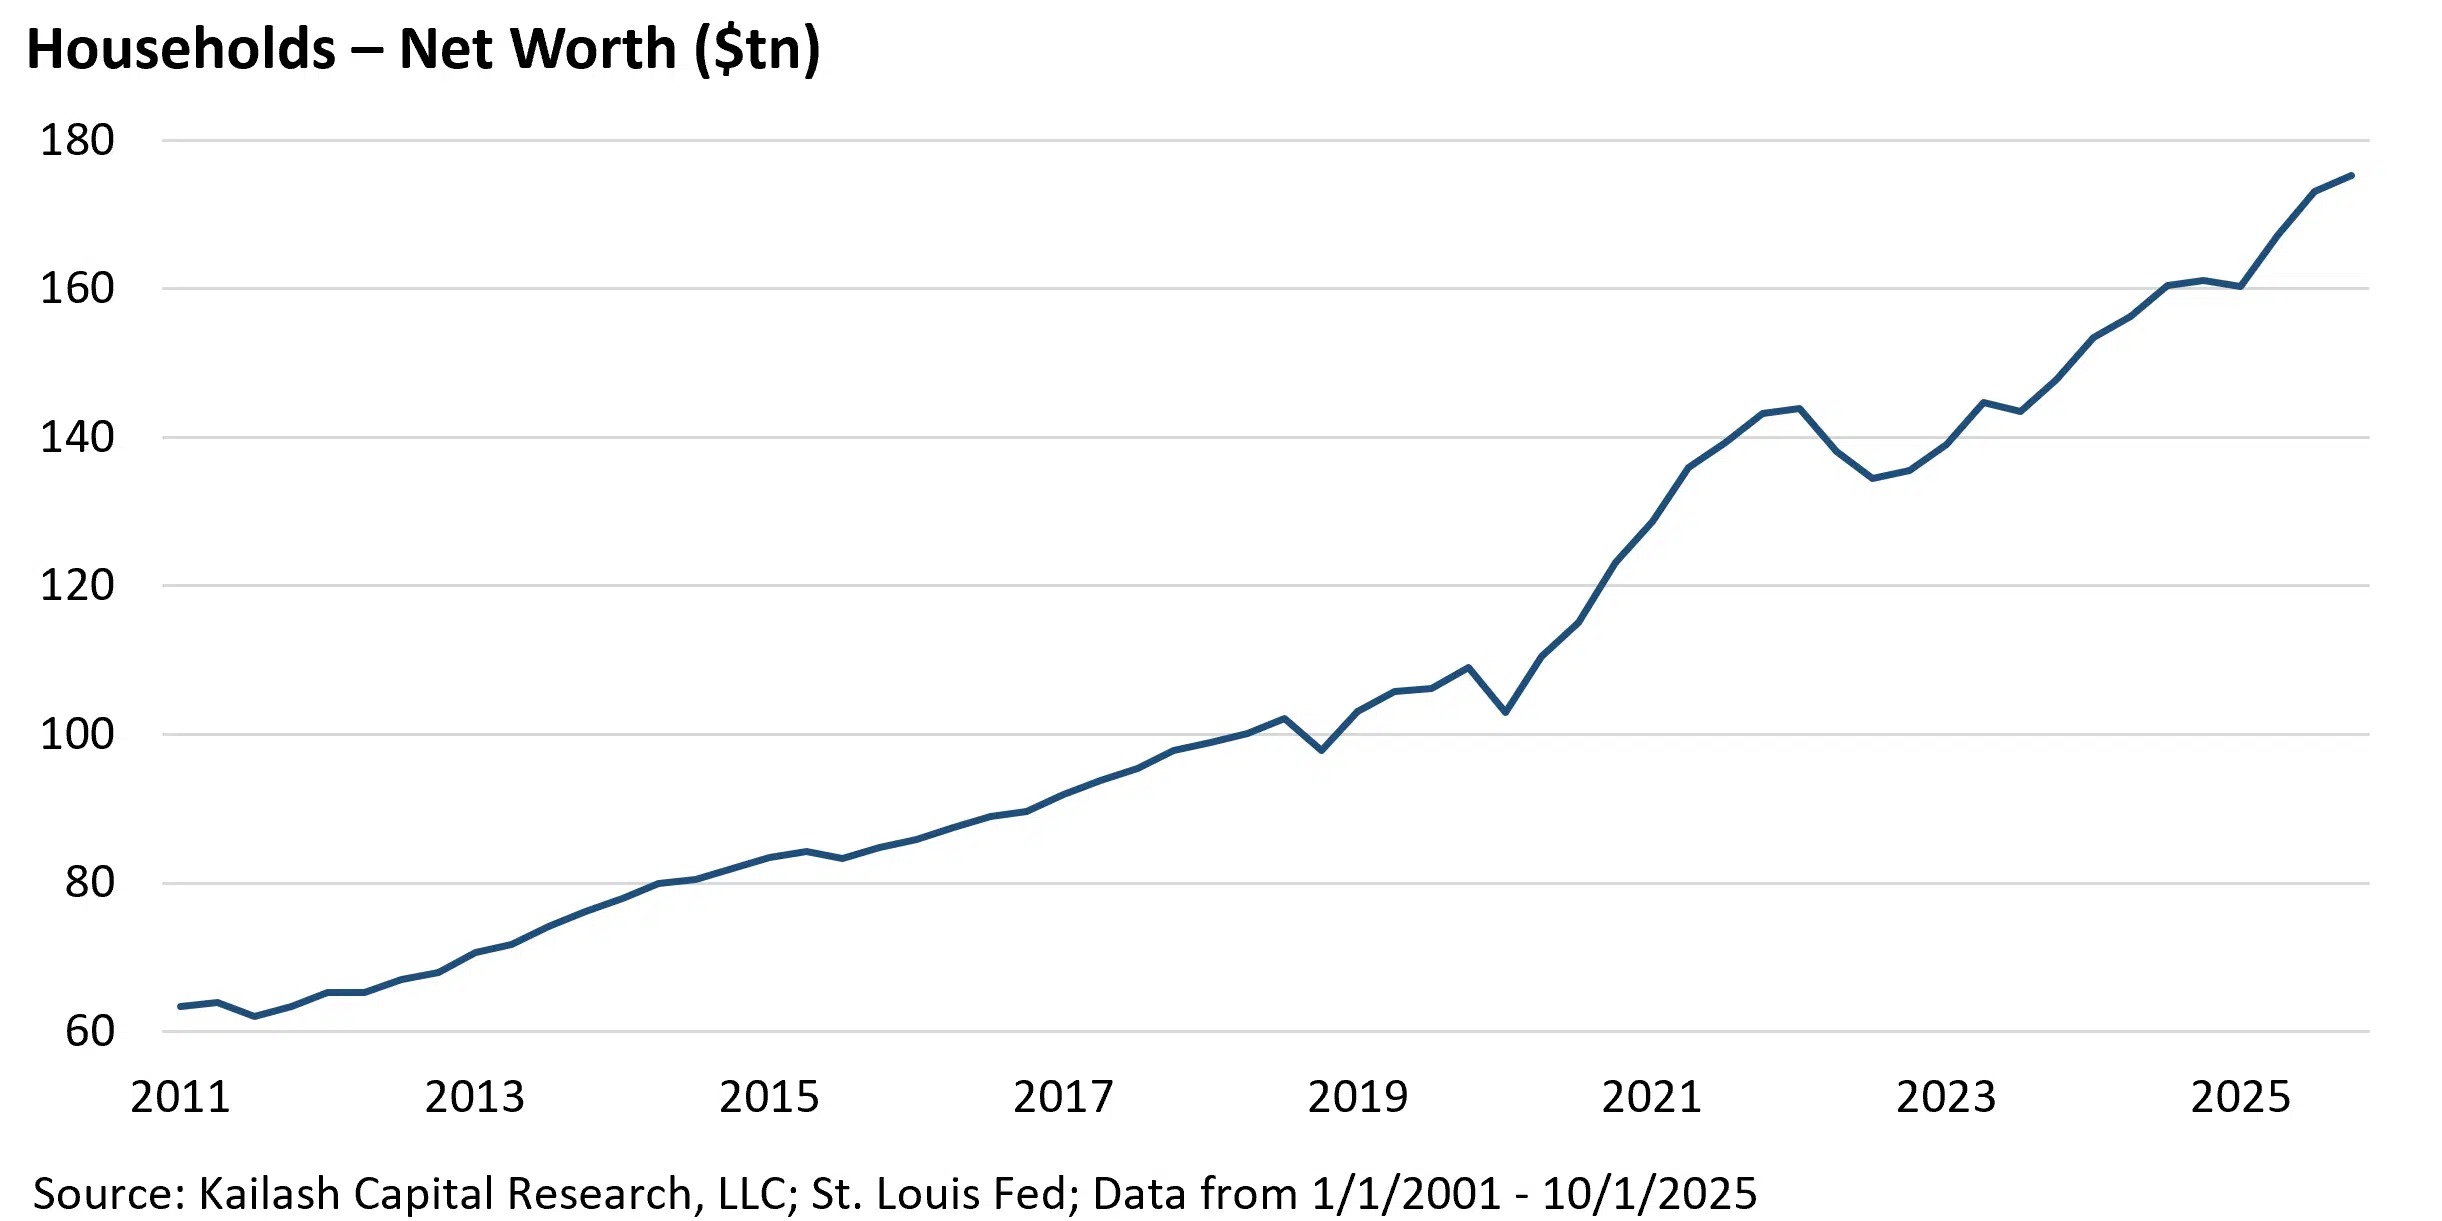
Household Net Worth: Rising stock prices are generating a notable wealth effect (you feel wealthier when the value of your portfolio is growing), putting households that own stocks in a spending mood. [4],[5] After the Great Financial Crisis, American’s participation in equities fell to only ~50% of consumers in 2013. Since then, the percentage of Americans with equity exposure has soared to 62%. [6]
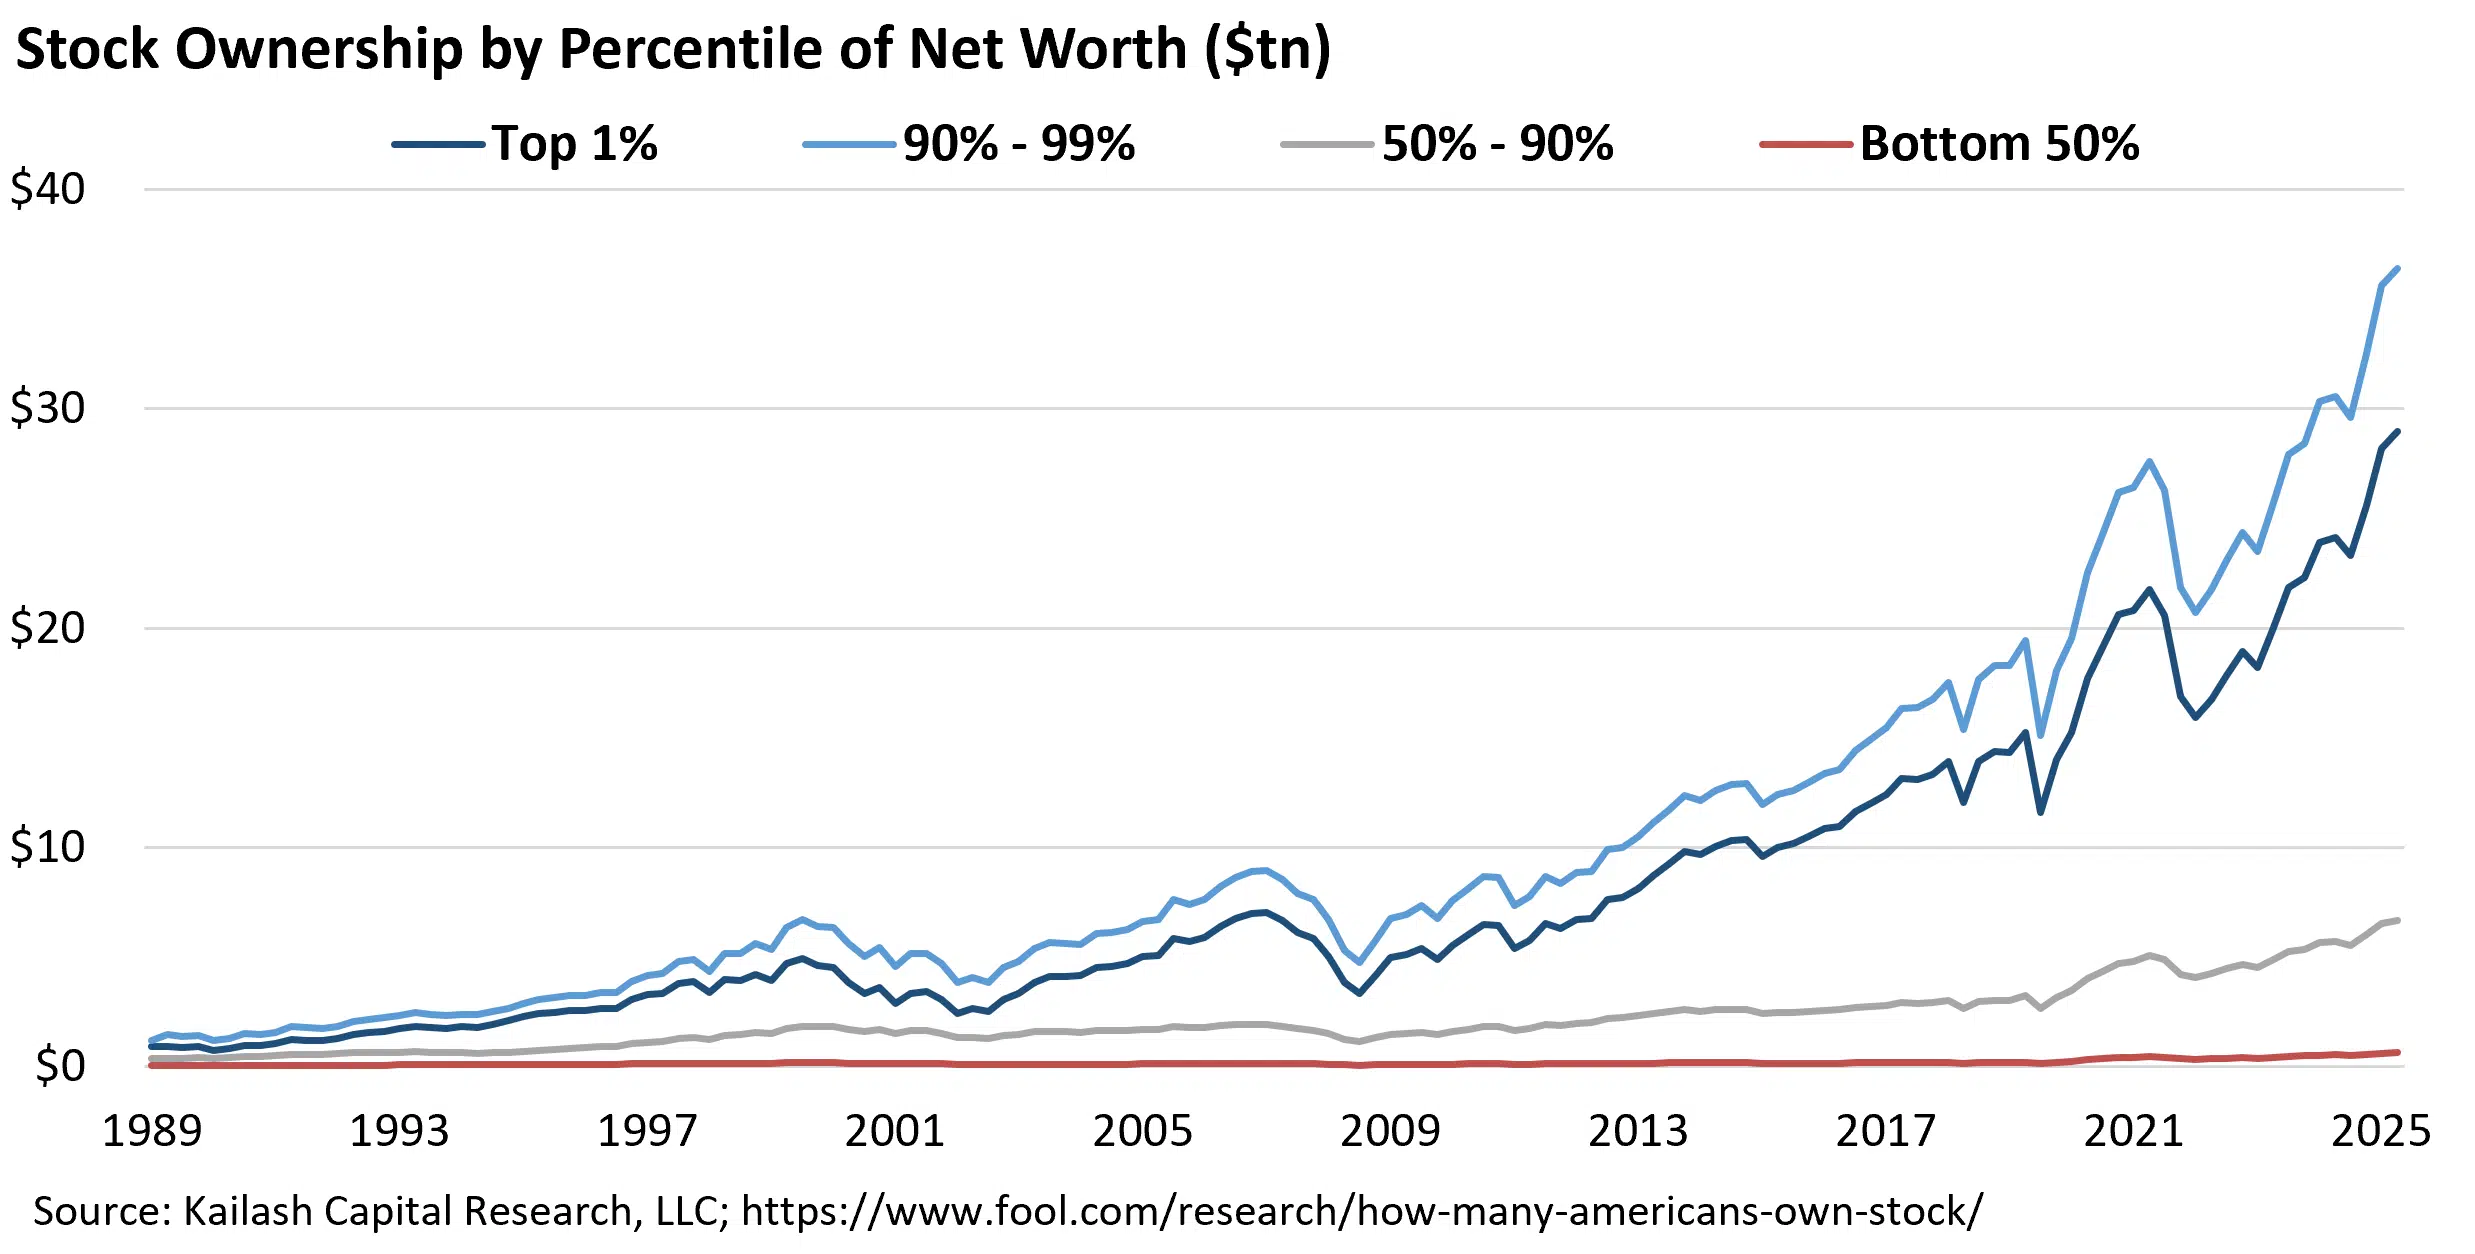
So why the misery in the Michigan Index? The top 10% of households now own between 87% and 93% of stocks (~$44 trillion worth) and account for about 50% of personal spending. [7], [8], [9] And that spending is supporting revenue and earnings for the travel industry, luxury hotels, and high-end retailers.
Meanwhile, the bottom 50% of Americans own 1% of stocks worth only $620 billion. [10] Here is how the distribution of wealth looks. With this in mind, the Michigan sentiment index makes a great deal more sense.
Amplifying the enormous disparity above, lower- and middle-income households are hit hardest by the rising cost of essentials like gas and groceries. [11], [12],[13],[14] Many are trading down, hunting for value, and cutting discretionary purchases. [15] That helps to explain why consumer spending and consumer sentiment seem so out of step.
The Macro Forces
Lower/middle income households sense they are falling behind, for good reason. While headline inflation has cooled versus a few years ago, cumulative price increases for essentials have shifted consumers’ costs much higher. A recent analysis from the New York Fed confirms this: from January 2023 through March 2026, only high-income households consistently experienced real spending growth. [16]
Here we look at this in terms of changes in real earnings and “necessity inflation”.

After rising modestly in the two years prior to the COVID-19 pandemic, real (inflation-adjusted) wages spiked due to government stimulus payments and worker shortages, then fell back to pre-COVID levels, then started climbing again. But wage growth in terms of median real (adjusted for inflation) earnings has recently flattened. From April 2025 to April 2026, nominal wages grew more slowly than inflation, 3.6% versus 3.8%. [17] And from March to April 2026, real average hourly earnings for all employees decreased 0.5%. [18] In short, workers’ purchasing power is slipping.
“Necessity” Inflation: Headline CPI includes many things consumers buy infrequently, such as used cars and TVs. If prices for those things are fairly stable, it helps to keep CPI in check. But if we haven’t shopped for those things recently, that headline number doesn’t reflect our actual experience. We feel inflation mostly based on the things we buy regularly. Among the most conspicuous of these is, of course, the gasoline we put in our cars.
CPI: Gasoline
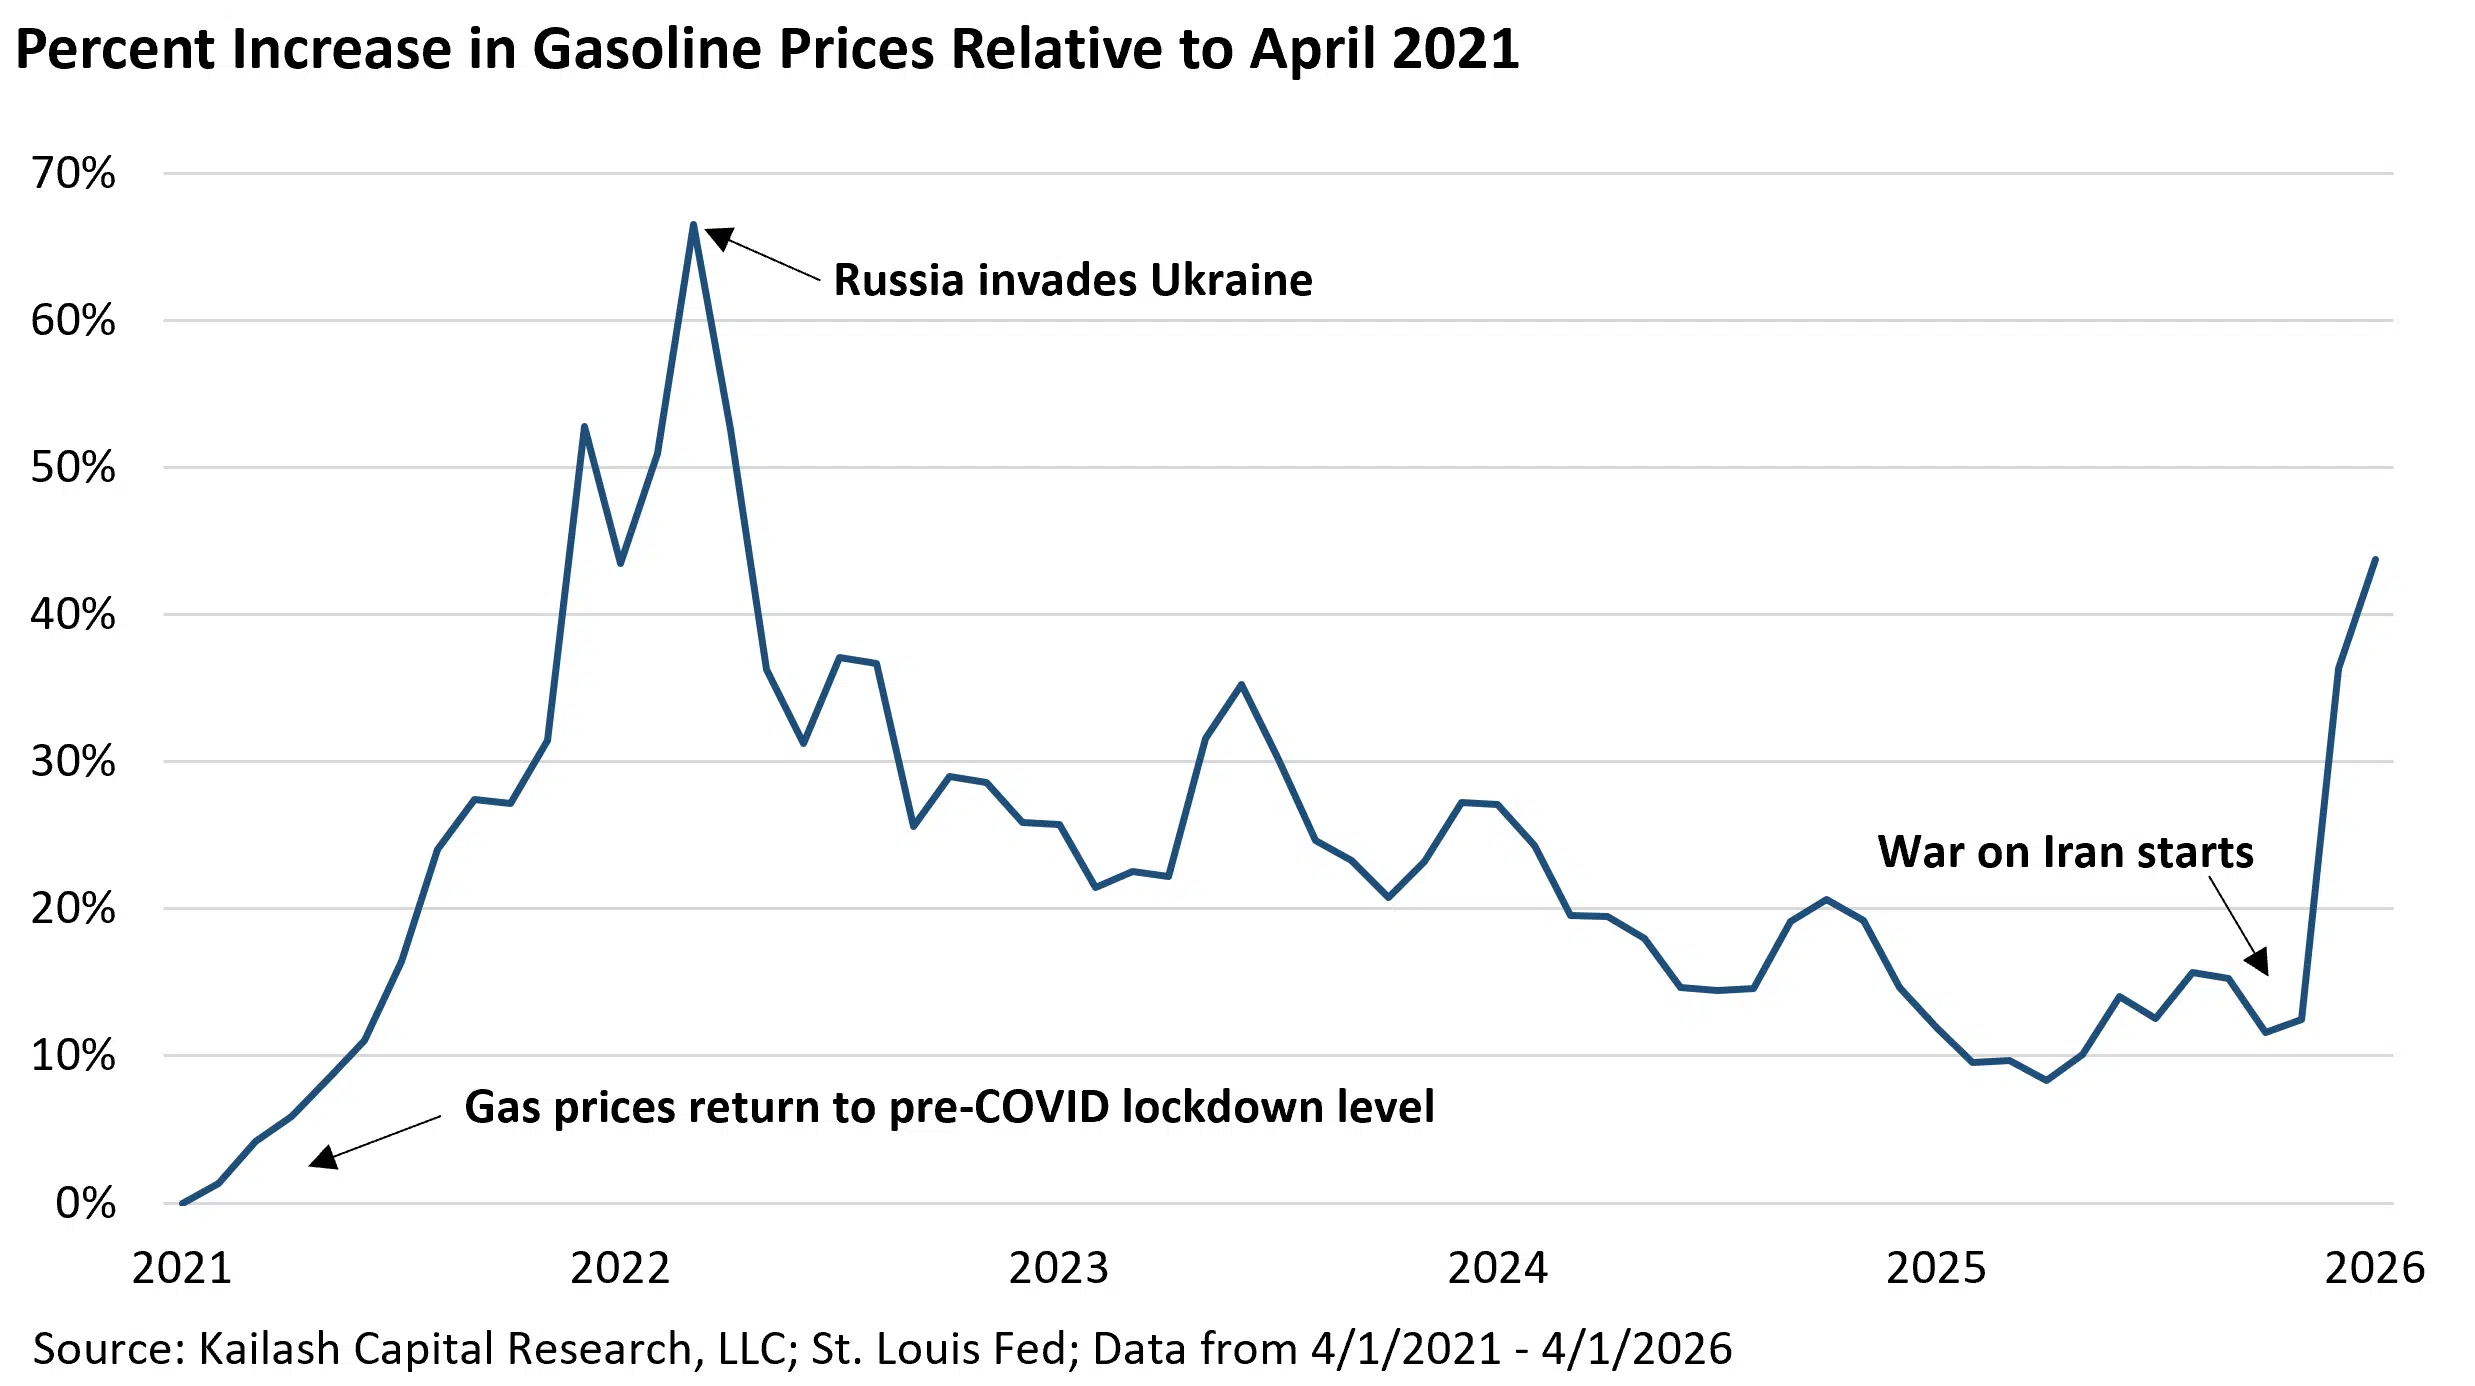
By April 2021, gasoline prices had returned to pre-COVID lockdown levels. After that, the average price at the pump rose steadily, spiked when Russia invaded Ukraine, then fell back down. Recently, the U.S. military actions against Iran that closed the Strait of Hormuz have pushed prices roughly 44% higher than they were five years ago.
Of the $195.4 billion increase in Personal Consumption Expenditures in March 2026, $81.3bn or roughly 42% of the total was due to increased spending on gasoline and other energy goods.[19] Combine that with stagnating real wages and most consumers are not happy.
Market Drivers: Earnings Growth and the Wealth Effect
As noted above, the stock market has been pushing higher largely based on expectations for tech sector profits, driven by AI. Earnings growth for the S&P 500 in Q1 2026 was just over 28%. [20] That’s the highest growth rate since Q4 of 2021.
That keeps stock prices moving higher, feeding back into that wealth effect that is buoying spending by wealthy households. So, the stock market is rising as earnings grow and consumer spending looks healthy, in aggregate, due to the wealth effect, yet consumer sentiment is at a new low. It actually all fits together.
Sector-by-Sector Earnings Impact
How might these offsetting macroeconomic forces impact earnings growth in different sectors in the stock market?


Disclaimer
The information, data, analyses, and opinions presented herein (a) do not constitute investment advice, (b) are provided solely for informational purposes and therefore are not, individually or collectively, an offer to buy or sell a security, (c) are not warranted to be correct, complete or accurate, and (d) are subject to change without notice. Kailash Capital Research, LLC and its affiliates (collectively, “KCR”) shall not be responsible for any trading decisions, damages, or other losses resulting from, or related to, the information, data, analyses or opinions or their use. The information herein may not be reproduced or retransmitted in any manner without the prior written consent of KCR. In preparing the information, data, analyses, and opinions presented herein, KCR has obtained data, statistics, and information from sources it believes to be reliable. KCR, however, does not perform an audit or seek independent verification of any of the data, statistics, and information it receives. KCR and its affiliates do not provide tax, legal, or accounting advice. This material has been prepared for informational purposes only and is not intended to provide, and should not be relied on for tax, legal, or accounting advice. You should consult your tax, legal, and accounting advisors before engaging in any transaction.
Nothing herein shall limit or restrict the right of affiliates of KCR to perform investment management or advisory services for any other persons or entities. Furthermore, nothing herein shall limit or restrict affiliates of KCR from buying, selling, or trading securities or other investments for their own accounts or for the accounts of their clients. Affiliates of KCR may at any time have, acquire, increase, decrease, or dispose of the securities or other investments referenced in this publication. KCR shall have no obligation to recommend securities or investments in this publication as a result of its affiliates’ investment activities for their own accounts or for the accounts of their clients.
© 2026 Kailash Capital Research, LLC – All rights reserved.
June 5, 2026 |
| Authors: Matthew Malgari, Nathan Przybylo, Dr. Sanjeev Bhojraj and John Durkin
June 5, 2026
Authors: Matthew Malgari, Nathan Przybylo, Dr. Sanjeev Bhojraj and John Durkin