

Earlier this month, in The High Price of Promises in SpaceX, we did two things:
- Walked through the impossible math behind SpaceX’s valuation
- Documented an almost unbelievable number of broken promises and misleading statements from SpaceX’s CEO on just the most recent Tesla earnings call
The most succinct comment in the paper was buried on page two:
Get our insights direct to your inbox: SUBSCRIBE
The same organization that cannot achieve meaningful utilization on its own GPUs, cannot network its own data centers, and cannot lawfully energize the ones it has, is being valued on the premise that it will manufacture, launch, station-keep, and operate a million-satellite compute fleet within thirty-six months.
Now note what is absent from the charts below. SpaceX — roughly $2 trillion of market capitalization on $18.67 billion of revenue and $9 billion of cash losses — is in none of them. At better than 100x trailing sales, it would enter the list of America’s thirty largest companies as far and away its most expensive member.
So every record that follows was set without it. What you are about to see is the market as it looked before the most promotional large-cap valuation in the country gets added to the count. The arithmetic deteriorates from here without a single tick in anyone’s share price.
That is the broader condition of America’s public equity market — an issue that grows larger, more destabilizing, and higher risk by the month.
Three charts, one question: what are you actually holding when you hold the market?
- Price to sales. The 30 largest U.S. stocks trade at 6.2x sales, after touching 6.8x in May. The dot-com peak was 5.0x.
- Share of market value. Those 30 names are 48% of all U.S. market capitalization. The prior record was 39.7%, set in September 2001 — roughly ten points lower.
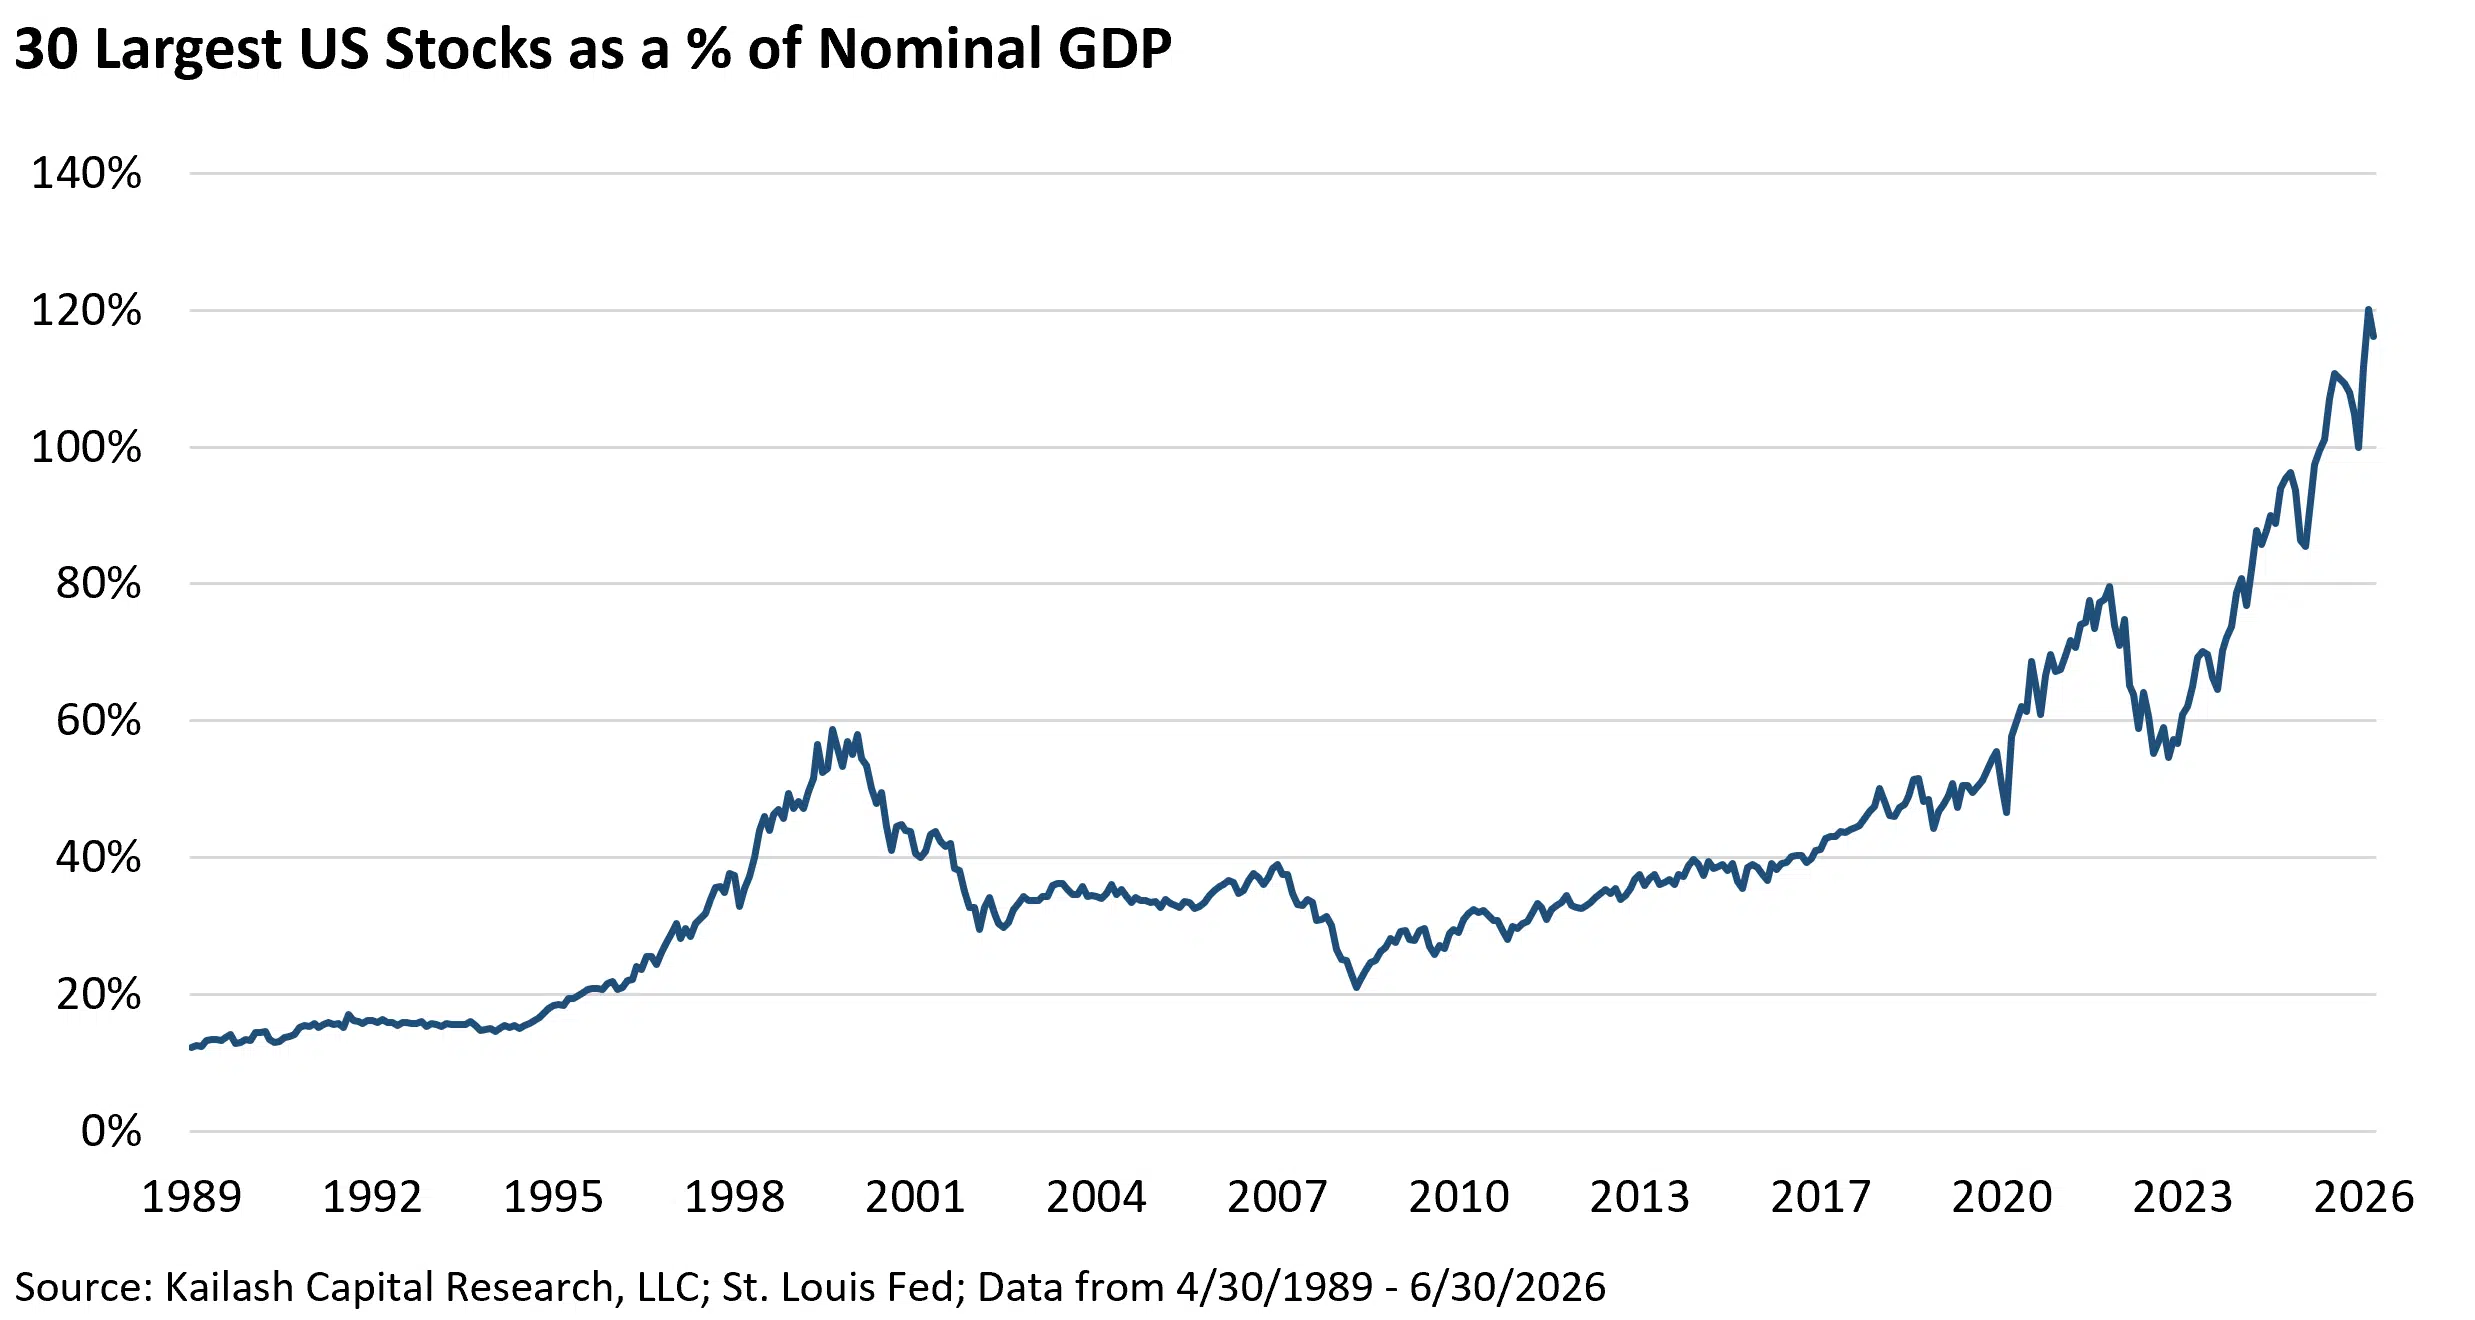
- Share of the economy. They are worth 116% of nominal GDP, against 59% at the 2000 peak. Twice the extreme, on the same measure.
Each is a different lens on the same fact: an unprecedented share of American savings sits in a small number of companies priced for promises rather than results. These are the readings on the way in, with the market’s most extravagant promise still waiting at the door.
There is no theoretical limit on investors’ gullibility or Wall Street’s promotional cupidity. With a bonanza of new equity issuance on the make via expiring lockups and fresh IPO activity, we think the risks continue to accrue to the detriment of Financial Advisors and investors in U.S. indexes.
Valuation for the 30 largest U.S. stocks swings hard. Extremes never last. Valuations today are at the most extreme high on record – going higher once we include SpaceX.
Troughs are around 1x sales. That multiple may seem impossible. It is not.

For three decades the 30 largest stocks made up 28–40% of total U.S. market value. Since 2023 that share has jumped to 48%, roughly 10 points above the prior record of 39.7% set in September 2001. Buy an index fund today and half your money rides on 30 stocks trading at the richest multiples in modern history.

Relative to the economy, the top 30 have never been larger. Their value ran from 12% of nominal GDP in 1989 to 59% at the 2000 peak, fell to 21% in 2009, then doubled since late 2022 to 116% today. That is twice the dot.com extreme. Going higher when we add SpaceX.
The table below shows the basic fundamentals of two groups:
- Top Row: the 30 US stocks with the largest market without the inclusion of SpaceX
- Bottom Row: the S&P 500 excluding the 30 largest stocks – these are the fundamentals of the “S&P 470”
The conclusions are as simple as they are startling:
- The 30 largest trade at 50x free cash flow (1% FCF ex SBC/EV) – a 200% premium to the S&P 500 excluding the 30 largest stocks, shown in the second row, which trades at a 3% FCF Yield ex SBC.
- They also trade at a 143% premium to the broad market ex the top 30 based on price to sales (5.6x divided by 2.3x = 143%)
- The top 30 are also ~70% more volatile than the rest of the index with a beta of 1.5 vs 0.9
- On Price to Earnings we see that both groups trade at roughly the same multiple (29x vs. 25x) and that the top 30 have net margins that are twice as high as the rest of the index (34% vs. 17%) with higher sales growth (179% vs. 30%). Why doesn’t that matter?
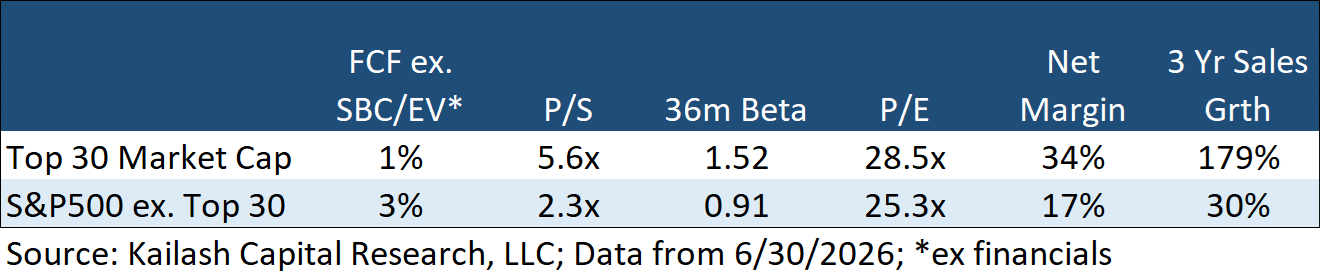 The higher margins and similar PE ratios are meaningless in the face of a 1% FCF yield – these traits – including the impossibly high growth expectations – have already been baked into the price.
To repeat our comments above: the 30 largest market cap stocks in the US trade at a 100% to 143% premium to the next 470 stocks.
In the table below we show the 30 US stocks with the largest market cap highlighted in this paper. In order of appearance from left to right:
- KCR’s Agg Score – how the stock scores on our internal metrics – higher percentages are better
- Ticker & Company Name
- Market Cap
- Free Cash Flow ex Stock Based Compensation (SBC) to Enterprise Value (FCF ex SBC/EV)
- Price to Sales ratio (P/S)


Disclaimer
The information, data, analyses, and opinions presented herein (a) do not constitute investment advice, (b) are provided solely for informational purposes and therefore are not, individually or collectively, an offer to buy or sell a security, (c) are not warranted to be correct, complete or accurate, and (d) are subject to change without notice. Kailash Capital Research, LLC and its affiliates (collectively, “KCR”) shall not be responsible for any trading decisions, damages, or other losses resulting from, or related to, the information, data, analyses or opinions or their use. The information herein may not be reproduced or retransmitted in any manner without the prior written consent of KCR. In preparing the information, data, analyses, and opinions presented herein, KCR has obtained data, statistics, and information from sources it believes to be reliable. KCR, however, does not perform an audit or seek independent verification of any of the data, statistics, and information it receives. KCR and its affiliates do not provide tax, legal, or accounting advice. This material has been prepared for informational purposes only and is not intended to provide, and should not be relied on for tax, legal, or accounting advice. You should consult your tax, legal, and accounting advisors before engaging in any transaction.
Nothing herein shall limit or restrict the right of affiliates of KCR to perform investment management or advisory services for any other persons or entities. Furthermore, nothing herein shall limit or restrict affiliates of KCR from buying, selling, or trading securities or other investments for their own accounts or for the accounts of their clients. Affiliates of KCR may at any time have, acquire, increase, decrease, or dispose of the securities or other investments referenced in this publication. KCR shall have no obligation to recommend securities or investments in this publication as a result of its affiliates’ investment activities for their own accounts or for the accounts of their clients.
© 2026 Kailash Capital Research, LLC – All rights reserved.
July 31, 2026 |
| Authors: Matthew Malgari, Nathan Przybylo, Dr. Sanjeev Bhojraj and John Durkin
July 31, 2026
Authors: Matthew Malgari, Nathan Przybylo, Dr. Sanjeev Bhojraj and John Durkin
