Part 1: Another Look at the Market’s Most Stable Compounders
The market’s death spiral in 2008 and early 2009 sent the world into a panic. One KCR staffer was working out of a hotel overlooking one of the busiest container ports in the world. There was no movement.
This clear sign that economic activity had all but stopped taught many investors about the obscure but essential “letters of credit” that underpin the shipping world’s basic operation. As Ambrose Evans-Pritchard, international business editor of the Daily Telegraph would explain:
Get our insights direct to your inbox: SUBSCRIBE
Freight rates for containers shipped from Asia to Europe have fallen to zero for the first time since records began…Idle ships are now stretched in rows outside Singapore’s harbour, creating an eerie silhouette like a vast naval fleet at anchor. … It became difficult for the shippers to obtain routine letters of credit…causing goods to pile up at ports even though there was a willing buyer at the other end. –The Telegraph, January 13, 2009
We mention this not because we are forecasting it is about to happen again. We do so to remind readers that recessions, credit crises, and market corrections are features of healthy capital markets. That means inevitably, there will be bad times ahead.
When moments of economic stress occur, investors flock to safety across asset classes. In equities, some of the most reliable “safe havens” are Consumer Staples stocks. When extreme fear takes hold, Staples—often seen as boring—suddenly take on the characteristics of glamourous growth stocks. In other words, at moments of great stress, boring becomes beautiful.
Nothing tells this story better, in our view, than the chart below which shows the weighting of the Consumer Staples sector in the S&P 500 over the last 40 years. At both the trough of the dot.com correction in 2003, and the Great Financial Crisis (GFC) in 2009, Staples stocks weighting in the S&P 500 index soared, while other sectors collapsed. In other words, when things got rough, investors found few things more appealing than reliable profits! Sometimes it really is this simple.
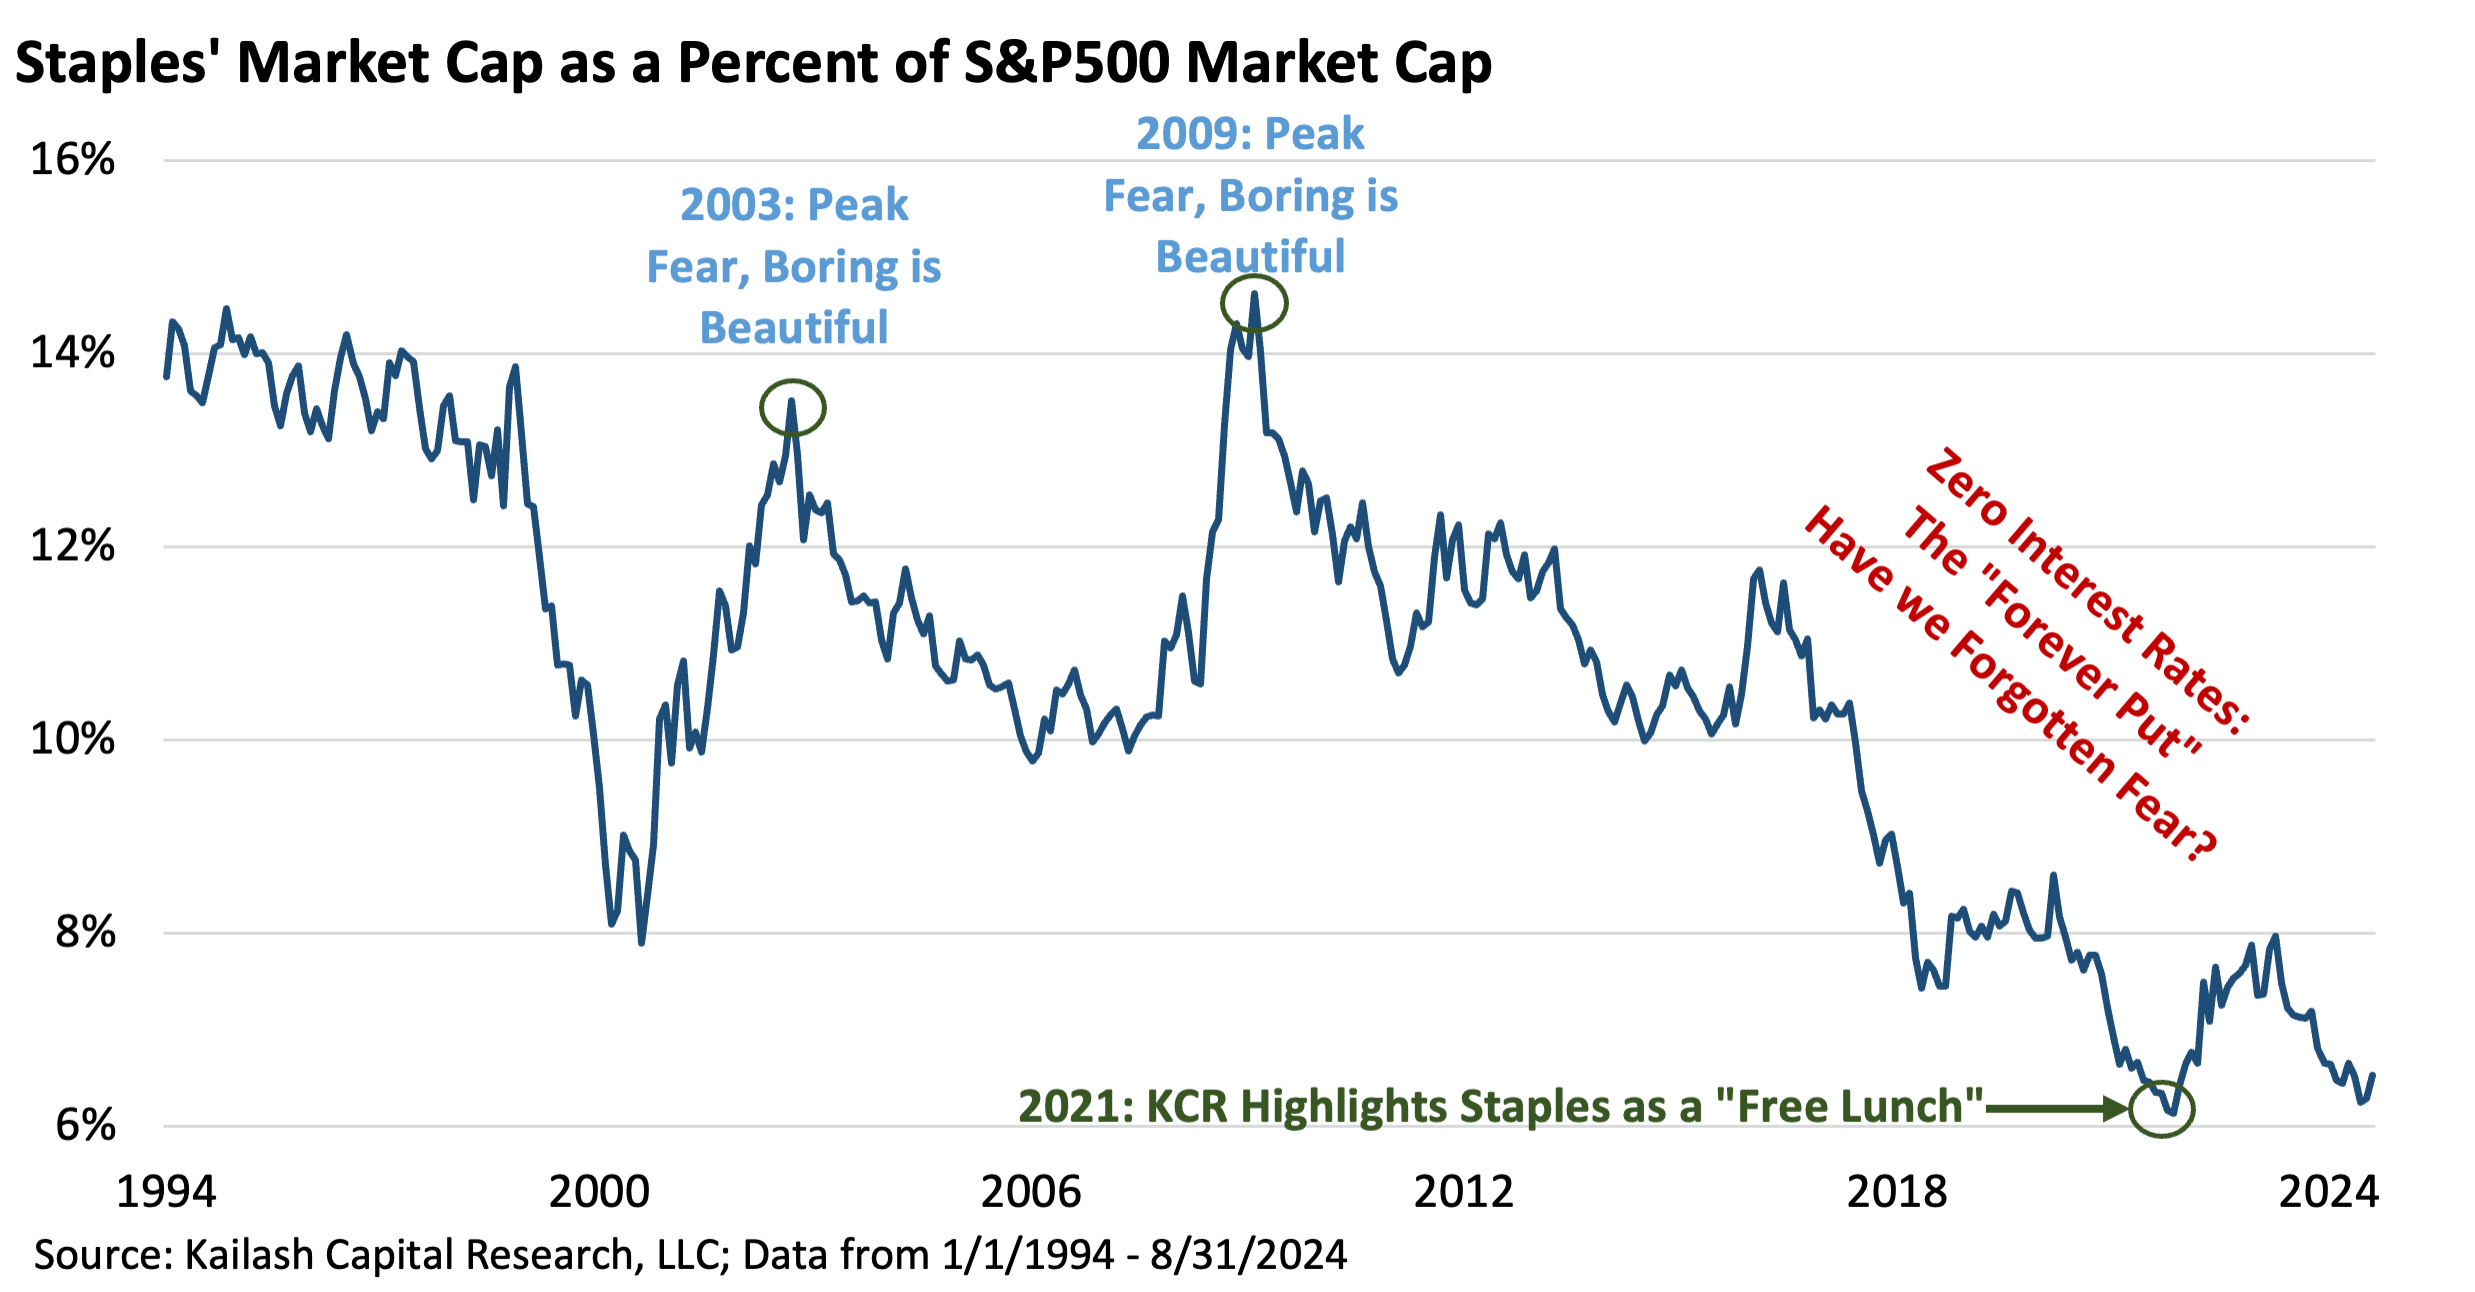
But ever since the GFC’s bottom in 2009, the total market value of the Staples sector as a percent of the S&P 500 has been shrinking. The Zero Interest Rate Policy (ZIRP) era that led to the greatest speculative mania in the U.S. stock market since the Roaring 20’s has sent investor interest in Staples to all-time lows.
Investors felt the urge to speculate grow ever stronger with risk free rates near 0%. Not only was money cheap, but people came to believe the government would immunize investors from economic catastrophe.
The most potent lesson was obviously Covid. As much of the world shut down, US GDP plummeted by 3x as much as during the Great Financial Crisis. [1]
Yet stocks declined for only 23 days before spiking higher.
But holding Staples stocks is not just about avoiding risk. As the navy-blue bars in the chart below show, over the last 30-years, Staples delivered annualized returns of 11% – higher than all but Healthcare and IT. Looking at the light blue bars, or standard deviation (RHS), Consumer Staples achieved these returns with the lowest risk of any sector. The best risk adjusted returns are anything but boring, in our view. [2]

In 2021, we pounded the table for Staples, noting they were as cheap as at the peak of the dot.com bubble and were offering investors a free lunch. In the two years after we made that call (January 7, 2021 – January 7, 2023), Staples would go on to compound investors’ capital at a 10.4% annualized rate, grinding relentlessly higher with very little drama. In contrast, the S&P 500 soared then crashed, delivering investors annualized returns of only 2.7%. [3]
Moving to today, the AI bubble has driven the S&P500 higher and it has now overtaken Staples since our original piece. Since January 7, 2021, the S&P500 has risen 12.9% on an annualized basis. Consumer Staples have continued to deliver robust absolute returns of 10.5% a year with a fraction of the volatility.[4]
A potentially simpler way to think about Staples is presented in the chart below. That line shows the rolling three year returns to buying Staples stocks. Over 30+ years, if you randomly bought the Staples ETF on any given month, you only lost money twice. In all other rolling three-year returns, you made solid money.

The chart below is powerful evidence of the rare opportunity before us. Let’s walk through it carefully:
• The line shows the percent of stocks in the S&P 500 that are more expensive than Consumer Staples
• So when the line is very high, like at the peak of the dot.com bubble in 1999 and 80% of stocks were more expensive than Staples, they offer uncommon value.
• Conversely, you can see when the Great Financial Crisis caused markets to crash, investors piled into Staples and they became very expensive relative to the market.
Summary: When the line is high, investors are not interested in the boring but reliable returns that Staples are known for. When the line is low, it means investors are fearful and Staples have become very expensive.

Today 66% of stocks in the S&P500 are more expensive than Consumer Staples – one of the highest readings in history.
There have only been four times in history when Consumer Staples stocks have been this cheap relative to the overall market: 1999, 2013, 2017, and 2021. While we could see them continue to get cheaper relative to the market like in 1999, they may also be nearing an inflection point. Considering the robust downside protection offered by these names, we think the risk reward looks unusually compelling today.
The table of fundamentals below show that Staples now appear to be underappreciated relative to most other stocks. Comparing the top row, the S&P 500, to the second row, the Consumer Staples Sector, we can see that Staples, as a group trade at nearly a 50% discount to the index based on Free Cash Flow, Price to Sales, and Enterprise Value to Sales. And this is despite the fact they offer comparable ROEs (42% vs. 37%) with a fraction of the market’s beta.

Now look at that bottom row. Those are the fundamentals of KCR’s top 10 ranked Staples stocks. Here the numbers shoot through the roof.
• Our top picks have a FCF/EV of 5.9%, nearly double the sector and nearly 2.5x the broad index
• On P/E, KCR’s picks trade at a 50% discount to the S&P 500 (13.4x vs. 28.0x for the S&P 500)
• Even better, you are getting paid a 3.5% cash dividend yield to hold them
With the 10-Year Treasury yield down to 3.6% and offering zero inflation protection, we find our top 10 Staples stocks’ powerful cash generation, cheap valuation and robust income to be compelling.
As our prior research piece, The Great Inflation of the 1970s explained, Staples stocks have historically offered some of the safest ways to compound wealth and battle inflation. They sell things you need, rather than things you want. You might delay upgrading your smartphone but skipping toilet paper and toothpaste is not an option.
But because these traits are well understood, Staples rarely come cheap. Still, there have been times when they trade at remarkable discounts to the broader market,[5] and we have shown how those moments have made Staples extraordinary investments, offering both robust upside capture and terrific downside protection.
In the table below we show the Consumer Staples stocks, sorted by rank from best to worst, in our Large Cap Model. The top 10 picks highlighted in the bottom row of the table above are in bold.
In Part 2, we will look at why Consumer Staples are particularly compelling when compared to the IT sector and highlight the tech stocks we think look most vulnerable to our models today.


Disclaimer
The information, data, analyses, and opinions presented herein (a) do not constitute investment advice, (b) are provided solely for informational purposes and therefore are not, individually or collectively, an offer to buy or sell a security, (c) are not warranted to be correct, complete or accurate, and (d) are subject to change without notice. Kailash Capital Research, LLC and its affiliates (collectively, “KCR”) shall not be responsible for any trading decisions, damages, or other losses resulting from, or related to, the information, data, analyses or opinions or their use. The information herein may not be reproduced or retransmitted in any manner without the prior written consent of KCR. In preparing the information, data, analyses, and opinions presented herein, KCR has obtained data, statistics, and information from sources it believes to be reliable. KCR, however, does not perform an audit or seek independent verification of any of the data, statistics, and information it receives. KCR and its affiliates do not provide tax, legal, or accounting advice. This material has been prepared for informational purposes only and is not intended to provide, and should not be relied on for tax, legal, or accounting advice. You should consult your tax, legal, and accounting advisors before engaging in any transaction.
Nothing herein shall limit or restrict the right of affiliates of KCR to perform investment management or advisory services for any other persons or entities. Furthermore, nothing herein shall limit or restrict affiliates of KCR from buying, selling, or trading securities or other investments for their own accounts or for the accounts of their clients. Affiliates of KCR may at any time have, acquire, increase, decrease, or dispose of the securities or other investments referenced in this publication. KCR shall have no obligation to recommend securities or investments in this publication as a result of its affiliates’ investment activities for their own accounts or for the accounts of their clients.
© 2023 Kailash Capital Research, LLC – All rights reserved.
September 19, 2024 |
| Authors: Matthew Malgari, Nathan Przybylo, Dr. Sanjeev Bhojraj and John Durkin
September 19, 2024
Authors: Matthew Malgari, Nathan Przybylo, Dr. Sanjeev Bhojraj and John Durkin