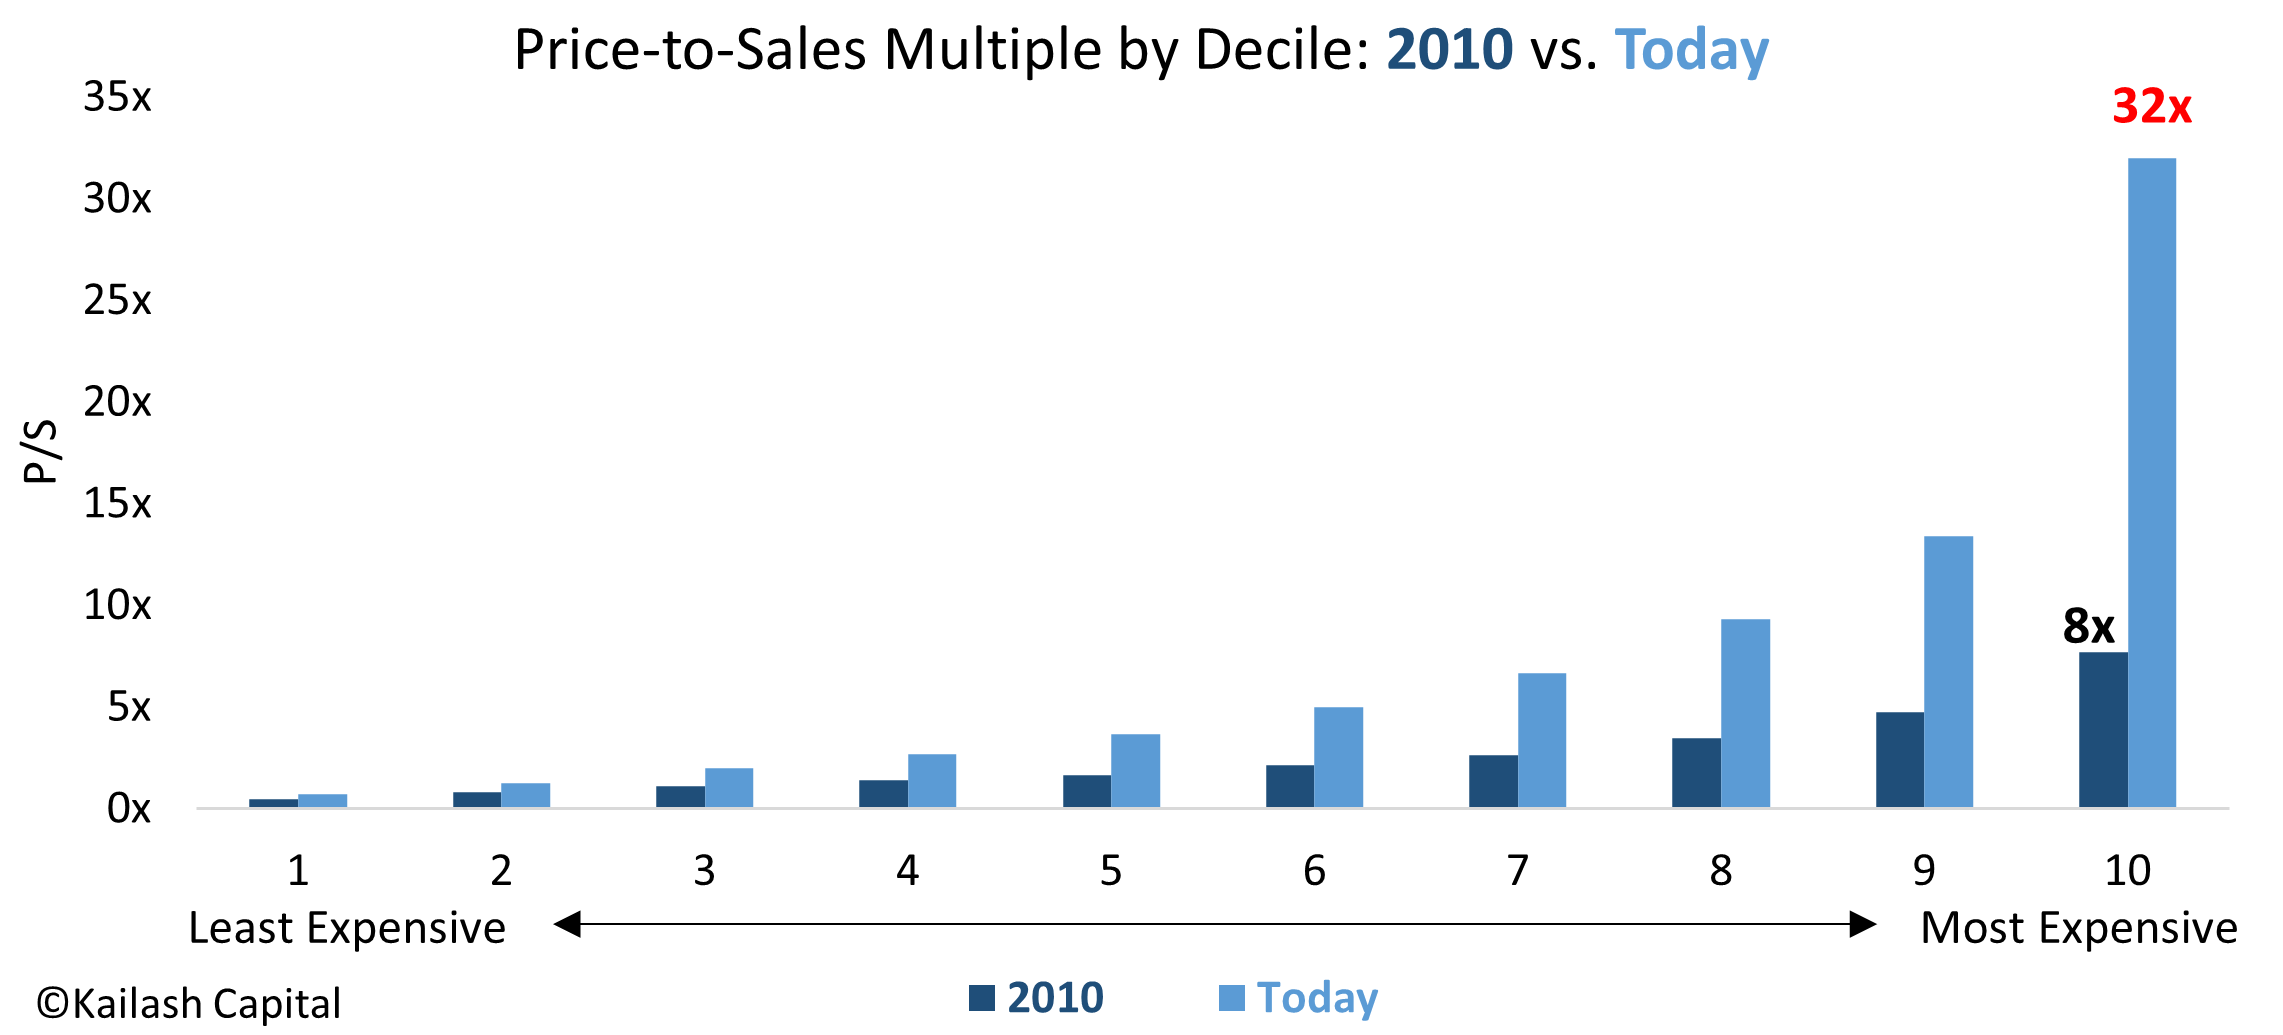
Multiple Expansion: A Tale of Two Markets
- The NAVY BLUE BARS show the price-to-sales ratio of stocks in 2010 by decile, from least to most expensive
- The LIGHT BLUE BARS show the price-to-sales ratio of stocks TODAY by decile, from least to most expensive
- While stocks are generally more expensive today than in 2010, the market’s most expensive stocks trade at a staggering 32x revenues today – a 400% increase from where they were in 2010
- Consistent with common-sense and as documented in our papers “From Brilliant to Brain Dead” and “IPO Stocks are the New Staples”, paying 32x sales for a company is a highly speculative endeavor
- For investors looking for high quality firms trading at reasonable prices that offer healthy income, see our recent papers on high quality midcaps and consumer staples
Get our insights direct to your inbox: SUBSCRIBE
Get our White Papers direct to your inbox: SUBSCRIBE


FAQ’s: Some Basics for Beginners
What is Multiple Expansion? A Simple Definition of Multiple Expansion
Multiple expansion is when the valuation of a stock rises faster than the stock’s fundamental value. In recent years this has been one of the primary drivers of stock returns – particularly in more speculative stocks like the one’s in the 10th decile above. Let’s use a simple example to help make this easy.
Examples of Multiple Expansion:
One of the best ways to understand and explain multiple expansion is to use a real-world example. For our purposes in this post we will use the Covid darling Zoom Video Communications, ticker ZM. On January 31, 2020, Zoom’s market capitalization – the value of the firm’s equity – was $21.2bn dollars and the stock had trailing 12 month sales of $2.6bn dollars. That meant that Zoom was trading at just over 8x price to sales (P/S) which can be found by taking $21.2bn market cap and dividing it by the $2.6bn in sales ($21.2/$2.6 = 8.15x).
Fast forward a year later to January 31, 2021 and the stock price had exploded higher which sent Zoom’s market cap from $21.2bn to $109.2bn dollars – a 415% increase! Over that same year, the company’s sales grew significantly, rising from $2.6bn in 2021 to $4.12bn, or 57%. You can see what happened: the increase in the stock price drove Zoom’s market cap up 415% while sales grew only 57%. Now you Zoom’s price to sales multiple had gone 8.15x in 2020 to 26.6x by January of 2021! The 26.6x price to sales figure is just calculated by dividing the new market cap of $109.2bn by the new sales of $4.12bn.
You can see the massive valuation expansion took the stock from 8.15x to 26.6x. While the firm’s sales did grow, the expansion value was much greater than the increase in the company’s fundamental growth. This type of behavior is a sign that investors went from very optimistic about Zoom (8.15x sales is already very expensive!) to wildly optimistic about Zoom and the stock experienced massive valuation expansion which causes multiple expansion.
How to Get Multiple Expansion:
There is no sure-fire method for a stock to create multiple expansion. Very simplistically, multiple expansion happens when investors become more optimistic about a stock’s prospects. That optimism manifests itself in the stock price rising faster than any improvement in fundamentals. Stocks that experience multiple expansion are, by definition, becoming more expensive. The math on this is fairly unforgiving. The more you pay for any given asset or future stream of cash flows, the lower your future returns will be.
With that said, things like durable margin expansion can be powerful drivers of multiple expansion. To take an extreme example, let’s look at Halliburton (HAL) as an example. Halliburton provides engineering and construction and equipment for the energy industry. When Covid hit oil prices plunged into negative territory. Needless to say, there was hardly any demand for Halliburton’s products. In 2018 HAL earned $1.6bn in net profit margins on $24bn in sales. In 2020 with orders collapsing and the energy industry in total disarray, HAL’s sales collapsed from $24bn in 2018 to only $14bn in 2020 and the stock’s net profit margins imploded. In 2020 the stock lost -$2.9bn in net income creating a negative profit margin.
Uncertain about the length of a novel virus people did not understand, HAL’s multiple collapsed as investors feared the company would lose money for a long time and some thought it could go bankrupt. Fast forward a year and the firm’s sales recovered, the company cut costs and they went from negative to positive net profit margins. This massive increase in margins – going from negative to positive – also caused the stocks price to sales multiple to increase by 20% from 1.1x in 2020 to 1.35x in 2021.
Multiple Expansion in Private Equity: An Extreme Example
Private Equity provides probably one of the most extreme examples of multiple expansion in today’s markets and we have written a fair bit on this. Many private equity firms have seen large inflows from investors who have watched as these firms, which often use large amounts of leverage, have benefitted from relentlessly falling interest rates, weaker covenants and the ability to price the securities via various methods outside of daily liquid markets like the New York Stock Exchange and NASDAQ.
With cheap and easy-to-get debt funding and vast inflows from investors, private equity firms have the blessing and curse of “lot’s of money chasing a finite group of assets.” This has created extreme multiple expansion. We wrote an entire piece that documents what we believe is the unsustainable multiple expansion that has gone one in the sector. Titled Debt to EBITDA Ratios: The Spiral Higher Continues our work leaned on material from S&P Global Market Intelligence, the law firm White & Case’s superb work as well as work from UNC’s Business School. This post from Investopedia will be particularly helpful as a basic primer and this article from Forbes , The Alchemy of Private Equity to be equally impressive. The Forbes piece in particular is fantastic as it explains the three primary drivers of Private Equity returns and highlights how multiple expansion plays an integral role in generating returns for investors.
Longtime readers of our work know that our team is very skeptical of the recent bout of speculative fervor. We believe there are pockets of this market where multiple expansion has gone to extremes that will lead to terrible losses for investors. We are, once again, hearing the “this time it is different” narrative that is common during market manias.
In period’s like today investors tend to commit costly behavioral errors. Those mistakes are what make inefficient markets and why we advocate relentlessly for pursing a margin of safety. We believe with valuations this elevated the importance of bear trading strategies has never been higher.
Disclaimer
The information, data, analyses, and opinions presented herein (a) do not constitute investment advice, (b) are provided solely for informational purposes and therefore are not, individually or collectively, an offer to buy or sell a security, (c) are not warranted to be correct, complete or accurate, and (d) are subject to change without notice. Kailash Capital Research, LLC and its affiliates (collectively, “Kailash Capital Research, LLC ”) shall not be responsible for any trading decisions, damages or other losses resulting from, or related to, the information, data, analyses or opinions or their use. The information herein may not be reproduced or retransmitted in any manner without the prior written consent of Kailash Capital Research, LLC . In preparing the information, data, analyses, and opinions presented herein, Kailash Capital Research, LLC has obtained data, statistics, and information from sources it believes to be reliable. Kailash Capital Research, LLC , however, does not perform an audit or seeks independent verification of any of the data, statistics, and information it receives. Kailash Capital Research, LLC and its affiliates do not provide tax, legal, or accounting advice. This material has been prepared for informational purposes only and is not intended to provide, and should not be relied on for tax, legal, or accounting advice. You should consult your tax, legal, and accounting advisors before engaging in any transaction. © 2021 Kailash Capital Research, LLC – All rights reserved.
Nothing herein shall limit or restrict the right of affiliates of Kailash Capital Research, LLC to perform investment management or advisory services for any other persons or entities. Furthermore, nothing herein shall limit or restrict affiliates of Kailash Capital Research, LLC from buying, selling or trading securities or other investments for their own accounts or for the accounts of their clients. Affiliates of Kailash Capital Research, LLC may at any time have, acquire, increase, decrease or dispose of the securities or other investments referenced in this publication. Kailash Capital Research, LLC shall have no obligation to recommend securities or investments in this publication as result of its affiliates’ investment activities for their own accounts or for the accounts of their clients.