We’re In the Moneyball Business, Not the Crystal Ball BusinessTM Continued
In our prior piece analyzing the entire cohort of companies that are net repurchasers of their own company’s stock, we highlighted how the group’s aggregate valuations had hit record highs. We also highlighted that the funding required to facilitate buying back stock at the highest multiples on record, were being funded by debt.
Get our insights direct to your inbox: SUBSCRIBE
As promised, today we drill into the group a bit deeper. Our goal? Find the most financially speculative repurchasers. Our method will be straightforward and simple, relying on valuation to help us winnow the field.
Longtime readers are familiar with our affinity for the simple price to sales multiple as a sorting feature. We like it for two reasons:
- The numerator is rarely negative, avoiding common headaches with price to earnings and others
- When a company’s market cap is at or above 10x sales, the valuation makes the investment case almost purely speculative as we have explained again and again
The chart below shows the price to sales ratio of the 20% most-expensive companies that are buying back stock. As the chart below shows, the most expensive quintile is buying back stock at 13x sales. The only time in history that number has been higher was at the prior peak in 2021 when they hit an incredible 15x sales. As you can imagine…the shift from “risk on” in 2021 to “risk off” in 2022 crushed these stocks with their multiple falling by nearly 50%, from 15x to 8x. Quite the vulnerability, no?

To each their own. We see the endless prattling by pundits trying to parse out if this is the “sixth, seventh, or eighth inning.” To which we wish their acolytes the best of luck.
Loving reminder: you don’t get extra credit for difficulty.
In the most recent trailing 12 months, the total group of net repurchasers we highlighted in Part I of the series bought back just over $1 trillion of their own stock. We took the group and broke out how much of that $1 trillion of stock buybacks was purchased in each quintile of valuation.
The first bar on the left, the cheapest 20% of net repurchasers, bought back $152 billion. In contrast, look at the right-most bar. The most expensive quintile of net repurchasers that are trading, per the chart on the prior page, at 13x sales. That 20% of companies blew $406 billion buying back their own stock.

Let’s walk through it again:
Looking at the first four bars from left to right, that represents 80% of the companies that are net repurchasers of their own stock. Combined, all 80% of these companies bought back just over $600 billion of their stock. The last bar on the right, the most expensive 20%, bought back $406 billion.
So the most expensive 20% represents 40% of all the dollars spent buying back stock. The most expensive companies in the market are also the most aggressive at buying back their shares. $406 billion of equity owners’ capital went not to fortifying their economic moat nor fortifying balance sheets for a rainy day, but instead to paying 13x sales to buy in their stock.
This strikes us as painfully foolish. Particularly when we look at when these management teams decided to stomp on the buyback pedal. The chart on the following page tells an unforgiving story.
These high priced repurchasers were not buying-in particularly aggressively in 2021 (smart) or 2022 when their stocks plunged to the still heady 8x sales. Instead their buyback programs went into parabolic mode only recently. The repurchases in the post 2022 period have been entirely pro-cyclical. Sheer madness in our view.

We want to assure our readers that these high price to sales multiples are not hiding prodigious cash-flows relative to firm value. The chart below shows that based on free cash flow to enterprise value (“FCF/EV”), the most expensive quintile of repurchasers has officially matched their unfortunate peers at the peak of the dot.com bubble. For context: a 1.6% FCF Yield = 63x FCF. That’s a lot of optimism with no precedent for success.

Post the dot.com peak, these names were destroyed. Maybe it will be different this time?
For those of you who think they can forecast who will make money off AI, we admire your conviction. But our team takes a very “get on base” approach to investing. As we like to say, We’re In the Moneyball Business, Not the Crystal Ball BusinessTM – we strive to be the “card counters of the stock market.” This of course is not a perfect analog, as card counting with a finite number of decks has bounded probabilities.
Human emotions? No such thing. Instead, our appetite to repeat the mistakes of the past with reckless abandon is entirely subjective.
Nobody would be quicker to tell you that a stock priced at a foolish valuation that is hostile to future returns, can go higher. In theory – there is no price too high. As our firm has proven, even in a market environment that is valuation agnostic, fed by hype, leverage, and retail speculation, our processes endure.
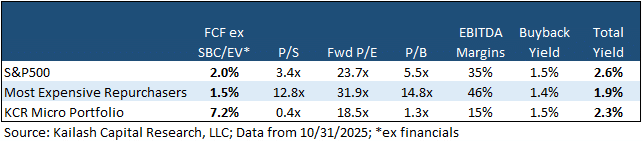
For those willing to avoid the enticing narratives that have driven some speculatively valued stocks to extremes, we present the table below. The three rows below show some basic fundamental data for the S&P500, the most expensive net repurchasers in the S&P500 and KCR’s Micro Portfolio. As we pointed out earlier, the most expensive repurchasers barely have enough FCF to cover these repurchases and when including dividend (total yield), a portion must be covered with debt. Factoring in the 13x multiple these firms are paying to repurchase their stock seems highly precarious.
On the contrary, we have been pounding the table on the tremendous opportunities we see in the Micro Cap space. KCR’s Micro Cap portfolio identifies this opportunity by purchasing firms trading at tremendous discounts, that pay you to own them.
For a list of the most expensive net repurchasers with a buyback yield greater than 1%, please see the following page.


Disclaimer
The information, data, analyses, and opinions presented herein (a) do not constitute investment advice, (b) are provided solely for informational purposes and therefore are not, individually or collectively, an offer to buy or sell a security, (c) are not warranted to be correct, complete or accurate, and (d) are subject to change without notice. Kailash Capital Research, LLC and its affiliates (collectively, “KCR”) shall not be responsible for any trading decisions, damages, or other losses resulting from, or related to, the information, data, analyses or opinions or their use. The information herein may not be reproduced or retransmitted in any manner without the prior written consent of KCR. In preparing the information, data, analyses, and opinions presented herein, KCR has obtained data, statistics, and information from sources it believes to be reliable. KCR, however, does not perform an audit or seek independent verification of any of the data, statistics, and information it receives. KCR and its affiliates do not provide tax, legal, or accounting advice. This material has been prepared for informational purposes only and is not intended to provide, and should not be relied on for tax, legal, or accounting advice. You should consult your tax, legal, and accounting advisors before engaging in any transaction.
Nothing herein shall limit or restrict the right of affiliates of KCR to perform investment management or advisory services for any other persons or entities. Furthermore, nothing herein shall limit or restrict affiliates of KCR from buying, selling, or trading securities or other investments for their own accounts or for the accounts of their clients. Affiliates of KCR may at any time have, acquire, increase, decrease, or dispose of the securities or other investments referenced in this publication. KCR shall have no obligation to recommend securities or investments in this publication as a result of its affiliates’ investment activities for their own accounts or for the accounts of their clients.
© 2025 Kailash Capital Research, LLC – All rights reserved.
November 13, 2025 |
| Authors: Matthew Malgari, Nathan Przybylo, Dr. Sanjeev Bhojraj and John Durkin
November 13, 2025
Authors: Matthew Malgari, Nathan Przybylo, Dr. Sanjeev Bhojraj and John Durkin