In Part I of our work on Consumer Staples stocks we provided data demonstrating that:
1. Staples stocks had generated the highest risk adjusted return of any sector over the last 30 years
2. That relative to the S&P500 Staples were as cheap as they were at
a. The peak of the dot.com bubble and
b. The peak of the Covid bubble – moment when we pounded the table on Staples on Staples to great effect
3. Investor interest in Staples’ reliable earnings and income features had fallen to never before-seen lows
Get our insights direct to your inbox: SUBSCRIBE
In Part 1 we led with the below chart featuring only the navy-blue line which shows the weight of Staples stocks in the S&P500 had hit the all-time lows last seen at the peak of the Covid bubble.
Today, we have added the light blue line showing Technology’s weight in the S&P 500 today is just shy of its prior peak in the dot.com mania.
In the roughly two years since ChatGPT was launched, the AI frenzy has sent the Tech sector’s weighting in the index soaring. Morningstar reports that through the third week of July, Tech funds had pulled in ~7x more cash than any other sector. For those of us with a few gray hairs, this movie is neither new nor complicated.
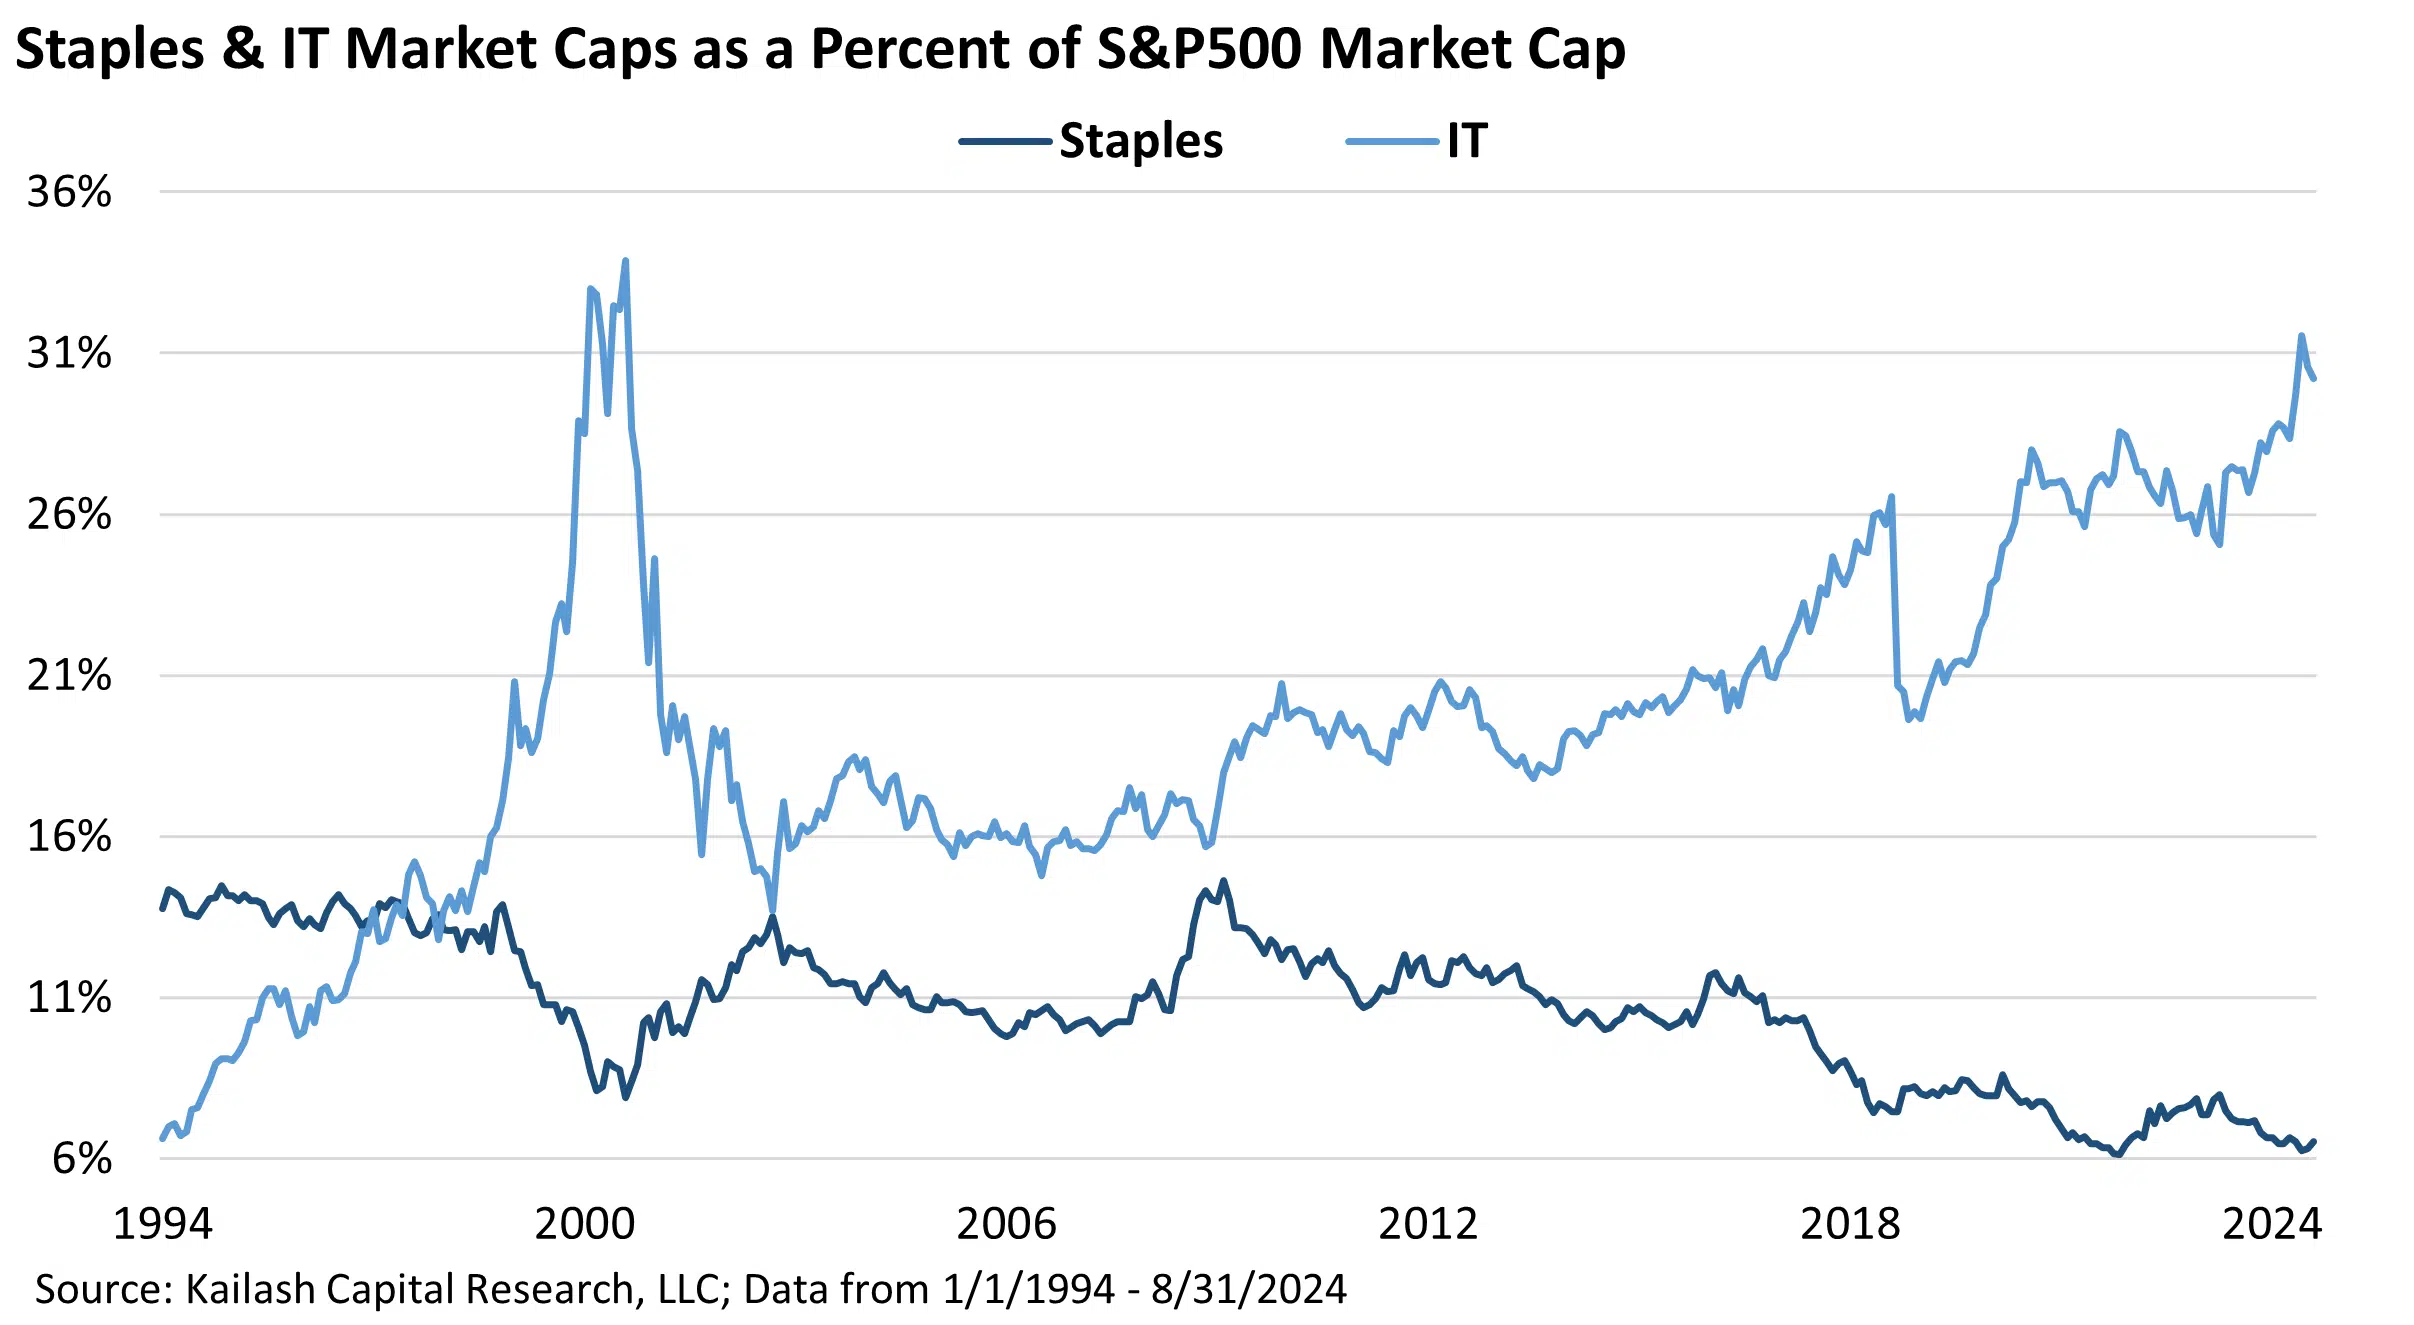
KCR is certain we cannot time markets. But we can use data to help identify areas of excessive optimism and pessimism. Looking at the chart above, the data that follows is as compelling as it is obvious: what you pay matters, and rarely have you had to pay less for some of the market’s most stable earning companies.
Gentle reminder: you cannot eat AI. In contrast, Consumer Staples companies make the products you know and need. In Apple, Coke, Tesla, WorldCom & Warren Buffett, we reminded readers that Tech darlings like Apple were now facing ruthless foreign competition for the first time. Delaying the upgrade of your next iPhone is not hard. In contrast, toilet paper, toothpaste, and food are essential. We’d also suggest that quitting nicotine is no small feat – although one KCR staffer did indeed put the coffin nails down after his misspent youth.
The chart below shows the price to sales multiples of every sector at three key points in time:
• Light blue Diamonds -1984: when the equity-crushing headwinds of inflation finally broke
• Navy Blue Squares – December 2022: we chose this date as it was after the market fell -18.13% from the December 2021 high, which had shattered the valuation peak last seen in the dot.com bubble
• Red Circles – Today: this helps us see where the outliers are and the message is simple – nowhere has there been more multiple expansion than in tech which now trades at 9x sales.

A Macro Moment: A Forecast Free & Fact Rich Digression
In the article where we first published this chart, we noted, “the inflation of the 1970s teaches us to invest in firms that provide what people need and avoid companies that sell items people want.” We stand by that statement.
What we do not know is if inflation will rear its head again or if a recession is imminent.
The bond market is sending us some interesting signals worth reviewing:
1. We should expect 2.5% in rate cuts to happen over the next two years [1] and
2. 10-Year Treasuries have rallied sharply, with yields falling from ~5% in October of 2023 to just 3.7% [2]
3. The market believes Fed cuts will not cause inflation to re-emerge and points to a soft-landing
Let’s say the bond market is right. Soft landing. You will not look like a hero owning reasonably priced Staples stocks with high quality earnings and healthy balance sheets in such a scenario. You’ll probably just do “OK”.
But KCR is not here for heroics. We are here to help focus people’s attention on areas where we see uncommon value. We would note the bond market is anything but infallible.
Immediately prior to the largest outbreak of inflation since the 1970s, 10-Year Treasury bonds yielded only 0.50%. That is “return-free risk.” At such valuations, Treasury bonds were a speculation – not a counterweight to equity risk.
Mathematically the bond market is healthier today. 3.66% is a much better rate of interest than 0.50%. But as many know, the US has never owed this much money in the post-World War II period.
And we cannot recall a time when there was less will – on either side of the political aisle – to do what is necessary to reign in fiscal largess. Yet bonds and stocks are sending the “all clear.” Could they be right? Sure.
One of our partners, the CIO of a large insurance company, recently expressed concern about the soaring cost of the US debt. Noting that interest expense was approaching $1tn annually, he referenced a quote from 2009 that the US was running the risk of “…essentially [becoming] an insurance company with an army.”
Let’s put that $1 trillion in interest expense in context:
We remember the fear in 2009 when our politicians spent what was then deemed an entirely untenable ~$800 billion [3] bailing out the US. In that moment, the media was filled with stories of impending doom, the collapse of the dollar, stocks were at the lowest valuations seen in a generation and Warren Buffett wrote a public opinion piece Buy American. I Am. where he made the case for US equities. How far have we strayed?
McKinsey put out a chart in June of 2020 putting the Covid bailout in context to the bailout of the Great Financial Crisis of 2009. Governments allocated $10 trillion for economic stimulus in just two months – and for some countries, their response…was ten times what it was in the financial crisis of 2008-2009.

Source: McKinsey
Years after the market bottomed in 2009, investors were still filled with fear of inflation, decided Buffett was wrong and predicted gold would be the best performing asset class for the next decade. They were wrong.
Today the situation is perfectly reversed. Now our interest expense is larger than the entire GFC bailout. Stimulus, tax cuts, and even price controls are routine parts of our political lexicon. Yet investors are fearless.
Excepting, of course, Warren Buffett and his invaluable head of insurance, Ajit Jain. Buffett has slowed Berkshire’s repurchase program as the company’s valuation hit $1 trillion. By slowing down this use of cash, Berkshire’s cash pile is approaching $300bn. Mr. Jain has sold half his shares in Berkshire.[4]
Could one of the world’s largest insurers and most accomplished investors know something we don’t? Maybe. But we recognize that for many investors and advisors, going to cash simply is not an option. Could Staples offer a stable place to park some capital in dividend paying blue chips at bargain prices?
The Power of Compounding Returns
KCR believes the simple data in this paper and Part I of this research supports such a conclusion. Tech stocks have a mix of Nifty-Fifty valuations today and are priced for perfection. They also sell goods that, in challenging times, become discretionary.
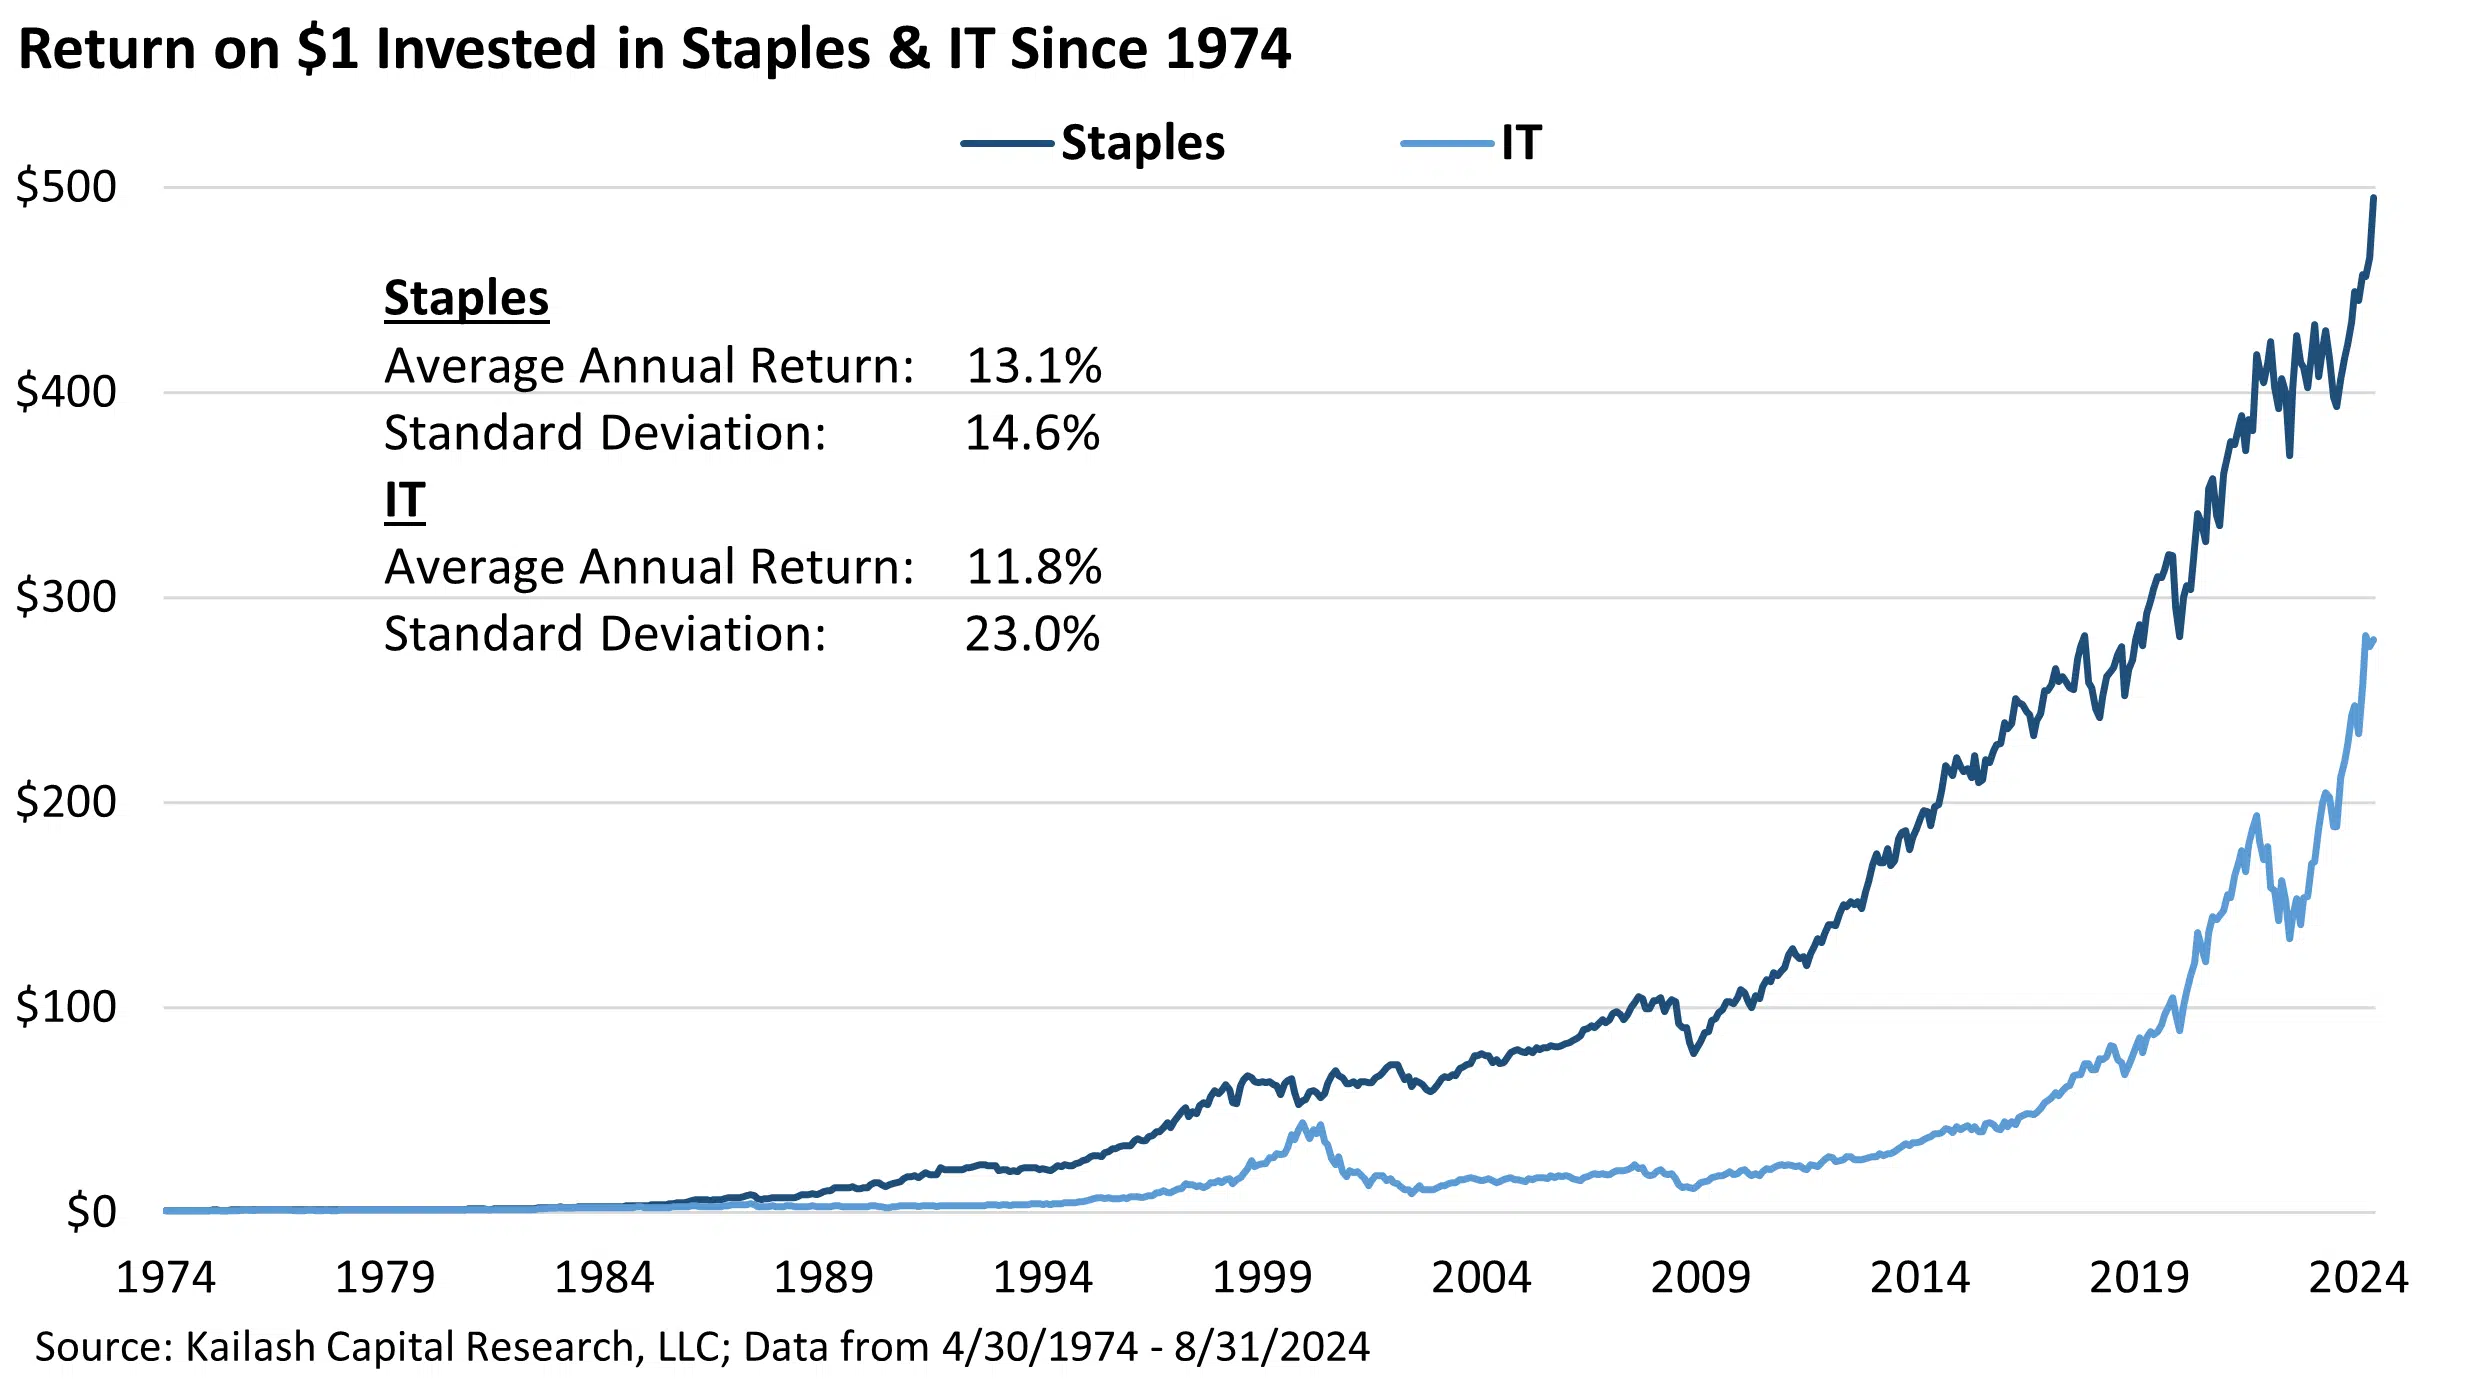
In contrast, Staples are trading at some of the lowest relative valuations in over 30 years. Purchasing these stable earners at any time has, historically, meant you have a very low chance of losing money over any three-year horizon. Even better, over the very long haul, boring Staples stocks have been compounding machines.
Over the past 50 years, which included everything from high inflation in the late-1970s-early 1980s, to the dot.com bubble, the GFC, and COVID, boring Consumers Staples beat Tech with less volatility.
Consider that when NVIDIA recently beat analysts’ estimates – but not by as much as the “whisper” number – the stock fell sharply. That correction was the equivalent of five Kimberly Clarks vanishing. The company that makes Kleenex, Huggies diapers, and other essentials seems unlikely to be displaced any time soon.
Put a gun to our heads and ask, “who will still be reliably compounding earnings a decade from now – NVDA or KMB?” The KCR team will go with KMB every time. Why?
Tech’s fortunes are often fleeting. Many “can’t-miss” tech names from just a few decades ago are no longer with us. Remember Wang Laboratories? Netscape? Digital Equipment Corp?
What about Apple? We covered that in our piece Apple II Flashback: The Fantasy of Predicting the Future. We’ve reproduced the lead-in image with some red emphasis under the word UNCERTAIN. As that piece explains, nobody predicted that the maker of the Apple II would become the company we now call “Apple.” Its rise to the top began as a lowly small cap value stock.

Do you really think it is going to be different this time?
KCR has no idea who “the next Apple” will be, but history is clear on this: Apple’s current dominance is anything but certain.
Yet when we look at valuations, the market has priced in perpetual perfection from many of today’s tech leviathans.
In Part 1 of this research, we showed the chart below but for Consumer Staples. That chart showed that Staples were as cheap relative to the market as almost any time in history.
Today, we’ve swapped in Tech stocks and it shows that they are nearly as expensive relative to the market as any time in the last 30+ years. Let’s walk through it again to make sure we are all on the same page:
The light blue line shows the percentage of stocks in the market that are cheaper than the tech sector. So, when the line is really low like in 1999, tech was more expensive than all but 33% of stocks in the market.
Today that number is 44%. So not quite as bad as the peak of the dot.com bubble, but hardly a bargain.

Part of the reason tech stocks look slightly better today than in 1999 is due to the sheer magnitude of the vendor financing underway. For those who were not investing in the 1990s or would like a refresher on this pernicious habit, we’d encourage you to jump to the section “Accounting Gimmicks on a Grand Scale” featured in some of our work on AI.
This research on Consumer Staples and Tech stocks is not designed to imply all tech stocks should be avoided. Or even to suggest that the overpriced Tech stocks that are driving the market might not go higher. For the avoidance of doubt: in both KCR’s model portfolios and our Active Strategies, we own plenty of tech stocks.
Our point is merely to try and help Financial Advisors and Institutional Investors who find themselves cornered into leaving clients overexposed to tech find a suitable path for some money to safer shores. And we believe the easiest such names to explain are the now-neglected household names in Consumer Staples.
Market euphoria frequently signals an inflection point. The best examples being the dot-com era and the COVID bubble when consumers spent stimulus money on IT (and other discretionary items) in a way that simply could not last. Investors ignored the fact that we still needed and will always need toothbrushes and laundry
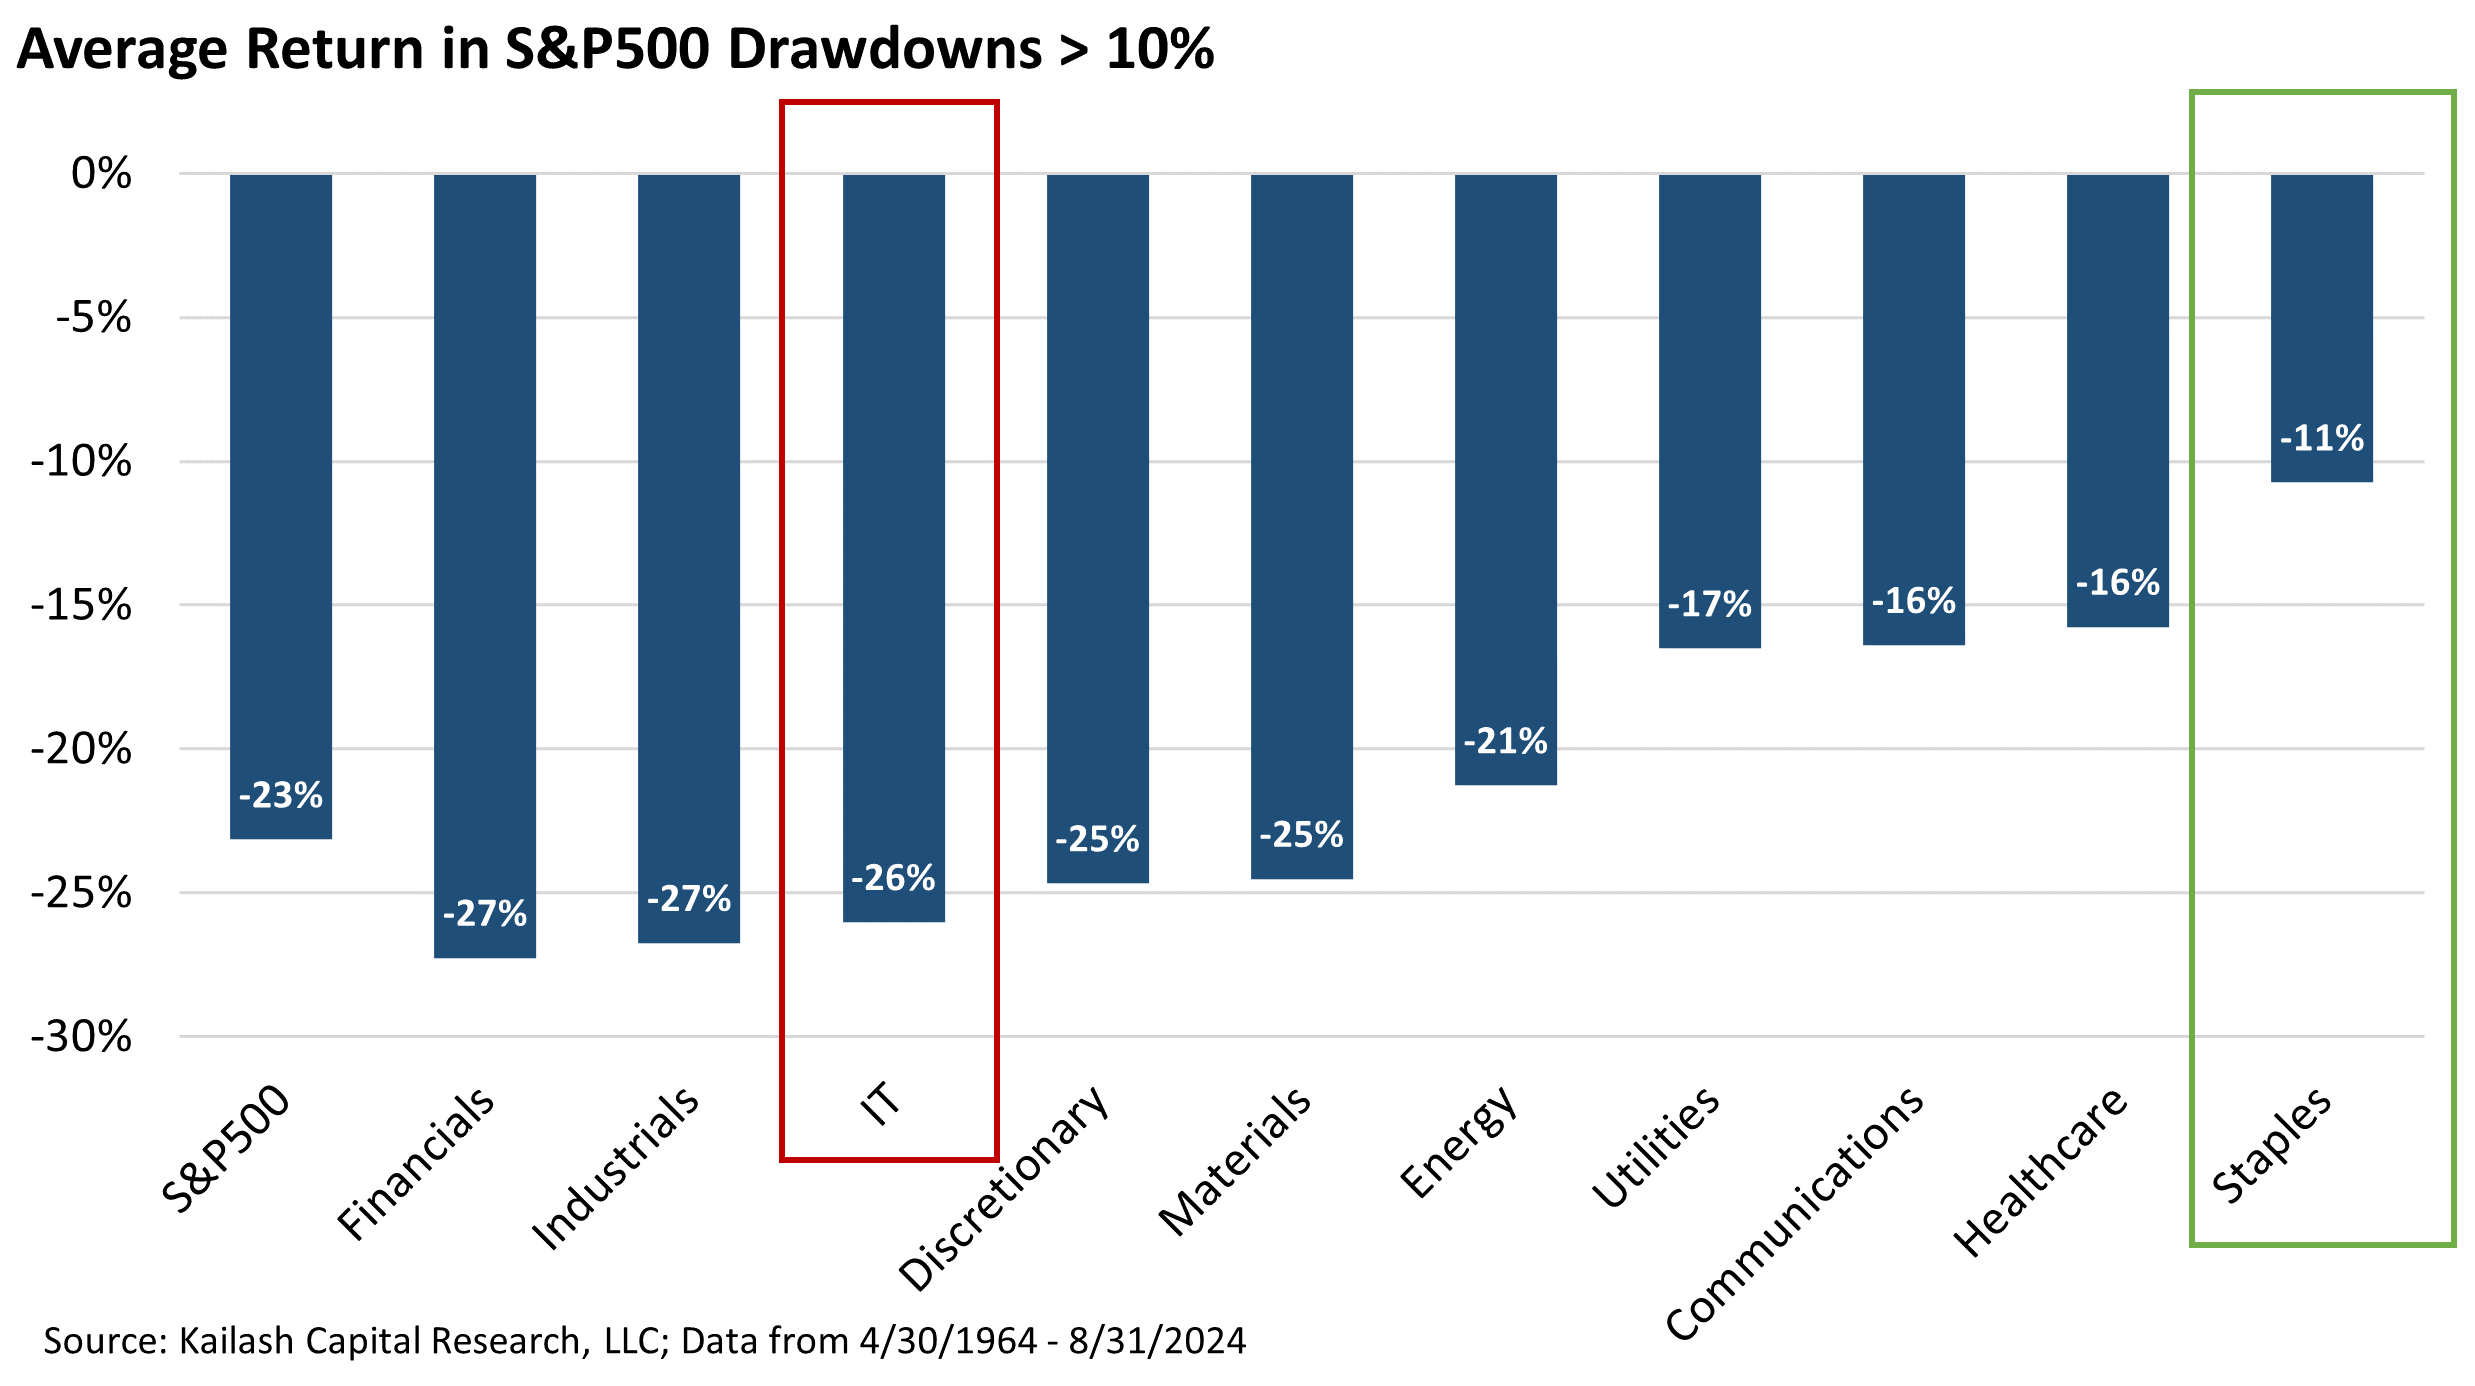
detergent. KCR cannot time markets. But it is worth remembering that when things go badly, Consumer Staples stocks have historically been a terrific way to blunt drawdowns.
The chart below shows the average return by sector every time the S&P 500 has fallen by -10% or more. We’ve put a red box around Tech and a green box around Staples. Not complicated
The table below compares KCR’s Top 10 ranked Staples stocks to KCR’s 10 Worst Ranked Tech Stocks. We’d strongly encourage Financial Advisors to “check for tech-dreck” in their client portfolios. While some of these names may have performed well, we’d remind readers that our ranking methodologies use evidence-based methods to identify low earnings quality, poor capital allocation, and unforgiving valuations – something we see in all 10 of these tech names.

Conclusion:
- The bottom ranked 10 Tech stocks trade at ~1,000% premium to our top ranked Staples
- The Staples stocks we favor are dirt cheap on every metric despite churning out tremendous cash flows, powered by strong ROEs and paying you nearly as much as a 10-year Treasury
- For believers in beta….our Staples stocks have roughly half the price risk of the market
Please find below our 10 worst ranked Tech names and top 10 ranked Consumer Staples.


Disclaimer
The information, data, analyses, and opinions presented herein (a) do not constitute investment advice, (b) are provided solely for informational purposes and therefore are not, individually or collectively, an offer to buy or sell a security, (c) are not warranted to be correct, complete or accurate, and (d) are subject to change without notice. Kailash Capital Research, LLC and its affiliates (collectively, “KCR”) shall not be responsible for any trading decisions, damages, or other losses resulting from, or related to, the information, data, analyses or opinions or their use. The information herein may not be reproduced or retransmitted in any manner without the prior written consent of KCR. In preparing the information, data, analyses, and opinions presented herein, KCR has obtained data, statistics, and information from sources it believes to be reliable. KCR, however, does not perform an audit or seek independent verification of any of the data, statistics, and information it receives. KCR and its affiliates do not provide tax, legal, or accounting advice. This material has been prepared for informational purposes only and is not intended to provide, and should not be relied on for tax, legal, or accounting advice. You should consult your tax, legal, and accounting advisors before engaging in any transaction.
Nothing herein shall limit or restrict the right of affiliates of KCR to perform investment management or advisory services for any other persons or entities. Furthermore, nothing herein shall limit or restrict affiliates of KCR from buying, selling, or trading securities or other investments for their own accounts or for the accounts of their clients. Affiliates of KCR may at any time have, acquire, increase, decrease, or dispose of the securities or other investments referenced in this publication. KCR shall have no obligation to recommend securities or investments in this publication as a result of its affiliates’ investment activities for their own accounts or for the accounts of their clients.
© 2023 Kailash Capital Research, LLC – All rights reserved.
October 3, 2024 |
| Authors: Matthew Malgari, Nathan Przybylo, Dr. Sanjeev Bhojraj and John Durkin
October 3, 2024
Authors: Matthew Malgari, Nathan Przybylo, Dr. Sanjeev Bhojraj and John Durkin