There are two times in a man’s life when he should not speculate: when he can’t afford it, and when he can.
-Mark Twain
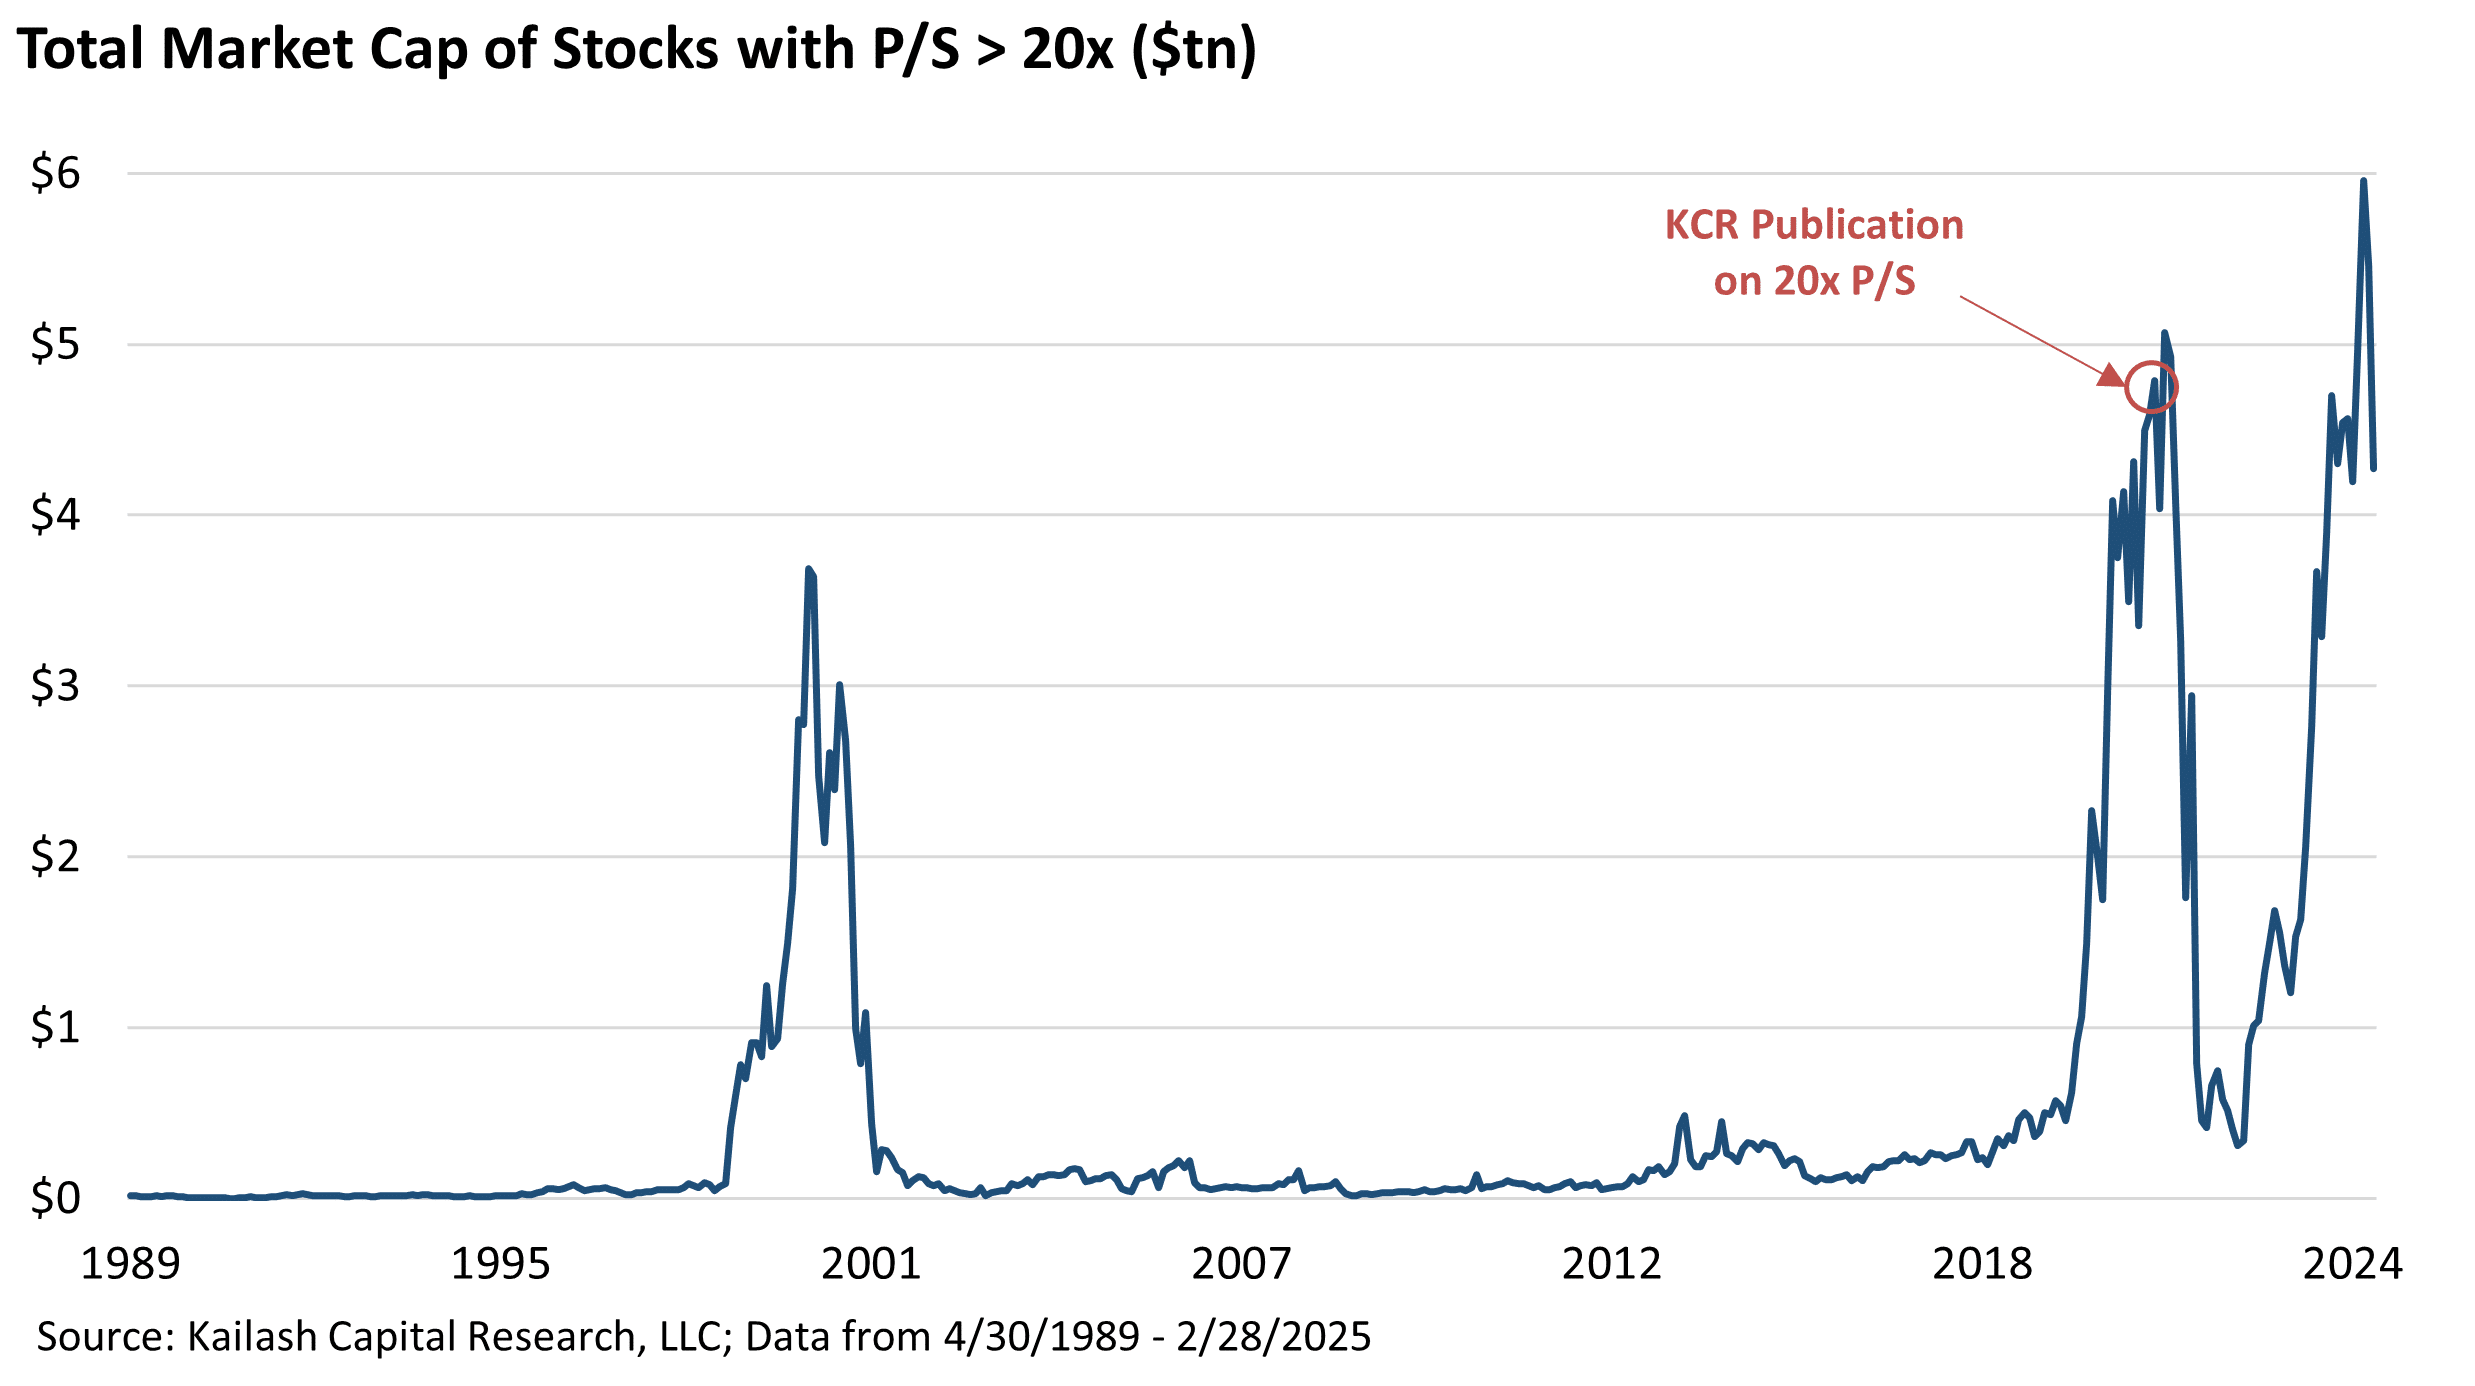
Back in September of 2021, KCR penned a piece The Market Cap of Companies Over 20x Price to Sales is Out of Control. You can see on the chart below that we timed that call perfectly got lucky.
Our recent update on the rich opportunities we see for those willing to diversify into Mid, Small and Micro cap stocks provoked us to update, once again, the 20x price to sales work. We are deep into the phases of the first true “double-bubble” in modern history.
Get our insights direct to your inbox: SUBSCRIBE
As a reminder: stocks at 10x price to sales have a horrendous track-record for reasons we explain often. Stocks at 20x price to sales? Madness. Last time we highlighted this chart, you can see what happened.
As this paper will show:
- There is no historical precedent for successful investing at these multiples
- Avoiding stocks trading at these multiples is easy
- The cost of avoiding them is typically emotional as these speculative valuations always collapse
- The risk of embracing speculatively priced assets can be a financial catastrophe
- The data on stocks priced at 20x price to sales is clear: DON’T
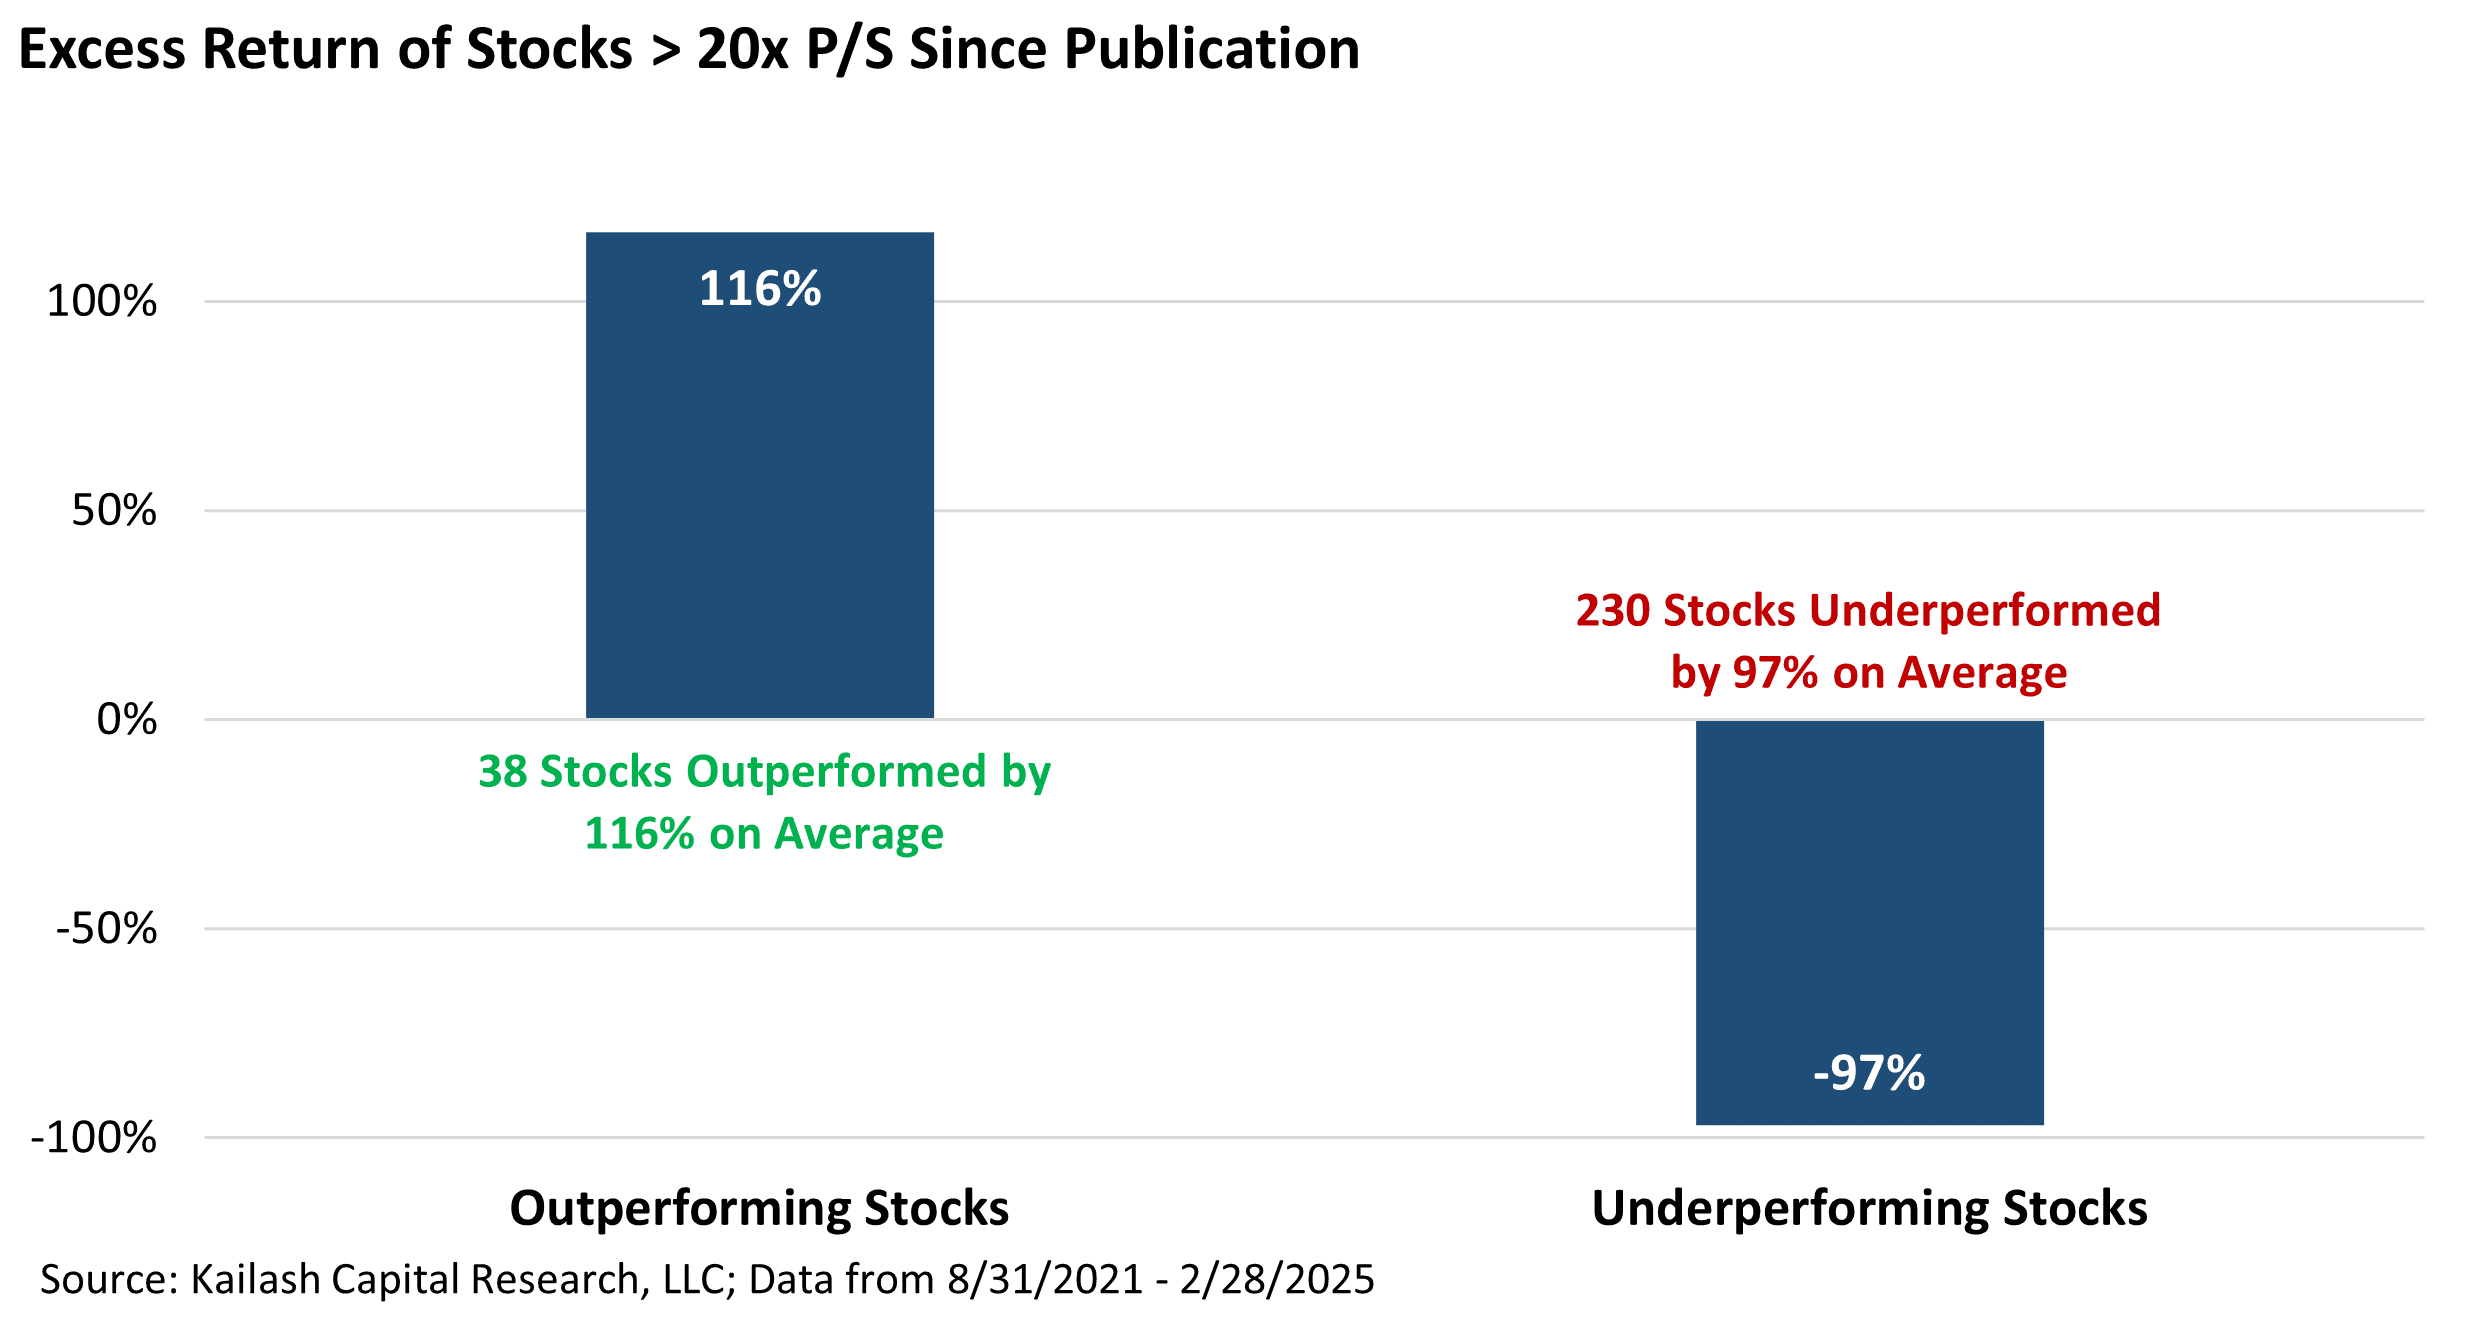
Looking at the chart above, some might think that with the bubble reflating, well, investors in these stocks have done well since our 2021 publication. As the chart on the following page shows, you would be 14% right and 86% wrong.
Since we published that piece only 38 out of 268 stocks that were over 20x price to sales beat the market. (38/268 = 14%). Even worse, the average decline on the 230 losers was -97%, on a relative basis.
So now that the market indexes sit with trillions of dollars invested in stocks at these valuations, we encourage investors to ask: do you feel lucky?
- Below shows the percent of firms at > 20x sales that delist at the 1, 2, 3, and 10 year forward horizons
- The numbers for 2 & 3 years are catastrophic, with nearly a fifth of stocks gone by year 3 (18%)
- By the 10th year, so many firms have delisted, 55%, this is not a viable strategy to even try and test

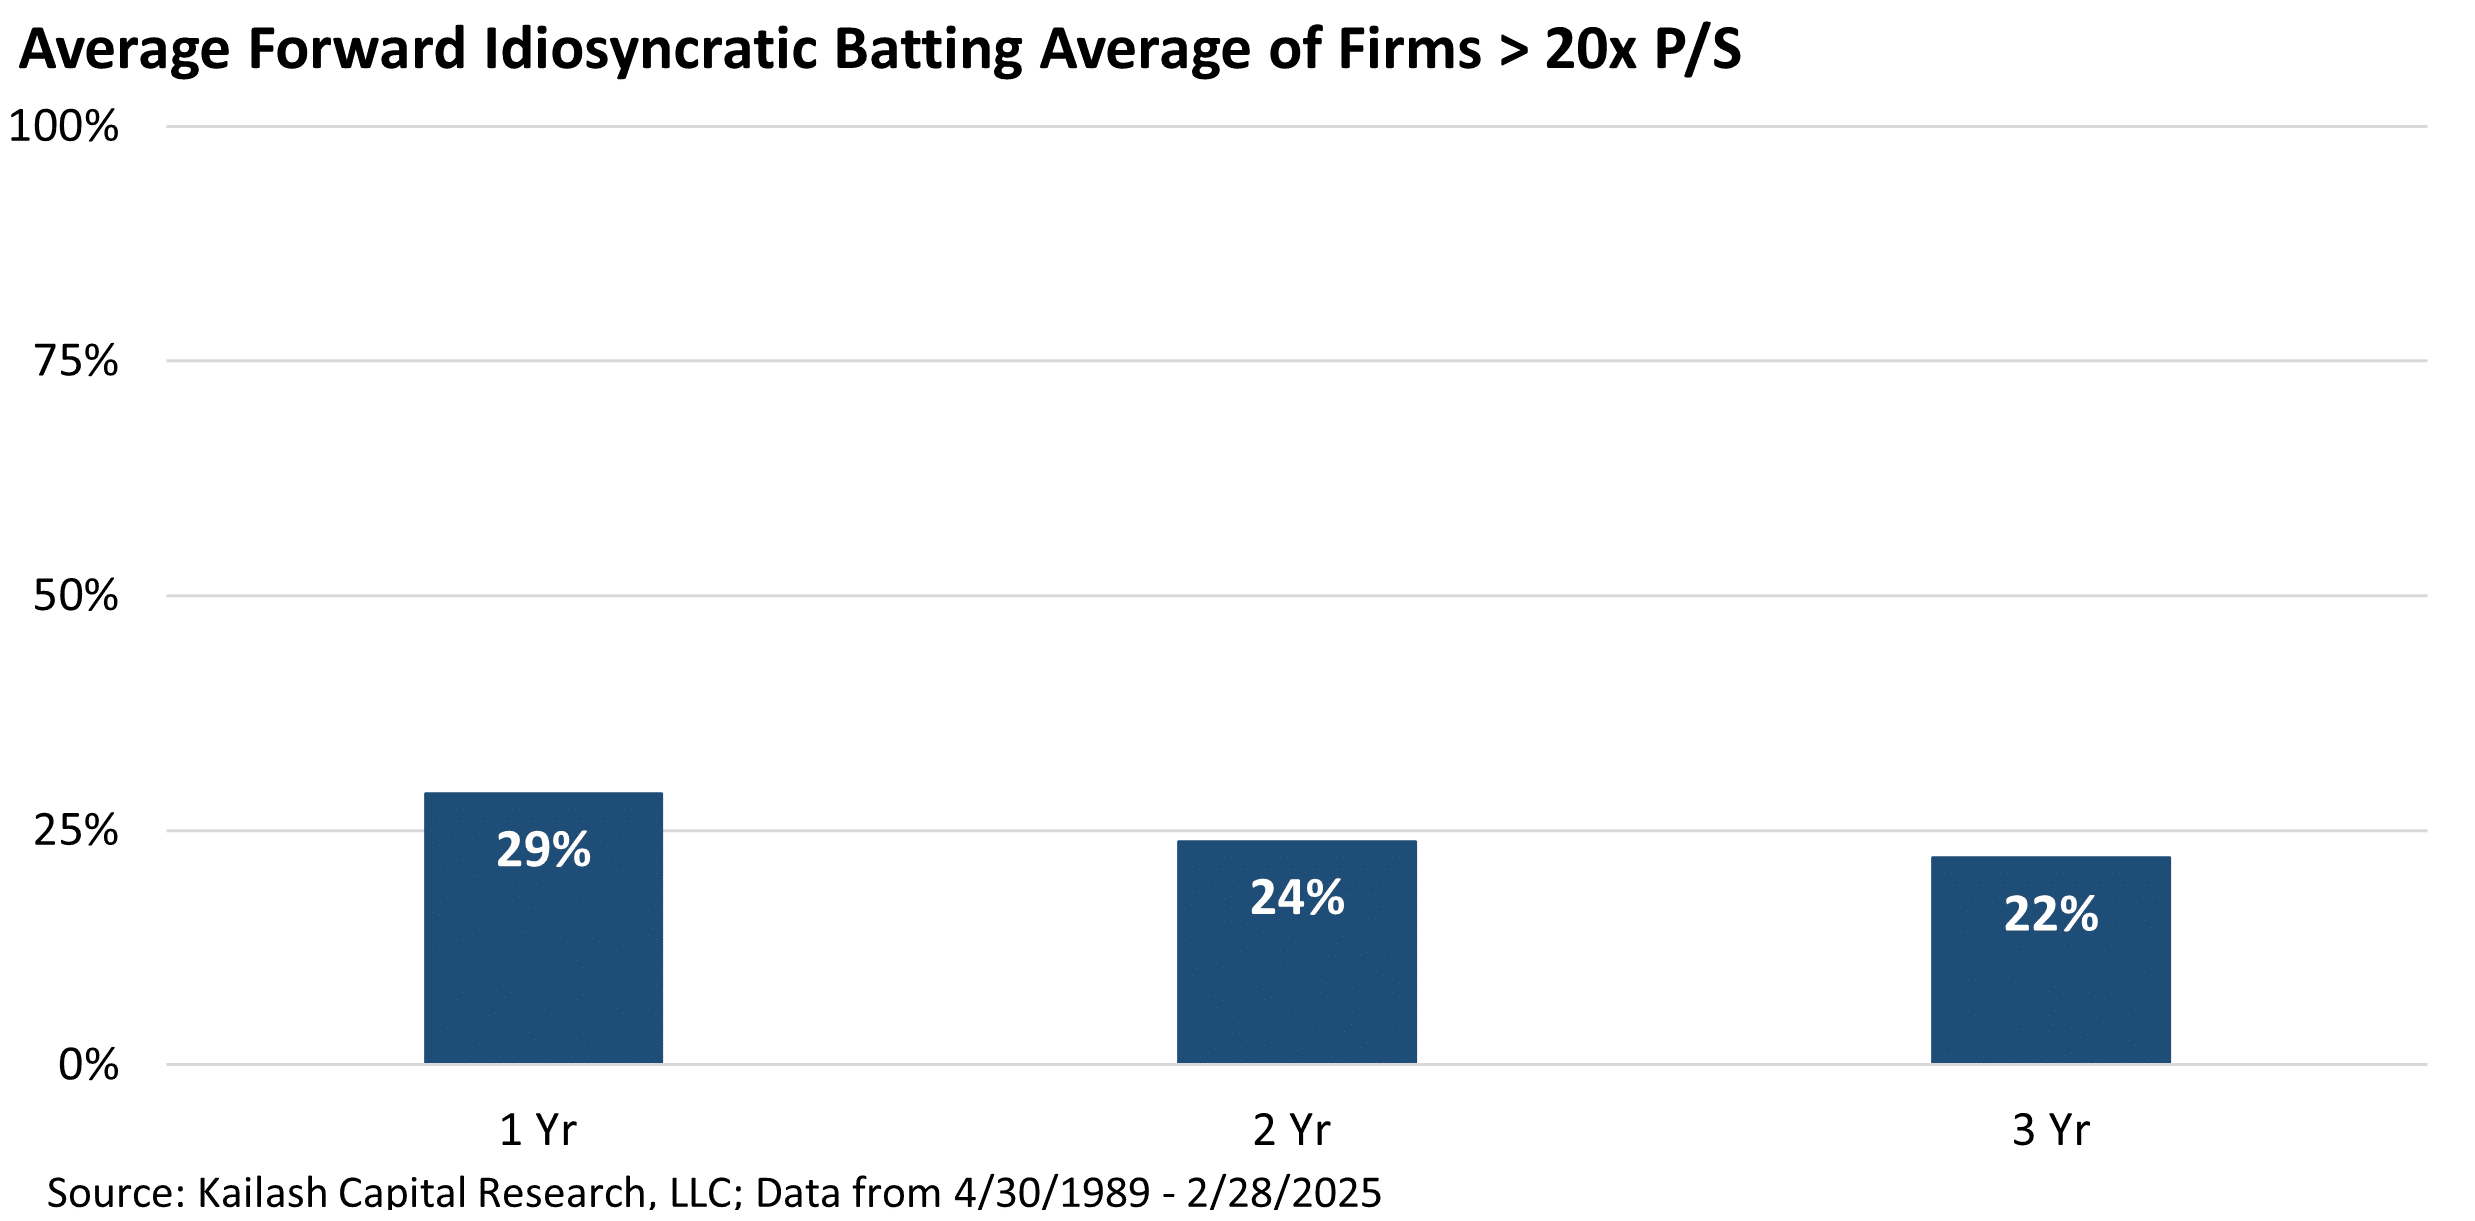
The chart below shows the odds of stocks priced like these beating the market over the 1, 2, & 3 year horizon.
- Stocks over 20x sales only beat the market 29% of the time over a one year holding horizon
- Stocks over 20x sales only beat the market 24% of the time over a two-year holding horizon
- Stocks over 20x sales only beat the market 22% of the time over a three-year holding horizon
These odds make a casino’s worst bets look appealing. Go there. At least the drinks are free.
Not financial advice: speak to a Financial Advisor before making any investment decisions.
- The below shows how buying all the stocks > 20x P/S in each year and holding them for 1 year worked
- The results are horrible with very few exceptions, including 1998, 2003, 2019, 2020, and now
- The data suggests speculative periods are followed by steep losses – KCR encourages prudence

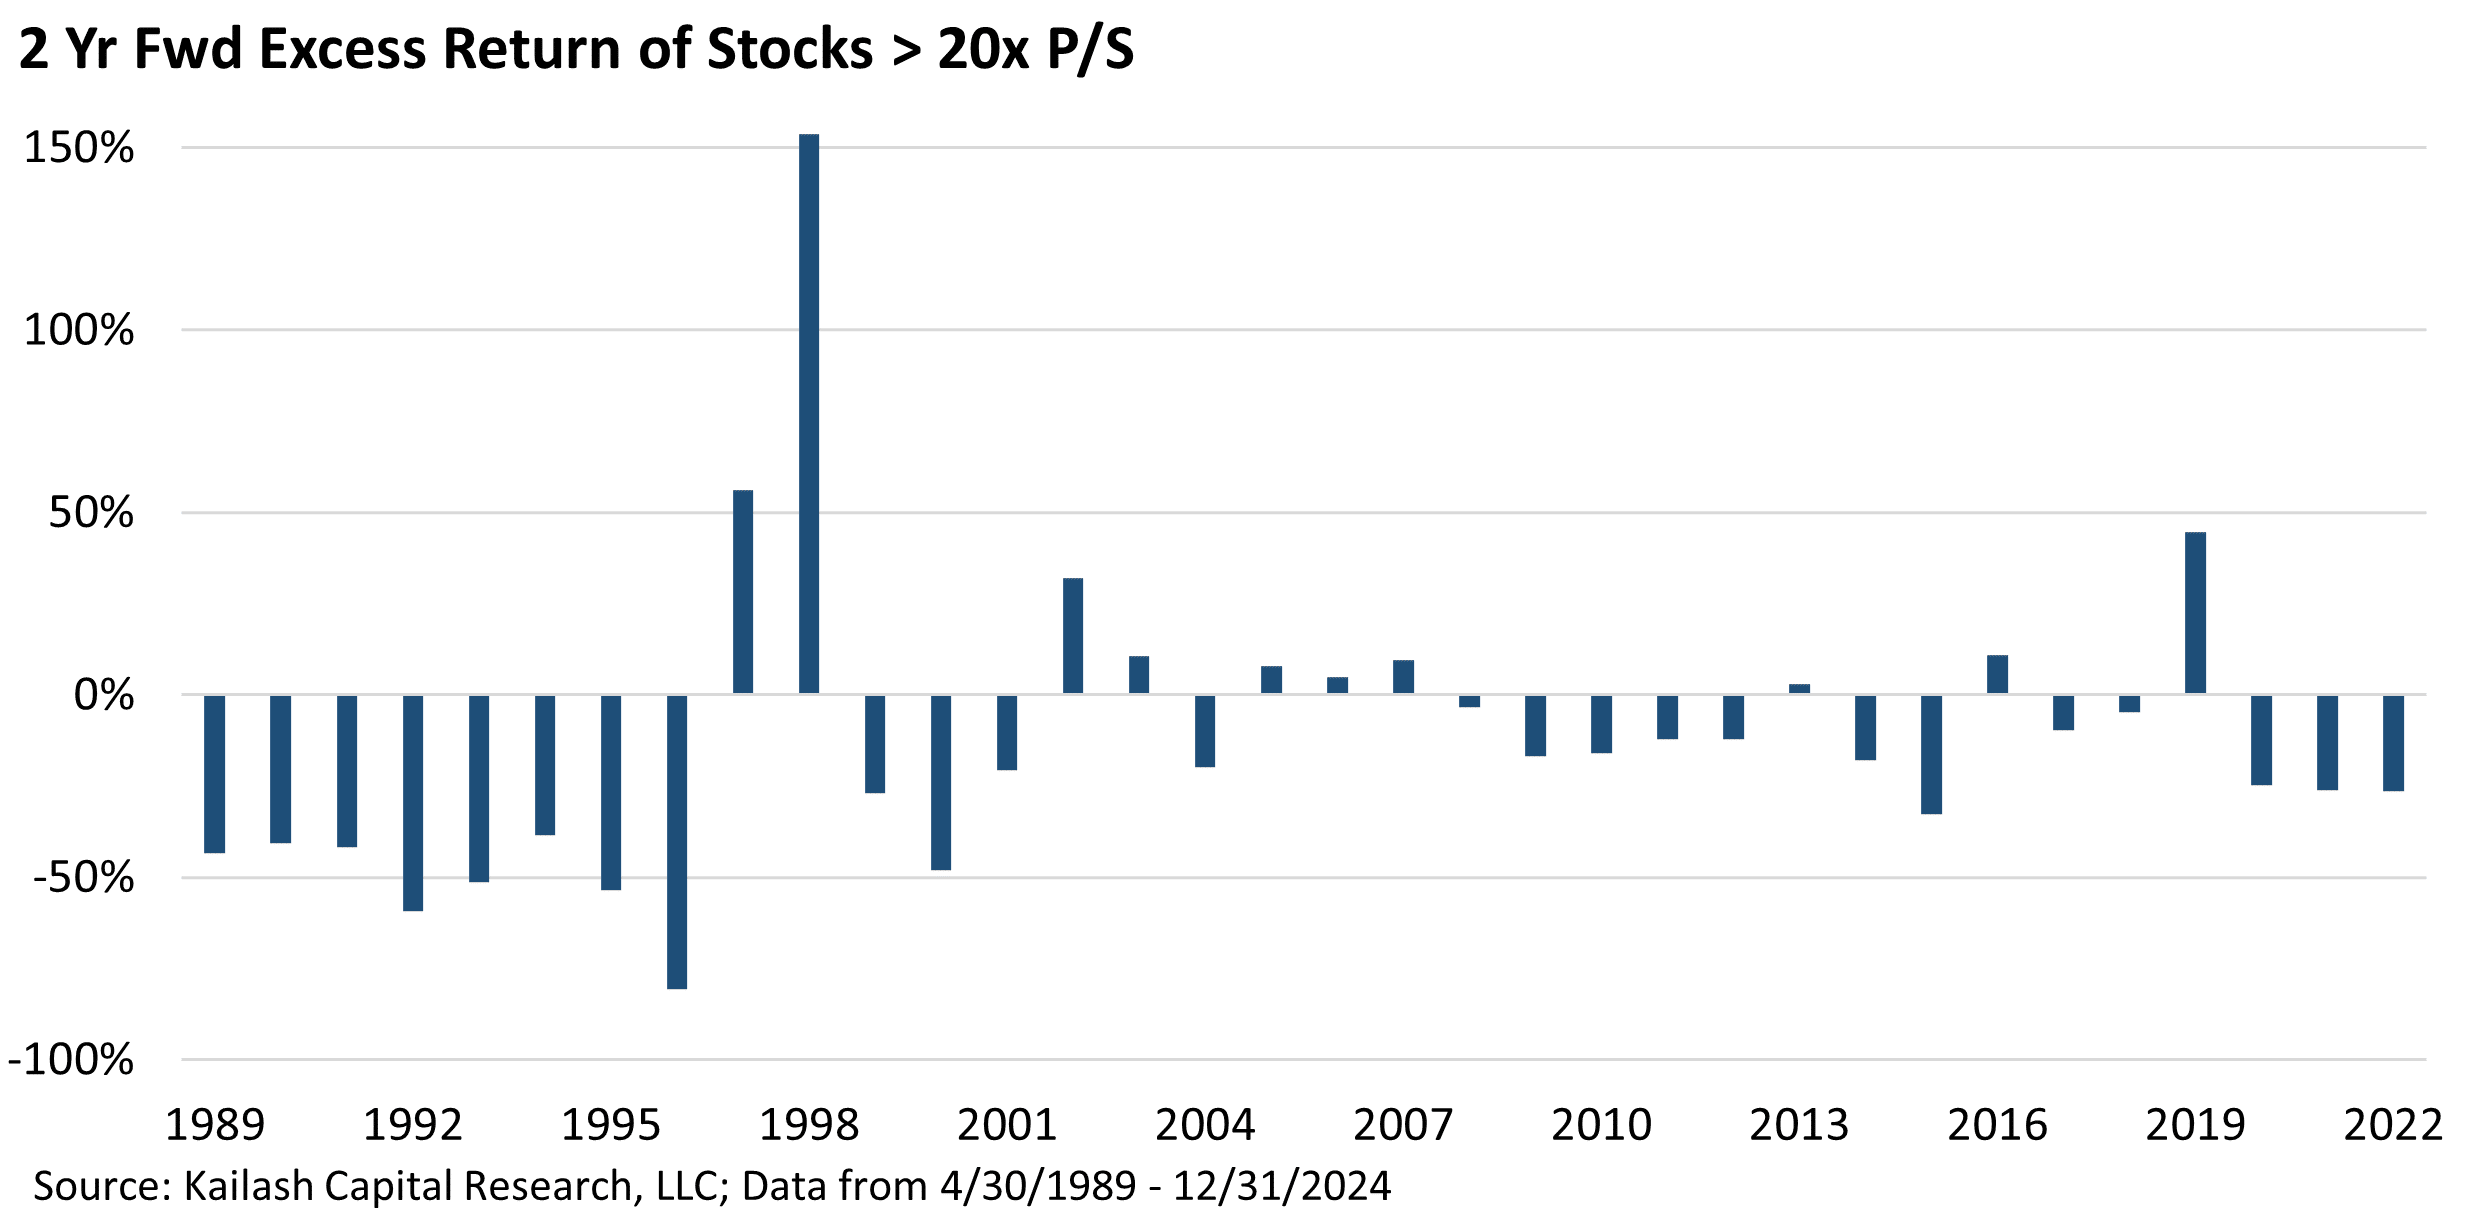
- The below shows how buying all the stocks > 20x P/S in each year and holding them for 2 years worked
- The results are horrible and merely amplify the findings of the 1 year buy & hold chart above
- The incredibly rare instances of 20x stocks actually outperforming any 2 years are followed by disaster
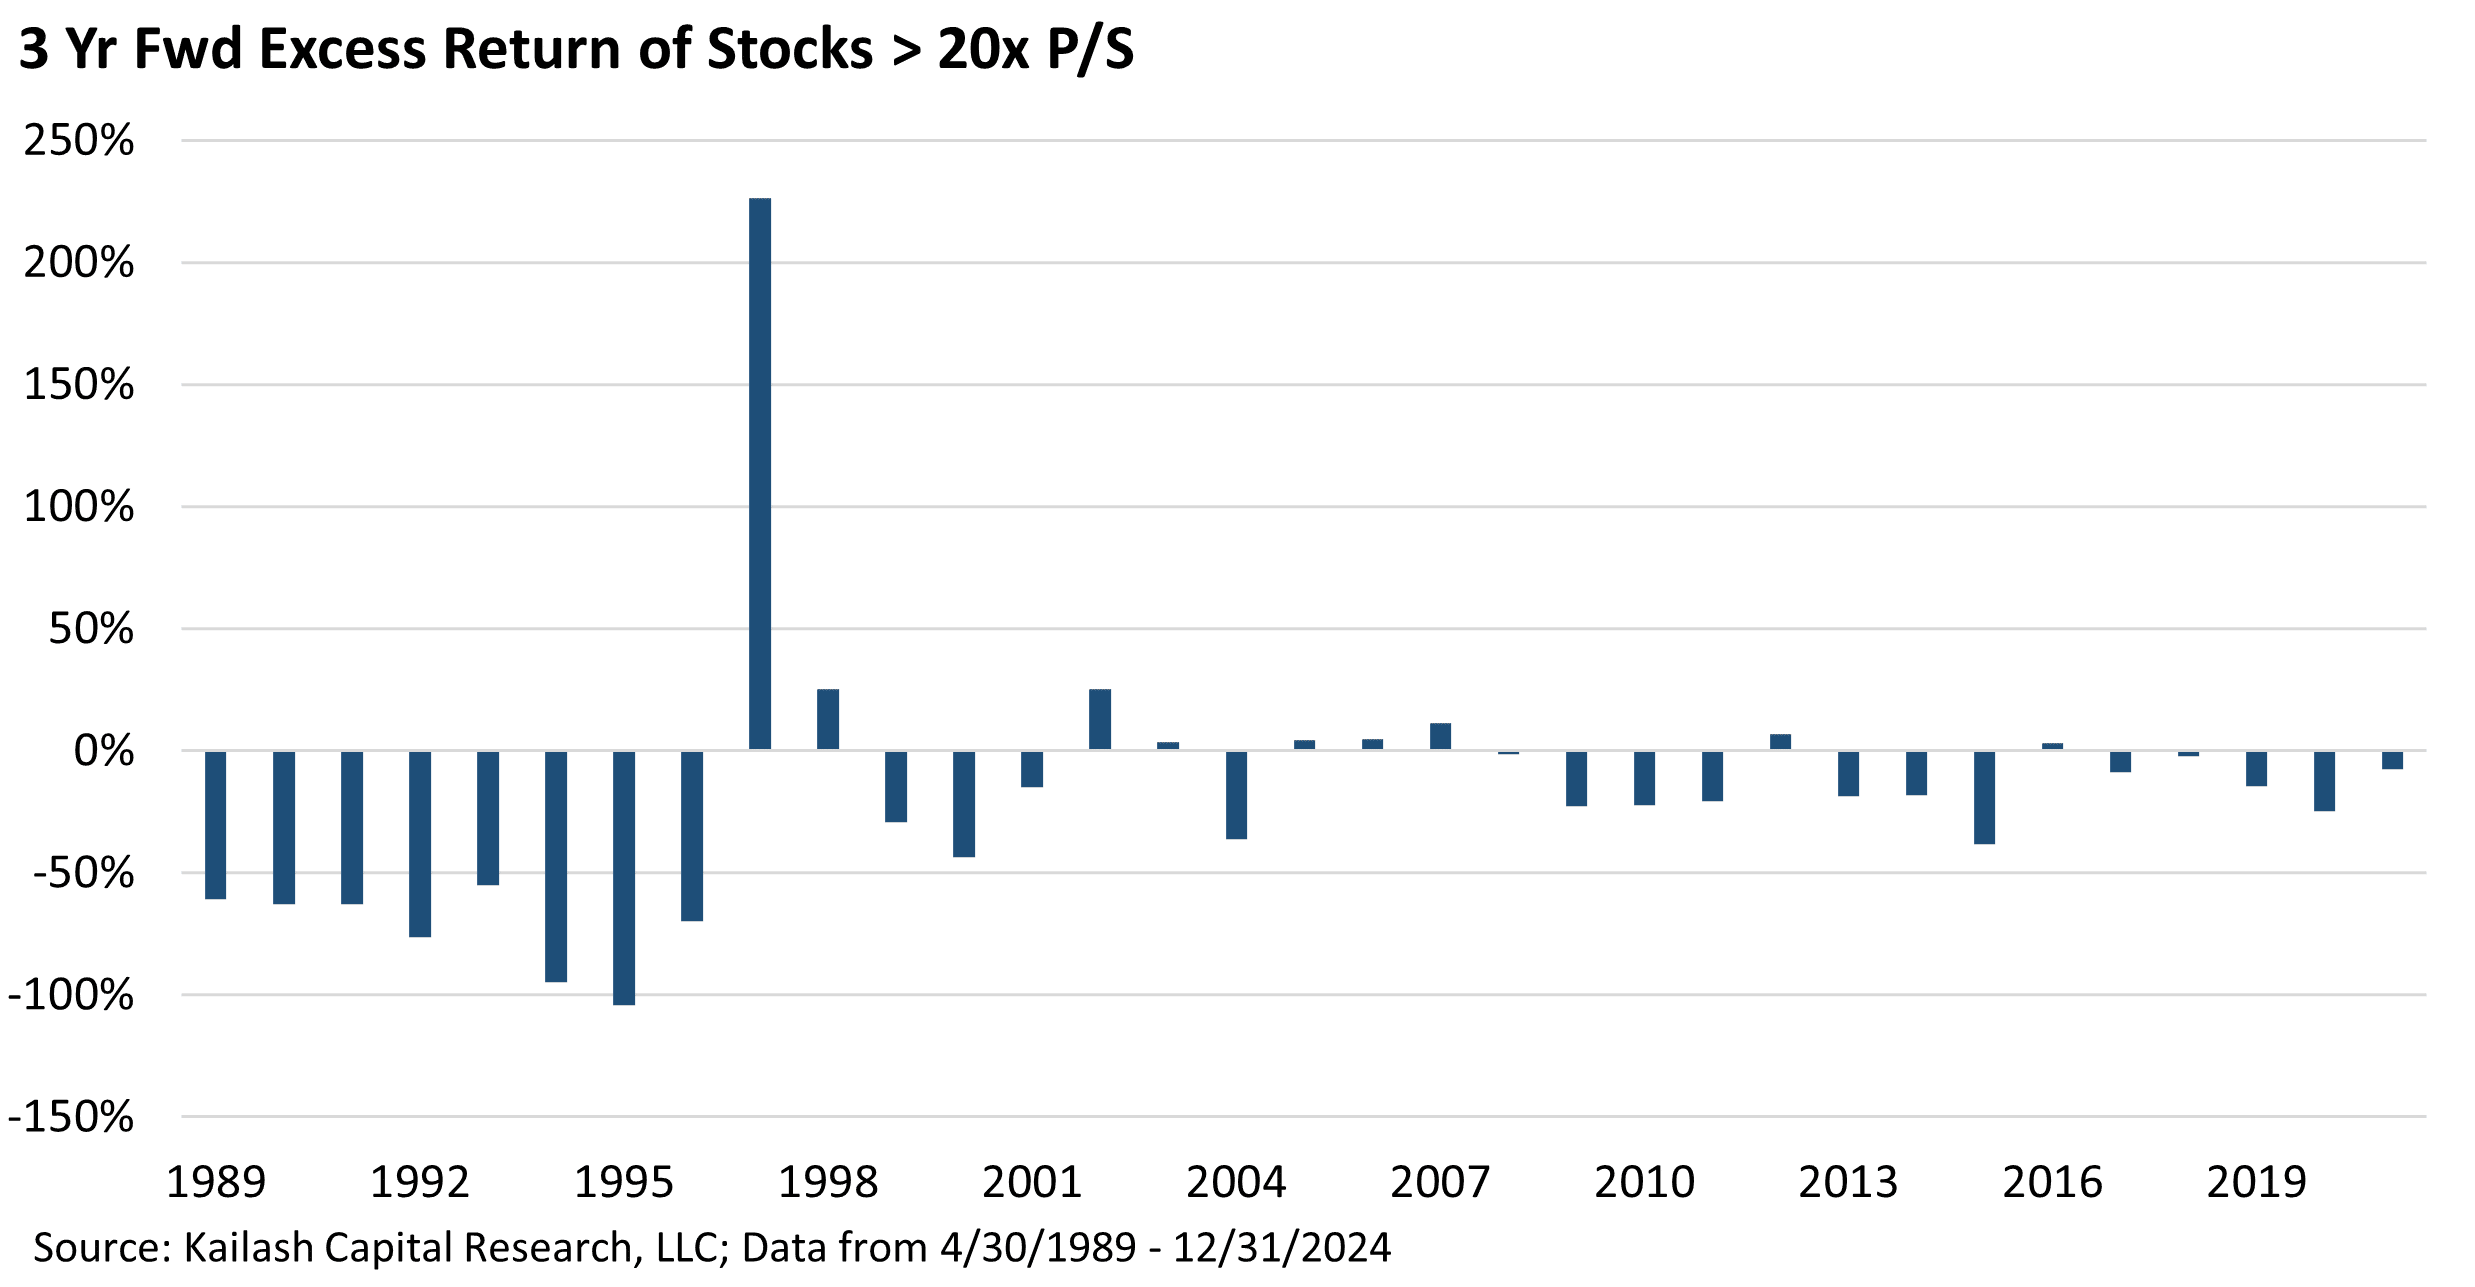
- The below shows how buying all the stocks > 20x P/S in each year and holding them for 3 years worked
- The results are, with one exception in 1997, horrible
- Stare at that chart and ask yourself again – do you feel lucky?
The conclusion is obvious: buying stocks over 20x sales is a terrible idea for long-term investors. Period.
The table below shows some basic fundamental data on (from top to bottom):
First Row – The 83 stocks valued over 20x price to sales that are in the bottom quintile of our models:
- These expensive and poorly ranked stocks burn -2% of their bloated enterprise values a year
- They trade at an average of 44x sales, have negative earnings (negative P/E ratios) and…
- ….are diluting owners to the tune of -6% a year (Total Yield)
We have published a complete list of the stocks over 20x price to sales that rank poorly on the following page. If you see these names in your holdings – ask your Financial Advisor why.
 Source: Kailash Capital Research, LLC; Data from 2/28/2025
The two rows underneath show the fundamentals of KCR’s Midcap and Small Cap GARP model portfolios. Look at the dispersion in valuations, cash flows, and payments to owners.
This is only hard if you are watching stocks bounce around on an app. For long-term investors, KCR humbly submits: doing the right thing today has rarely been more obvious.
KCR Bottom Ranked Stocks > 20x Price/Sales Below


Disclaimer
The information, data, analyses, and opinions presented herein (a) do not constitute investment advice, (b) are provided solely for informational purposes and therefore are not, individually or collectively, an offer to buy or sell a security, (c) are not warranted to be correct, complete or accurate, and (d) are subject to change without notice. Kailash Capital Research, LLC and its affiliates (collectively, “KCR”) shall not be responsible for any trading decisions, damages, or other losses resulting from, or related to, the information, data, analyses or opinions or their use. The information herein may not be reproduced or retransmitted in any manner without the prior written consent of KCR. In preparing the information, data, analyses, and opinions presented herein, KCR has obtained data, statistics, and information from sources it believes to be reliable. KCR, however, does not perform an audit or seek independent verification of any of the data, statistics, and information it receives. KCR and its affiliates do not provide tax, legal, or accounting advice. This material has been prepared for informational purposes only and is not intended to provide, and should not be relied on for tax, legal, or accounting advice. You should consult your tax, legal, and accounting advisors before engaging in any transaction.
Nothing herein shall limit or restrict the right of affiliates of KCR to perform investment management or advisory services for any other persons or entities. Furthermore, nothing herein shall limit or restrict affiliates of KCR from buying, selling, or trading securities or other investments for their own accounts or for the accounts of their clients. Affiliates of KCR may at any time have, acquire, increase, decrease, or dispose of the securities or other investments referenced in this publication. KCR shall have no obligation to recommend securities or investments in this publication as a result of its affiliates’ investment activities for their own accounts or for the accounts of their clients.
© 2023 Kailash Capital Research, LLC – All rights reserved.
March 21, 2025 |
| Authors: Matthew Malgari, Nathan Przybylo, Dr. Sanjeev Bhojraj and John Durkin
March 21, 2025
Authors: Matthew Malgari, Nathan Przybylo, Dr. Sanjeev Bhojraj and John Durkin