Accessing Equity Returns & Income in a Moment of AI Induced Idiocy
Shortly after the trough of the Great Financial Crisis, this newsletter observed that Wall Street was selling “dividend investing” strategies to coax investors back into equities. In pieces ranging from The Dividend Deception to Rushing About: The Thirst for Yield, we pilloried what we felt were often deceptive marketing pitches that led investors into history’s biggest bubble in dividend stocks. Those pieces also spent a great deal of time explaining the pros, cons, and types of dividend-paying stocks.
In 2014, we levied particularly harsh criticism on the MLP fad that gripped the income investing world, describing the mania as “…a bit like inviting investors to have a quick smoke in the dynamite shed.” Two years after that paper’s publication, one of the more popular MLP indexes would plunge a devastating -50%.[i] So much for dividends being “safe.”
We have changed our tune in our recent missives, The Great Growth Run & a Peek at Forsaken Dividend Stocks and Diversifying with Dividends. Now we are highlighting data that suggests this may be a particularly opportune moment to turn your back on the glamour names dominating Growth and Core indexes in favor of dividends. Why?
It turns out that what you pay matters. The fundamentals matter. The businesses underpinning those dividends matter. If this all sounds like common sense, that’s because it is.
Get our insights direct to your inbox: SUBSCRIBE
Human beings are in the business of complicating shoelaces when money is involved. We are emotional creatures and irrational. Warren Buffett probably said it best in his 1984 speech at the Columbia Business School:
“When the price of a stock can be influenced by a ‘herd’ on Wall Street with prices set at the margin by the most emotional person, or the greediest person, or the most depressed person, it is hard to argue that the market always prices rationally. In fact, market prices are frequently nonsensical.” -Warren Buffett, 1984[ii]
Let’s do a quick review of our last two papers in bullet form:
The Great Growth Run in 3 Bullets (please see the paper for simple exhibits)
- Over the last 7 years, growth stocks have returned over 18% a year
- 18% a year is ~double the long-run return of equities, and investors are now performance-chasing
- Over that 7-year stretch, high dividend stocks have underperformed growth by a level last seen at the peak of the dot.com bubble despite the dividend stocks experiencing faster earnings growth
Diversifying with Dividends in 3 Bullets (please see the paper for simple exhibits)
- Index funds have the lowest exposure to dividend stocks other than in February 2000 & December 2021
- Dividends have been an important source of investor returns, particularly post speculative periods & during decades characterized by inflation
- Higher dividend-yielding stocks had better returns and lower volatility than low dividend-paying stocks
In that last paper, we showed data demonstrating that simply buying the quartile (25%) of stocks with the highest dividends provided investors with returns nearly equivalent to the market with a fraction of the volatility. While that is a simple empirical fact, we closed the piece by noting that “…we do not believe buying the top quartile of dividend-paying stocks is a good idea.”
The remainder of this paper will do the following two things:
- Offer some simple explanations as to why buying the top quartile of dividend payers is foolish
- Introduce KCR’s model portfolio that creates an income-rich strategy with far better fundamentals and return prospects than simply chasing stocks with high yields
We’ll start off by reproducing the fourth exhibit from our last paper with one critical addition. The chart below shows the annualized returns in navy blue and the volatility in light blue of dividend-paying stocks by quartile, from low (Quartile 1) to high (Quartile 4). Over on the far right, we have added the returns and volatility if we merged Quartile 3 and Quartile 4.
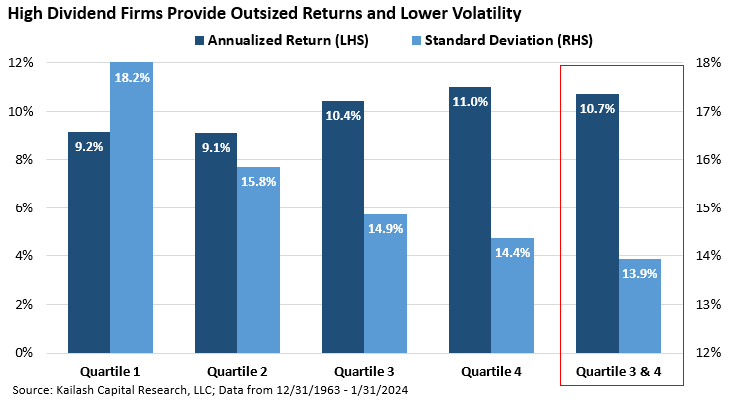
We do this for many reasons, but chief among them is that it allows our evidence-based process a larger and more forgiving workspace from which to select high-quality dividend stocks. A bit more detail for those interested:
Over history, the data shows significant variation in the quality and health characteristics across these groups. This is particularly true of the highest quartile of dividend payers (Quartile 4).
There are periods where the highest quartile of dividend payers (Quartile 4) is all one needs to shop from. At other times, however (like the MLP & dividend bubble we highlighted in 2014), this top quartile can be crowded with “dividend traps” – or companies that have embraced dividends inconsistent with their fundamentals and cash flows.
By allowing ourselves the flexibility to shop from both the third and fourth quartiles of dividends, we improve our ability to achieve high levels of income without sacrificing fundamental firm health. The importance of this cannot be overstated – buying high-yielding stocks of low quality is a recipe for ruin.
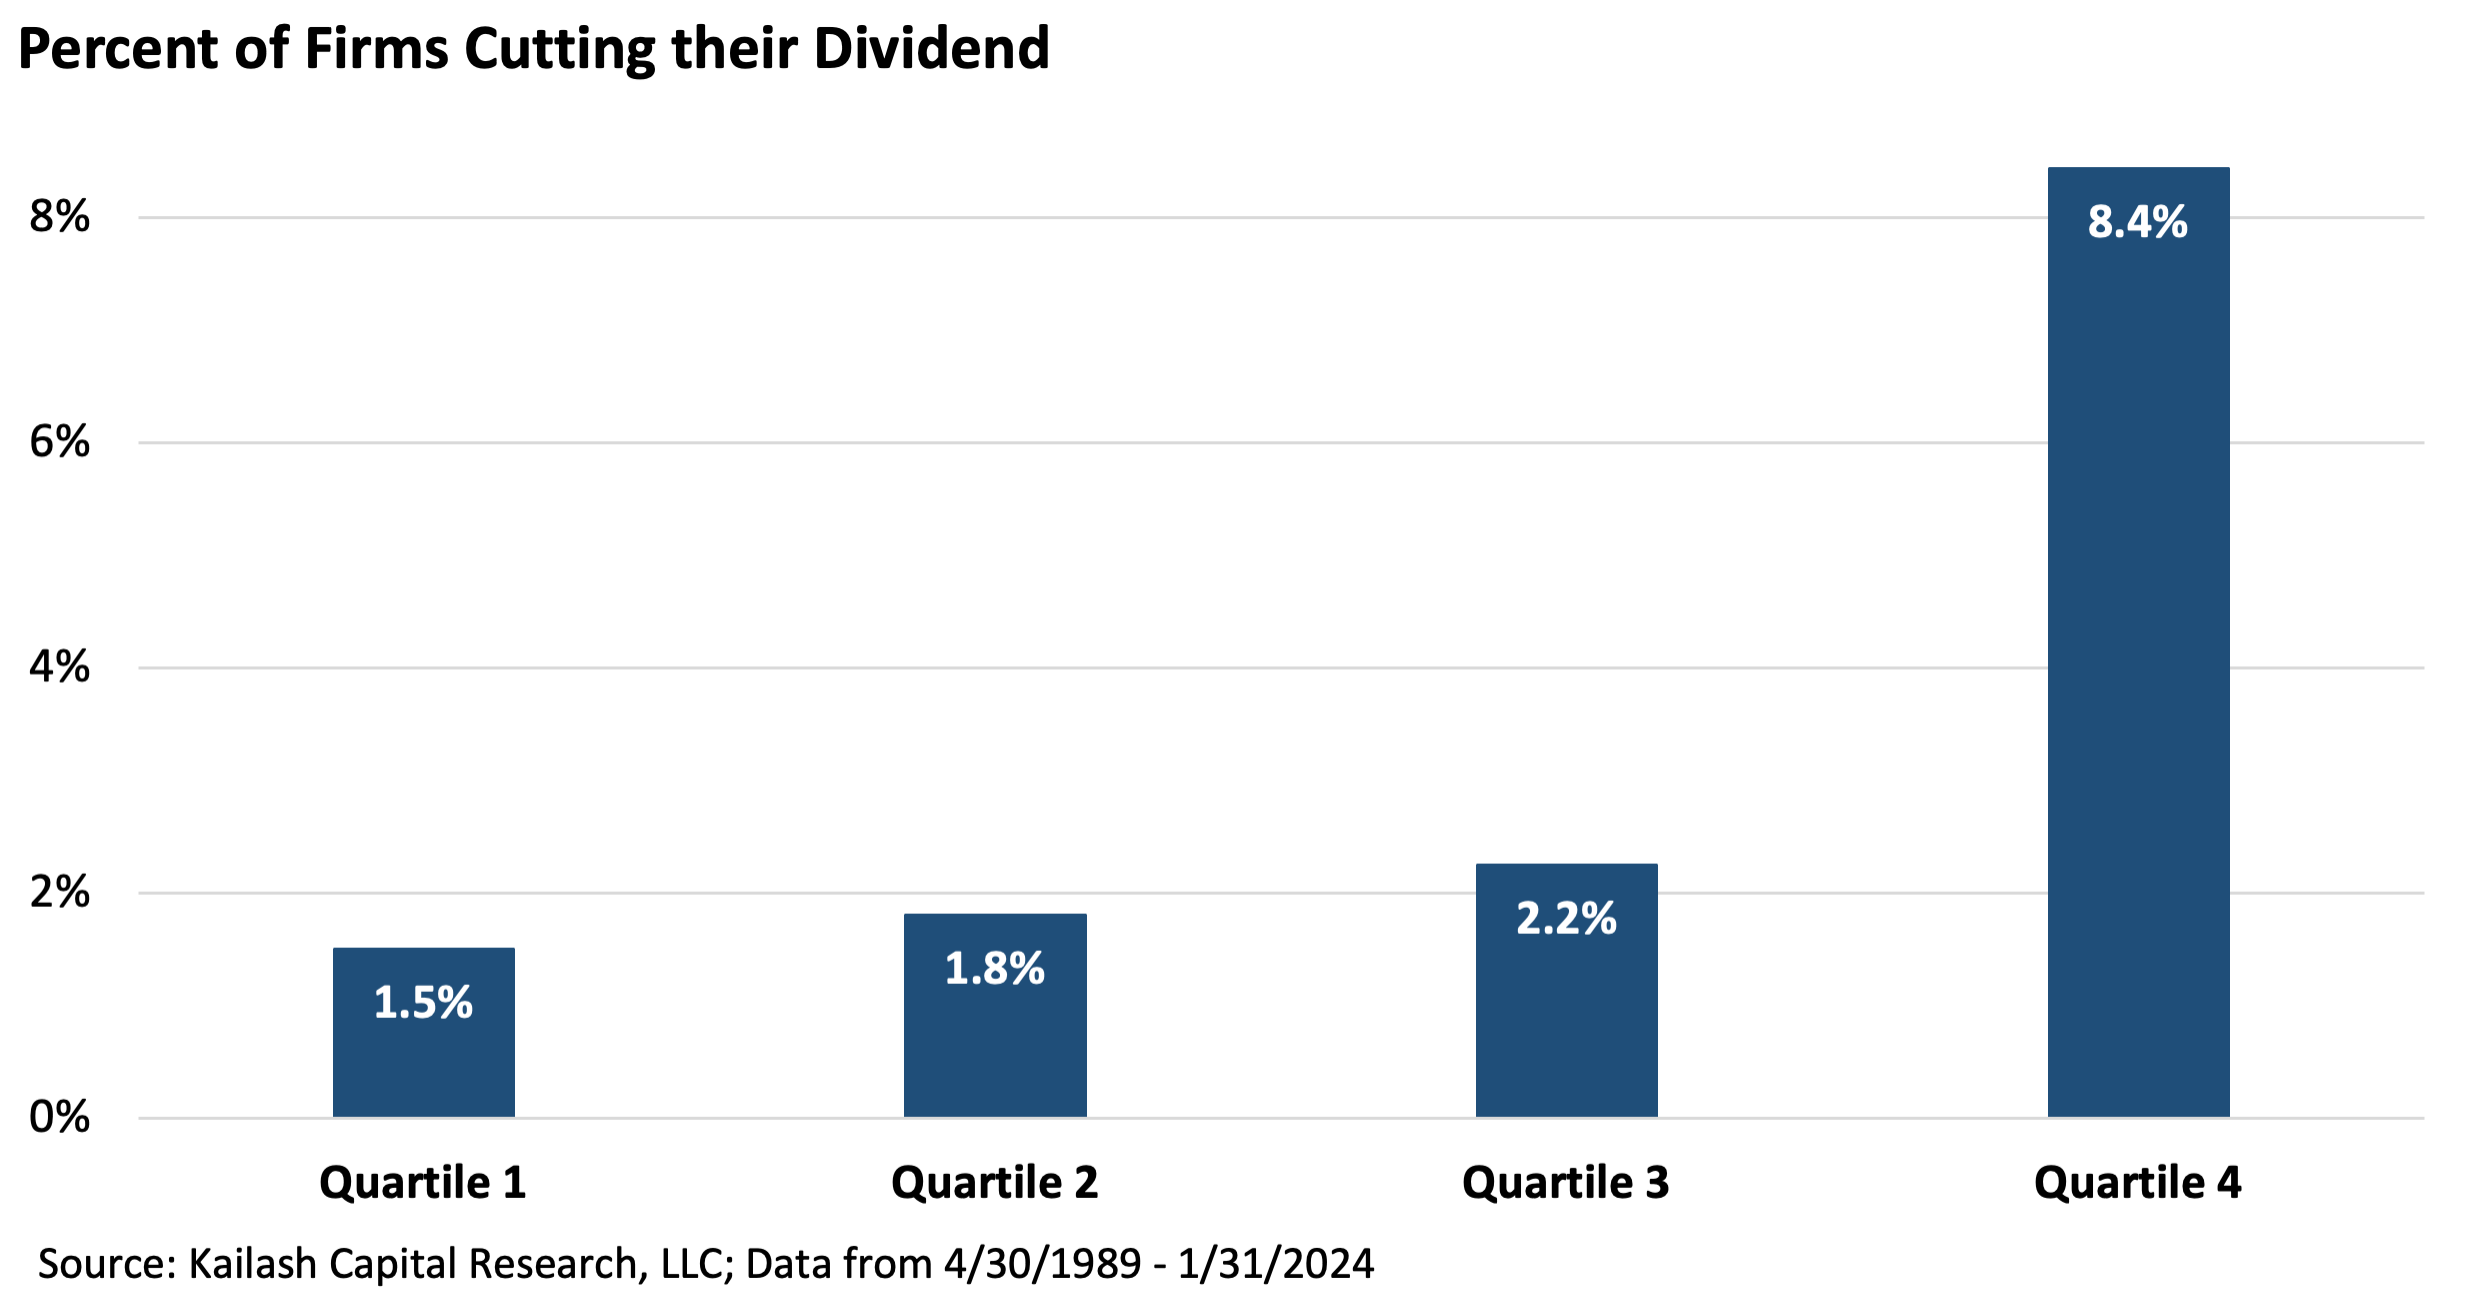
One of the most powerful and simple ways to conceptualize this is through the lens of stocks that reduce their dividends.
The prevalence of dividend cutting is overwhelmingly among the highest-yielding stocks (Quartile 4). Quartiles 1, 2, and 3 rarely, if ever, cut their dividends. In contrast, the historical data for the highest-yielding stocks is unforgiving, with 8.4% of firms in that group slashing their dividends.
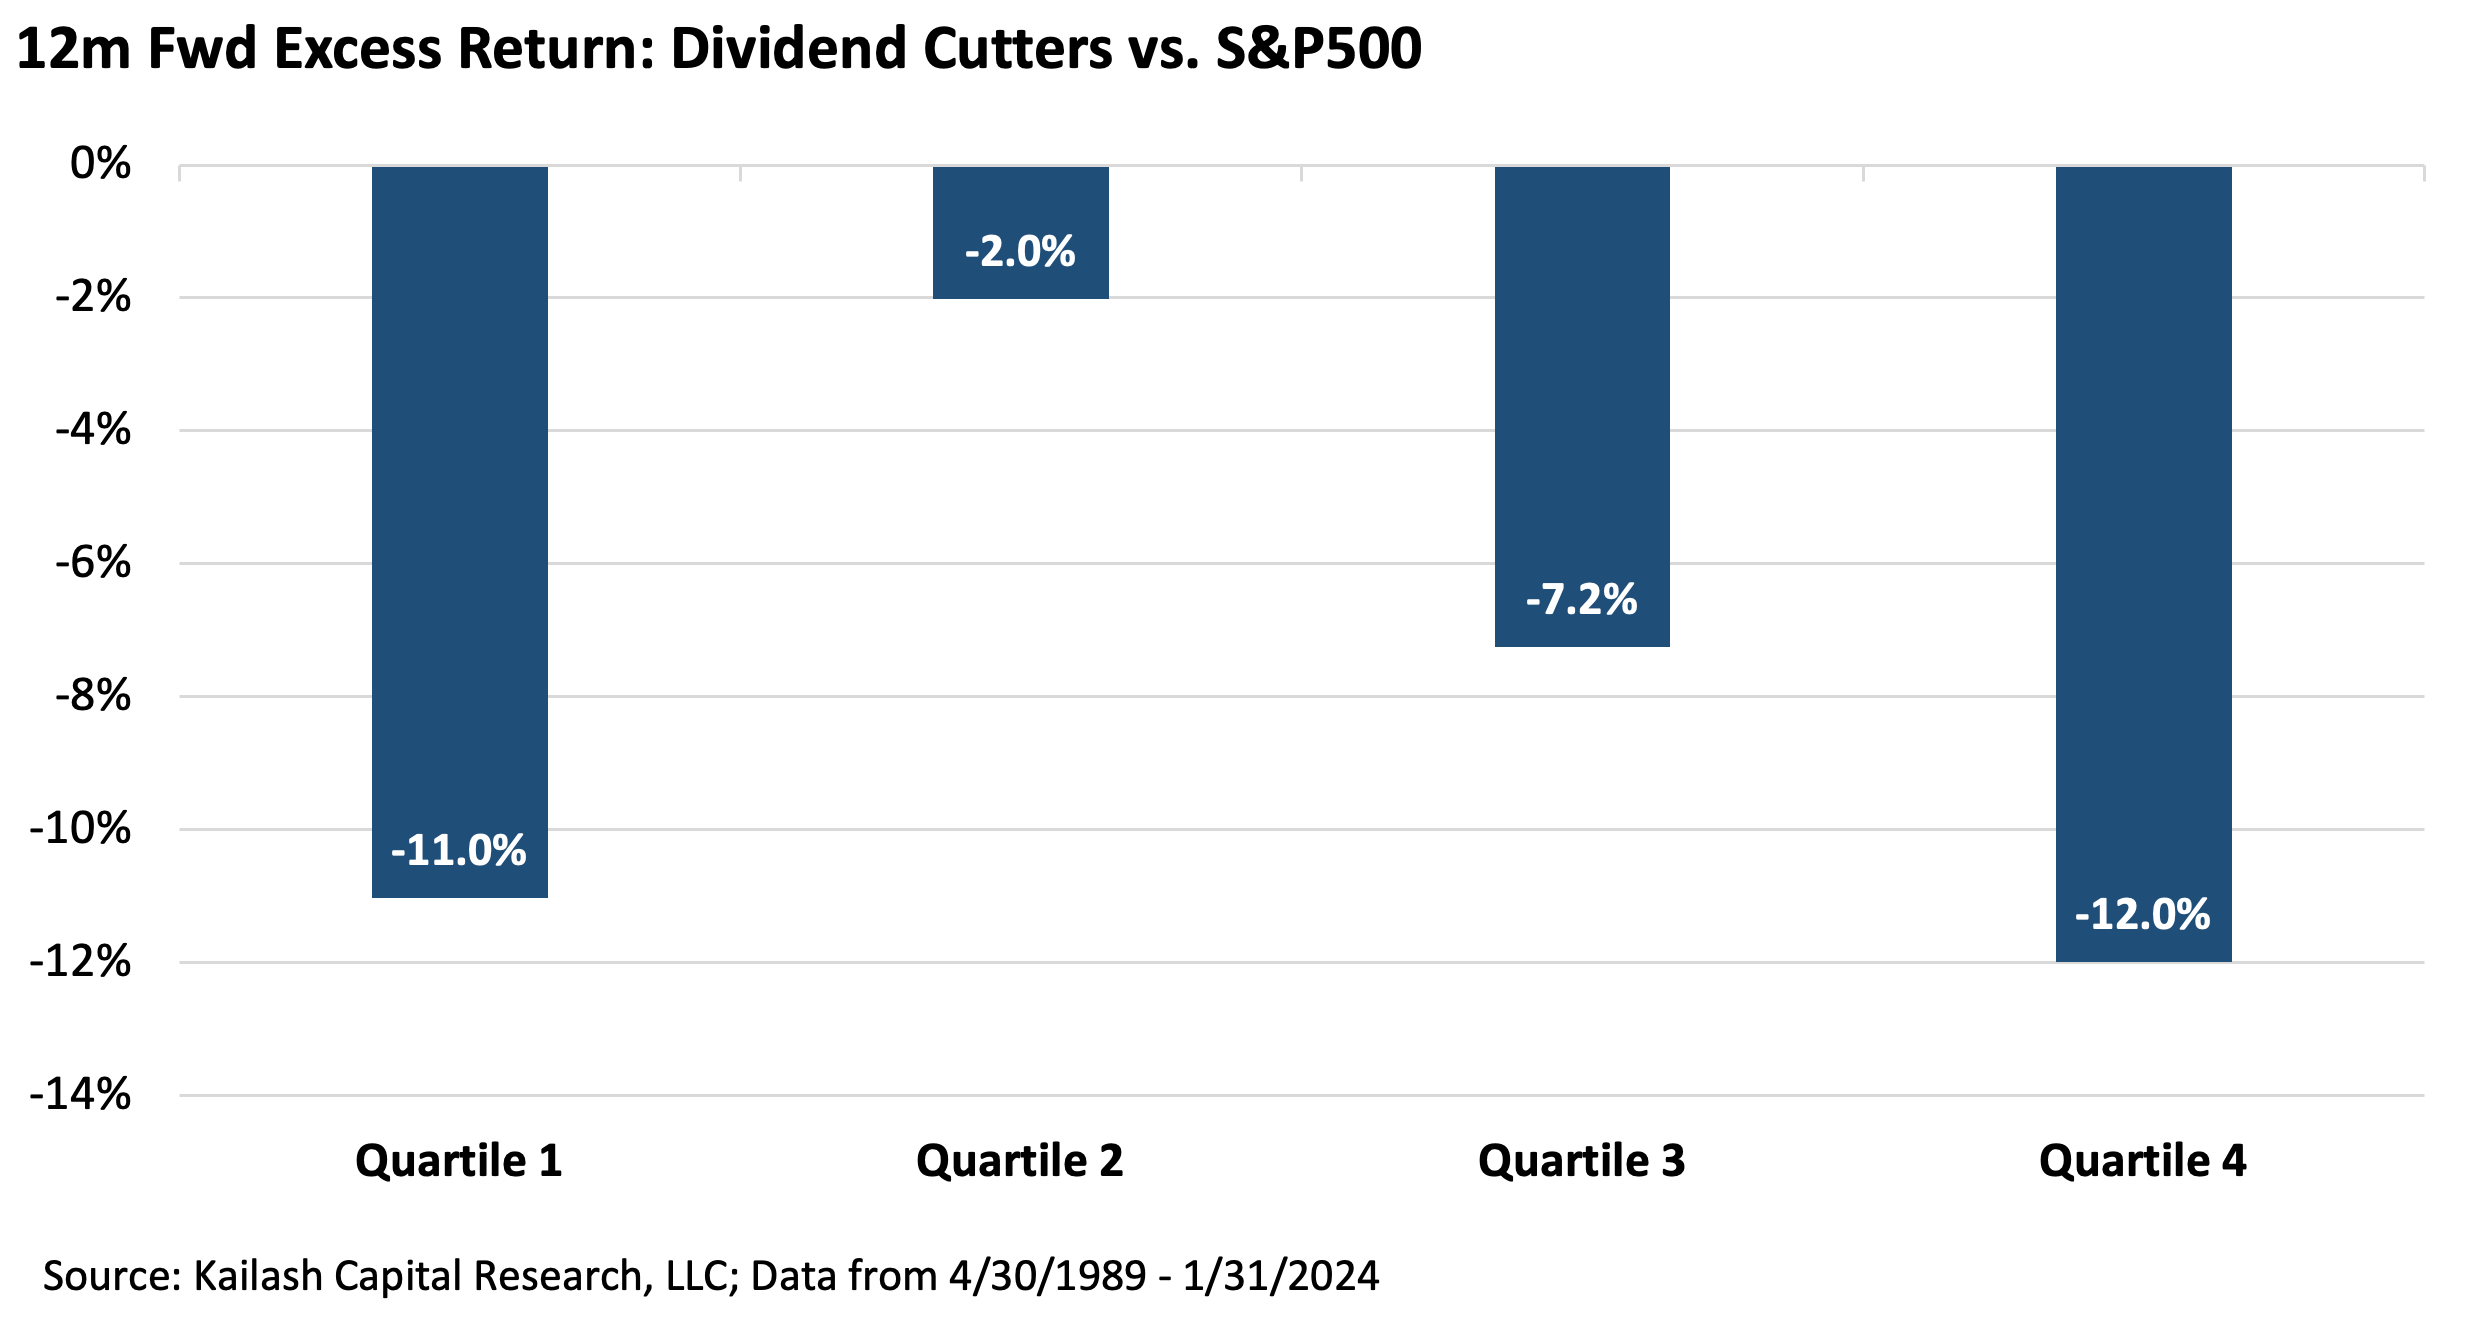
The chart below shows the consequences of dividend reductions by quartile of dividend payers. Looking at the far right, you can see that when the highest yielding stocks in Quartile 4 cut their dividend, the consequences are severe. Cuts in that group have led to -12% underperformance. While stocks in the 3rd quartile also fall a punishing -7.2% when they cut, it is worth remembering that only happens 2% of the time. For an explanation of Quartile 1 returns see our endnote.[iii]
One might be tempted to just shop from the third quartile of dividend payers to avoid potential divided cutters. Yet this would forfeit the bulk of the yield-rich equity universe without acknowledging that the highest yielding quartile can sometimes be home to the potent mix of the most mispriced and highest quality dividend stocks.
Indeed, this was largely the case in 1999 and 2000. The chart below shows the dramatic drop-off in yield between the various quartiles today. The last bar, “Quartiles 3 & 4,” shows that the blended yield of the two groups sits at 3.5%, or just slightly below the 10-year Treasury bond.

KCR’s method of sourcing high-quality, sustainable dividends from stocks that may be mispriced brings compelling income producing coupons together with common-sense fundamental concepts for capital appreciation.
By expanding our “work-space” to the top two quartiles (Quartiles 3 & 4) but putting primacy on firm quality, we believe we get the best of both worlds. When the population of the highest yielding firms (Quartile 4) becomes corrupted with lower quality or distressed firms, our model mechanically tilts into the third quartile and high-grades the quality of the underlying stocks.
Does that mean we take a modest haircut in yields? Yes. But to repeat the line above: there is no point in buying a low-quality stock with an unsustainable coupon.
Contrarily, when markets are highly speculative and investors ignore high-quality income stocks and the fourth quartile (Quartile 4) is rich with the double-whammy benefit of high-quality stocks and the highest yields, our model tips into it aggressively.
In our view, this dynamic, evidence-based process is nothing short of common sense. And the historical results suggest that this approach is a powerful method of sourcing income from equities in a statistically advantaged manner.
We’ll dig in by putting in some “throw-away” items that explain how we do this.
The chart below shows, in order of appearance:
- The returns and standard deviation of the top two quartiles of yield (Quartiles 3 & 4)
- The returns and standard deviation of stocks in the top two quartiles of yield (Quartiles 3 & 4) that have positive free cash flow (FCF)[iv]
- The returns and standard deviation of stocks in the top two quartiles of yield (Quartiles 3 & 4) that have negative free cash flow (FCF)[v]
- The historical returns and standard deviation of the KCR Dividend Model Portfolio
Hopefully, the first two bars are now familiar turf. We put the next set of pairs in to show just how some basic, common-sense rules can improve on simply buying the top two quartiles of dividend-yielding stocks.
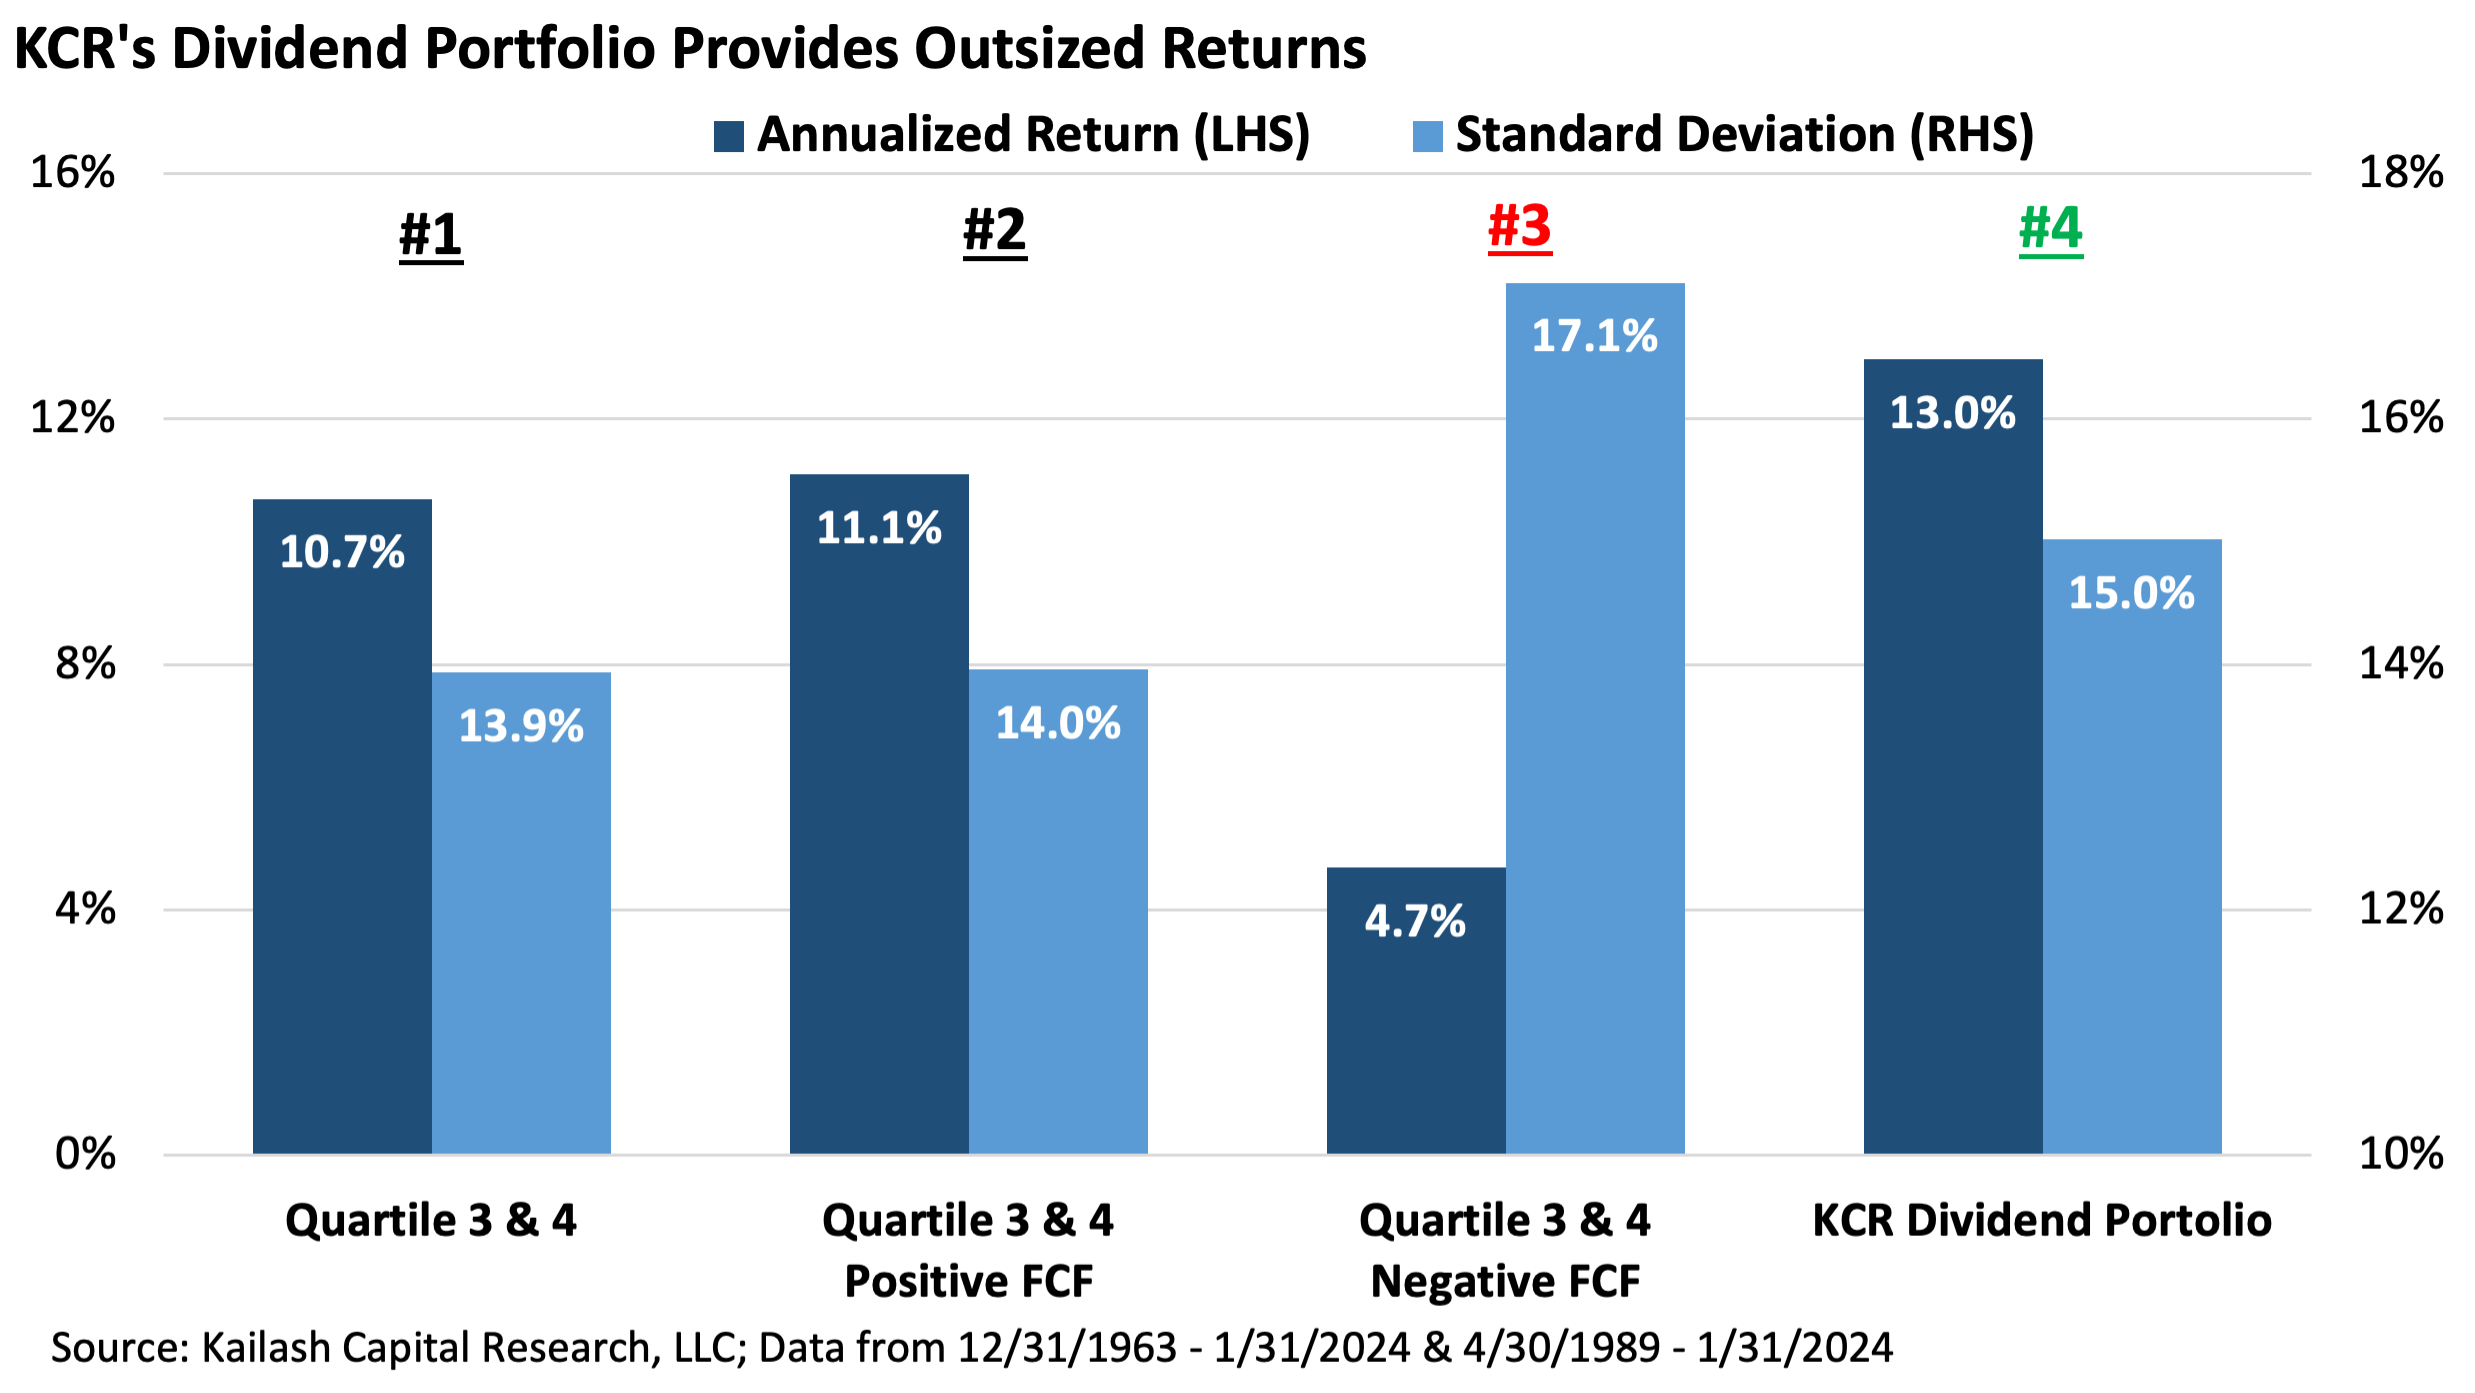
Look at the second group under “#2”. These are the stocks in the 3rd and 4th quartiles of dividend payers that have positive earnings or free cash flow. Annualized returns of 11.1% with a standard deviation of 14%.
Now move to the bars under the “red #3.” These are the stocks in Quartiles 3 and 4 of dividend payers that are losing money but still paying their investors one of the higher taxable distributions in the equity universe. If that sounds foolish, we agree, and the historical data shows just how right we all are. These stocks have a horrendous mix of 4.7% annual returns paired with 17.1% standard deviations. “Don’t buy those types of stocks” is a great starting place for improving outcomes.
The last two bars on the right, under the “green #4”, are the annualized returns (13.0%) and standard deviation (15.0%) of KCR’s Dividend Model Portfolio.[vi] We ran this portfolio against the Russell 1000 Value Index and found it produced significant excess returns.
But now let’s dive into what might be the most interesting part of this research: WHY NOW?
Value Spreads are In Our Heads: The chart below shows the P/E ratio of the Top Two Quartiles of dividend yielding stocks vs. the P/E Ratio of the KCR Dividend Portfolio since 1989. We find the following items of particular interest:
- On an absolute basis, high dividend stocks and KCR’s Dividend Portfolio have rarely been cheaper – the one exception being the trough of the GFC
- On a relative basis, the KCR Dividend Portfolio is trading at a discount to the highest dividend stocks that approximates the levels seen around the peak of the dot.com bubble
- Because KCR’s Dividend Portfolio is sector-constrained[1], unlike the high dividend universe itself, we know that our portfolio’s economic sensitivity should be roughly equivalent to the broad index

What About the Margin of Safety?
KCR has written a great deal about economic cycles and mean reversion, documenting how corporate profit margins are above the prior peak in 1929. We have been clear that the major trends of falling interest rates, rising leverage, and falling labor costs may be reversing. So, in our view, a solid strategy for assessing a dividend’s sustainability is the earnings coverage ratio.
The earnings coverage ratio takes a company’s total earnings and divides it by the total dividends paid. If the company earns $100 in profits and pays out $100 in dividends, its earnings coverage ratio is 100%. If the company earns $300 and pays out $100 in dividends, its earnings coverage ratio is 300%. The higher the earnings coverage ratio, the more economic resilience the company has to pay or increase the dividend.
The chart below shows the following in order of appearance:
- First two bars: since 1989, the average earnings coverage ratio of KCR’s Dividend Portfolio has been 261% vs. the earnings coverage ratio of the top two quartiles of dividend payers averaging only 211%.
- Second two bars: KCR’s Dividend Model Portfolio currently has an atypically high earnings coverage ratio of 281%, while the top two quartiles are sitting below their historical average at only 189%.
Very simply: our Model Portfolio offers ~100% more earnings coverage for our dividends than the top two quartiles of dividend payers as a group.

Aside from more conservative payout ratios and a long history of producing abnormally high returns, our Dividend Model Portfolio has offered powerful downside protection and diversification.
These benefits have rarely looked more important to us than in this moment of epic index concentration – something we will dive into in our next piece.
The table below shows some basic fundamentals for the Russell 1000 Value Index, the top two quartiles of dividend payers, and on the bottom row, KCR’s Dividend Model Portfolio. What do we see?
KCR’s Dividend Model Portfolio offers significantly enhanced dividend and total yields from a portfolio of stocks that trade at nearly half the valuation of the R1V based on FCF/EV and P/E ratios, all while carrying lower net/debt. The less you pay, the more you get.

For speculators in ARKK, AI, and other novelty items, we wish you and the crowd luck. For those looking to compound wealth in a reliable and safer manner, the data suggests it just isn’t that complicated…
KCR’s Dividend Model Portfolio Below


Disclaimer
The information, data, analyses, and opinions presented herein (a) do not constitute investment advice, (b) are provided solely for informational purposes and therefore are not, individually or collectively, an offer to buy or sell a security, (c) are not warranted to be correct, complete or accurate, and (d) are subject to change without notice. Kailash Capital Research, LLC and its affiliates (collectively, “KCR”) shall not be responsible for any trading decisions, damages, or other losses resulting from, or related to, the information, data, analyses or opinions or their use. The information herein may not be reproduced or retransmitted in any manner without the prior written consent of KCR. In preparing the information, data, analyses, and opinions presented herein, KCR has obtained data, statistics, and information from sources it believes to be reliable. KCR, however, does not perform an audit or seek independent verification of any of the data, statistics, and information it receives. KCR and its affiliates do not provide tax, legal, or accounting advice. This material has been prepared for informational purposes only and is not intended to provide, and should not be relied on for tax, legal, or accounting advice. You should consult your tax, legal, and accounting advisors before engaging in any transaction.
Nothing herein shall limit or restrict the right of affiliates of KCR to perform investment management or advisory services for any other persons or entities. Furthermore, nothing herein shall limit or restrict affiliates of KCR from buying, selling, or trading securities or other investments for their own accounts or for the accounts of their clients. Affiliates of KCR may at any time have, acquire, increase, decrease, or dispose of the securities or other investments referenced in this publication. KCR shall have no obligation to recommend securities or investments in this publication as a result of its affiliates’ investment activities for their own accounts or for the accounts of their clients.
© 2023 Kailash Capital Research, LLC – All rights reserved.
February 22, 2024 |
| Authors: Matthew Malgari, Nathan Przybylo, Dr. Sanjeev Bhojraj and John Durkin
February 22, 2024
Authors: Matthew Malgari, Nathan Przybylo, Dr. Sanjeev Bhojraj and John Durkin