In our recent piece, If Not Now, When?, we pounded the table on the investment merits of mid-cap stocks. Much of the thesis rests on the unforgiving valuation of the Russell 1000 Index of large cap stocks. In that piece, we demonstrated that much of the overvaluation in the large cap index came from just the 50 largest stocks. Those 50 names are now more expensive than the speculative peaks in 2000 and 2021.
Get our insights direct to your inbox: SUBSCRIBE
Today’s chart stack is designed to provoke reflection on the state of capitalism. Do you really believe companies trading at valuations without precedent for delivering meaningful returns are a safe bet? If so, why?
Do you believe the law of large numbers has been revoked? Do you really believe competition has been snuffed out? Do you believe that the most basic tenets of capitalism have been nullified? We do not.
What is an empirical certainty is the concentration of market value in a handful of stocks means the performance of indices is now at the mercy of what happens to those few companies. Equally striking is that the market cap of the largest stock, Apple, relative to the median value of all stocks has shattered all prior records.
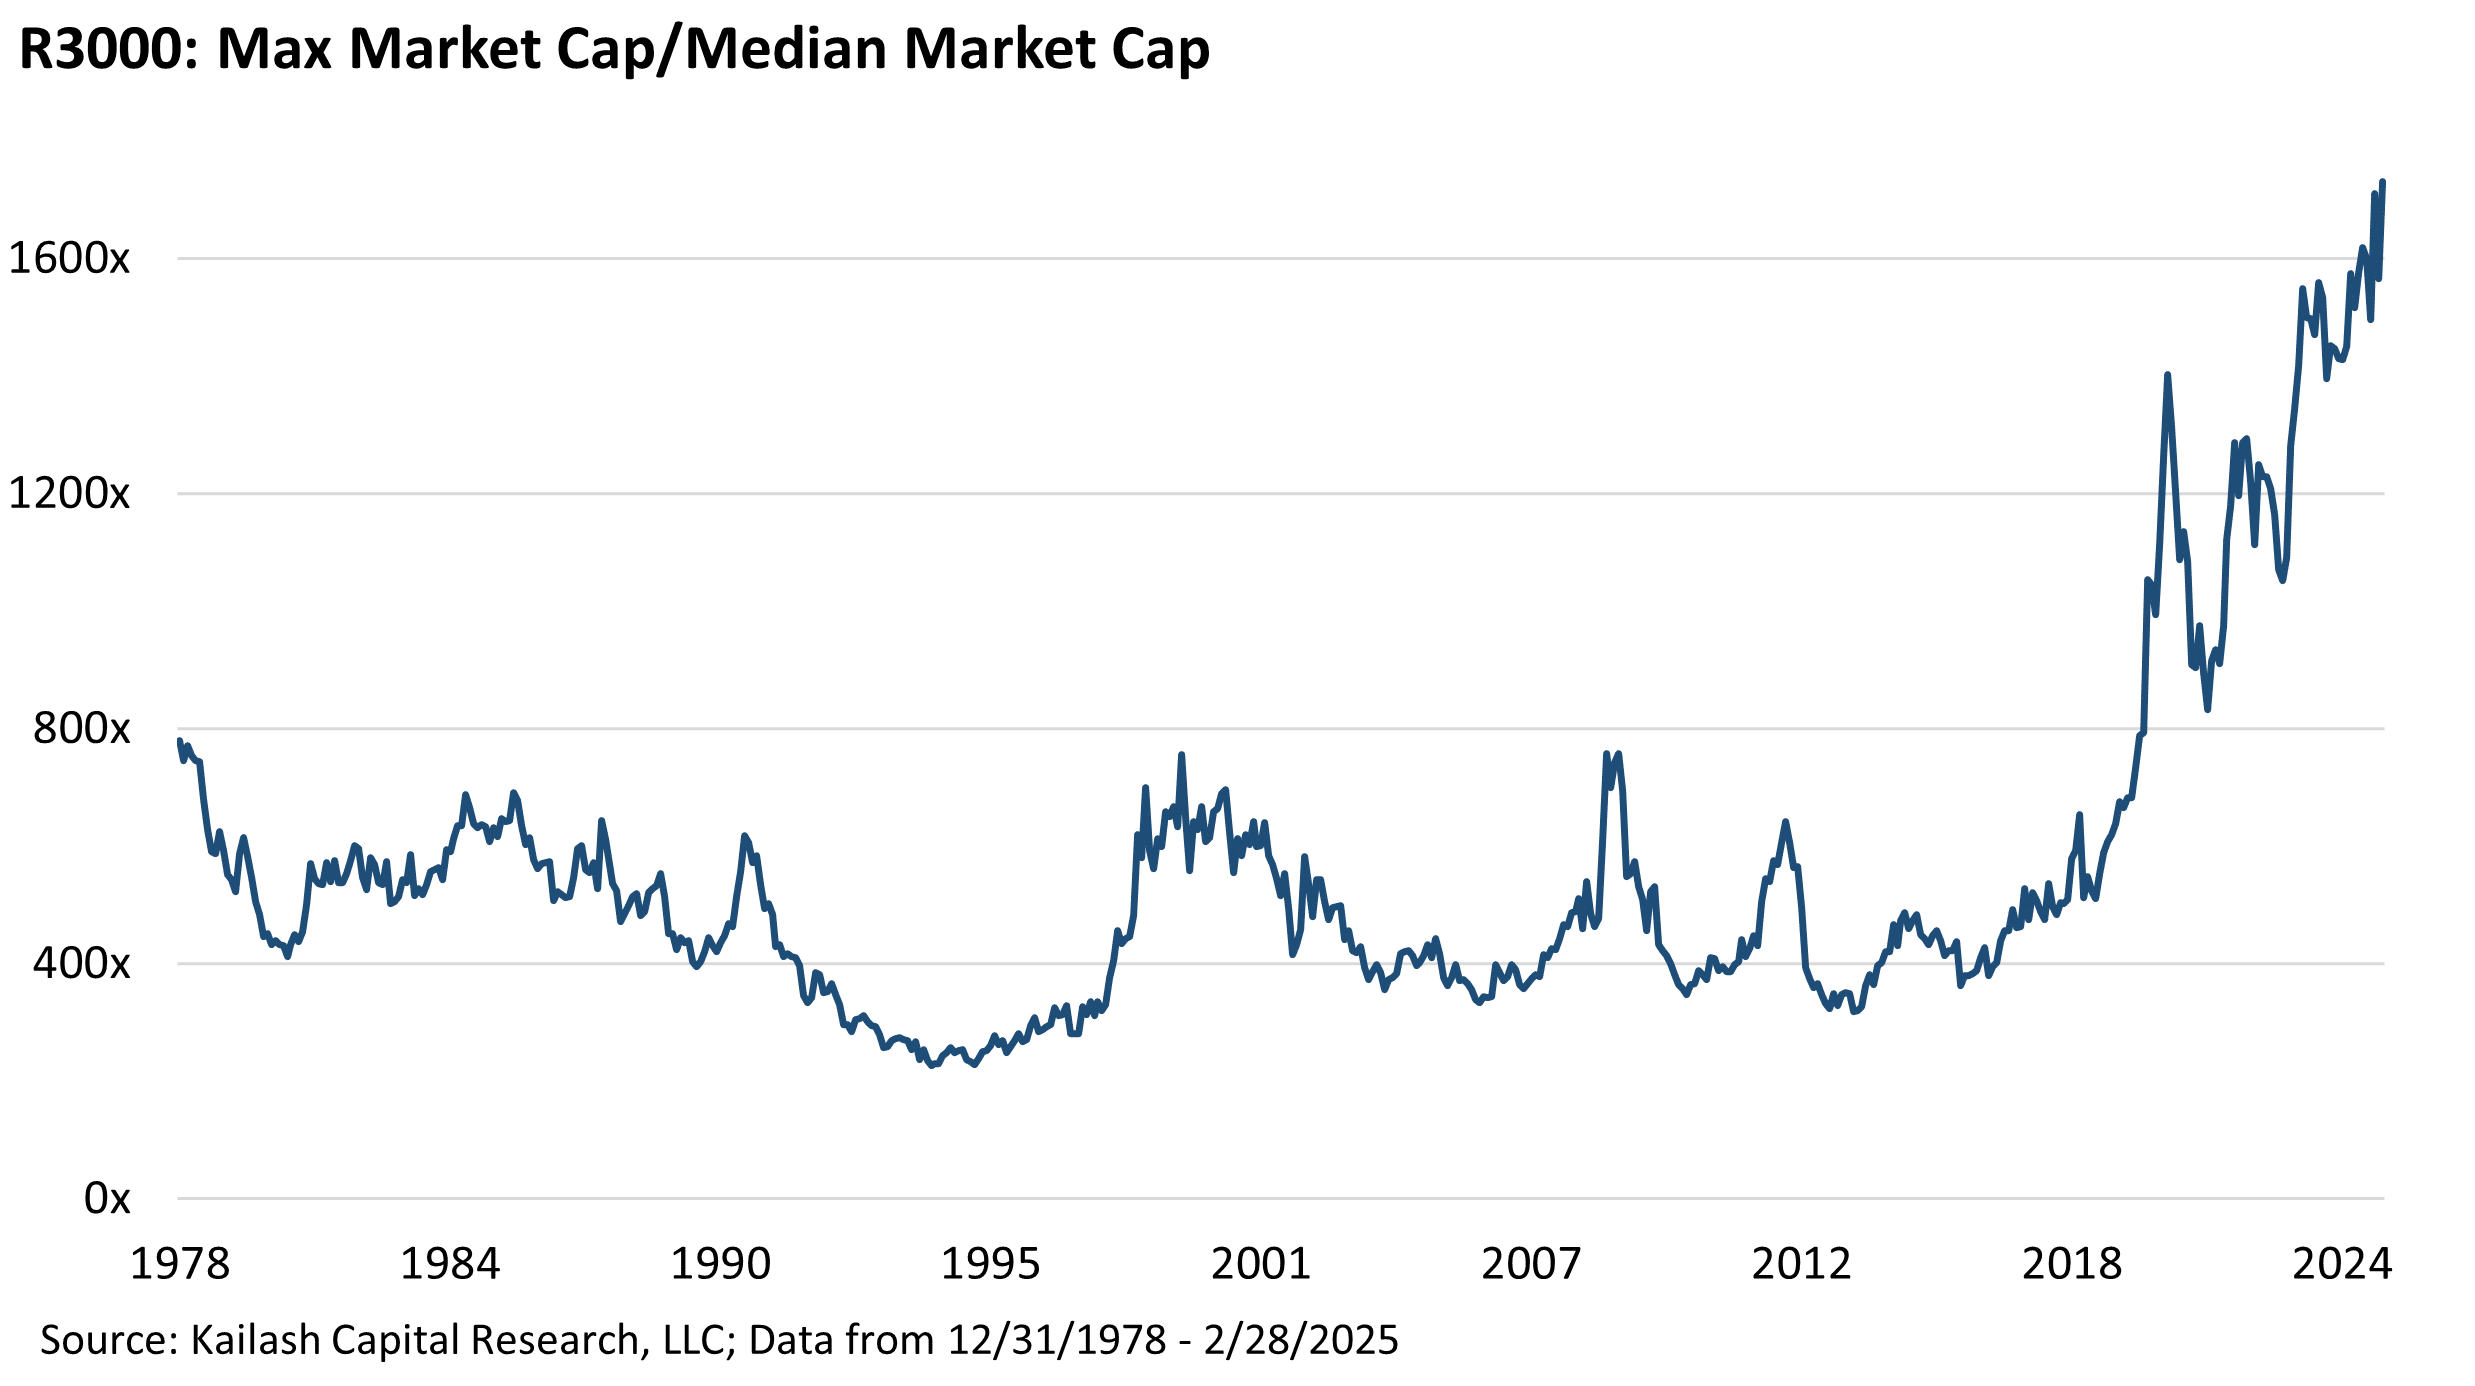
The first chart below divides the largest company’s market cap (AAPL) by the median company’s market capitalization. [1] The image is as striking as it is telling. Over 40+ years we have never seen anything like the situation today. Sometimes the most obvious investment decisions are also the most difficult.
- From 1978 – 2020, the largest stock was never more than 800x larger than the median stock. Now?
- With the indexing bubble in full swing, investors have priced the largest stock in the market as if its prosperity is so great, its future profits so certain, and its business so immune to disruption, that it is worth over 1,700x the median stock in the market – more than twice the level seen at every prior peak.
- As long-time readers know, our sister company manages an index fund and we respect the importance of cheap beta; but the message from below is that a good idea has been taken too far.
These next two charts go together and help us visualize the problem in a broader context. The top chart shows the number of firms in each market cap cohort. So, for the left-most bar, you can see there are 1,032 stocks that have a market cap of $1bn or less. At the other extreme, the right-most bar, you can see there are only 14 companies that have a market cap of $500bn or more.
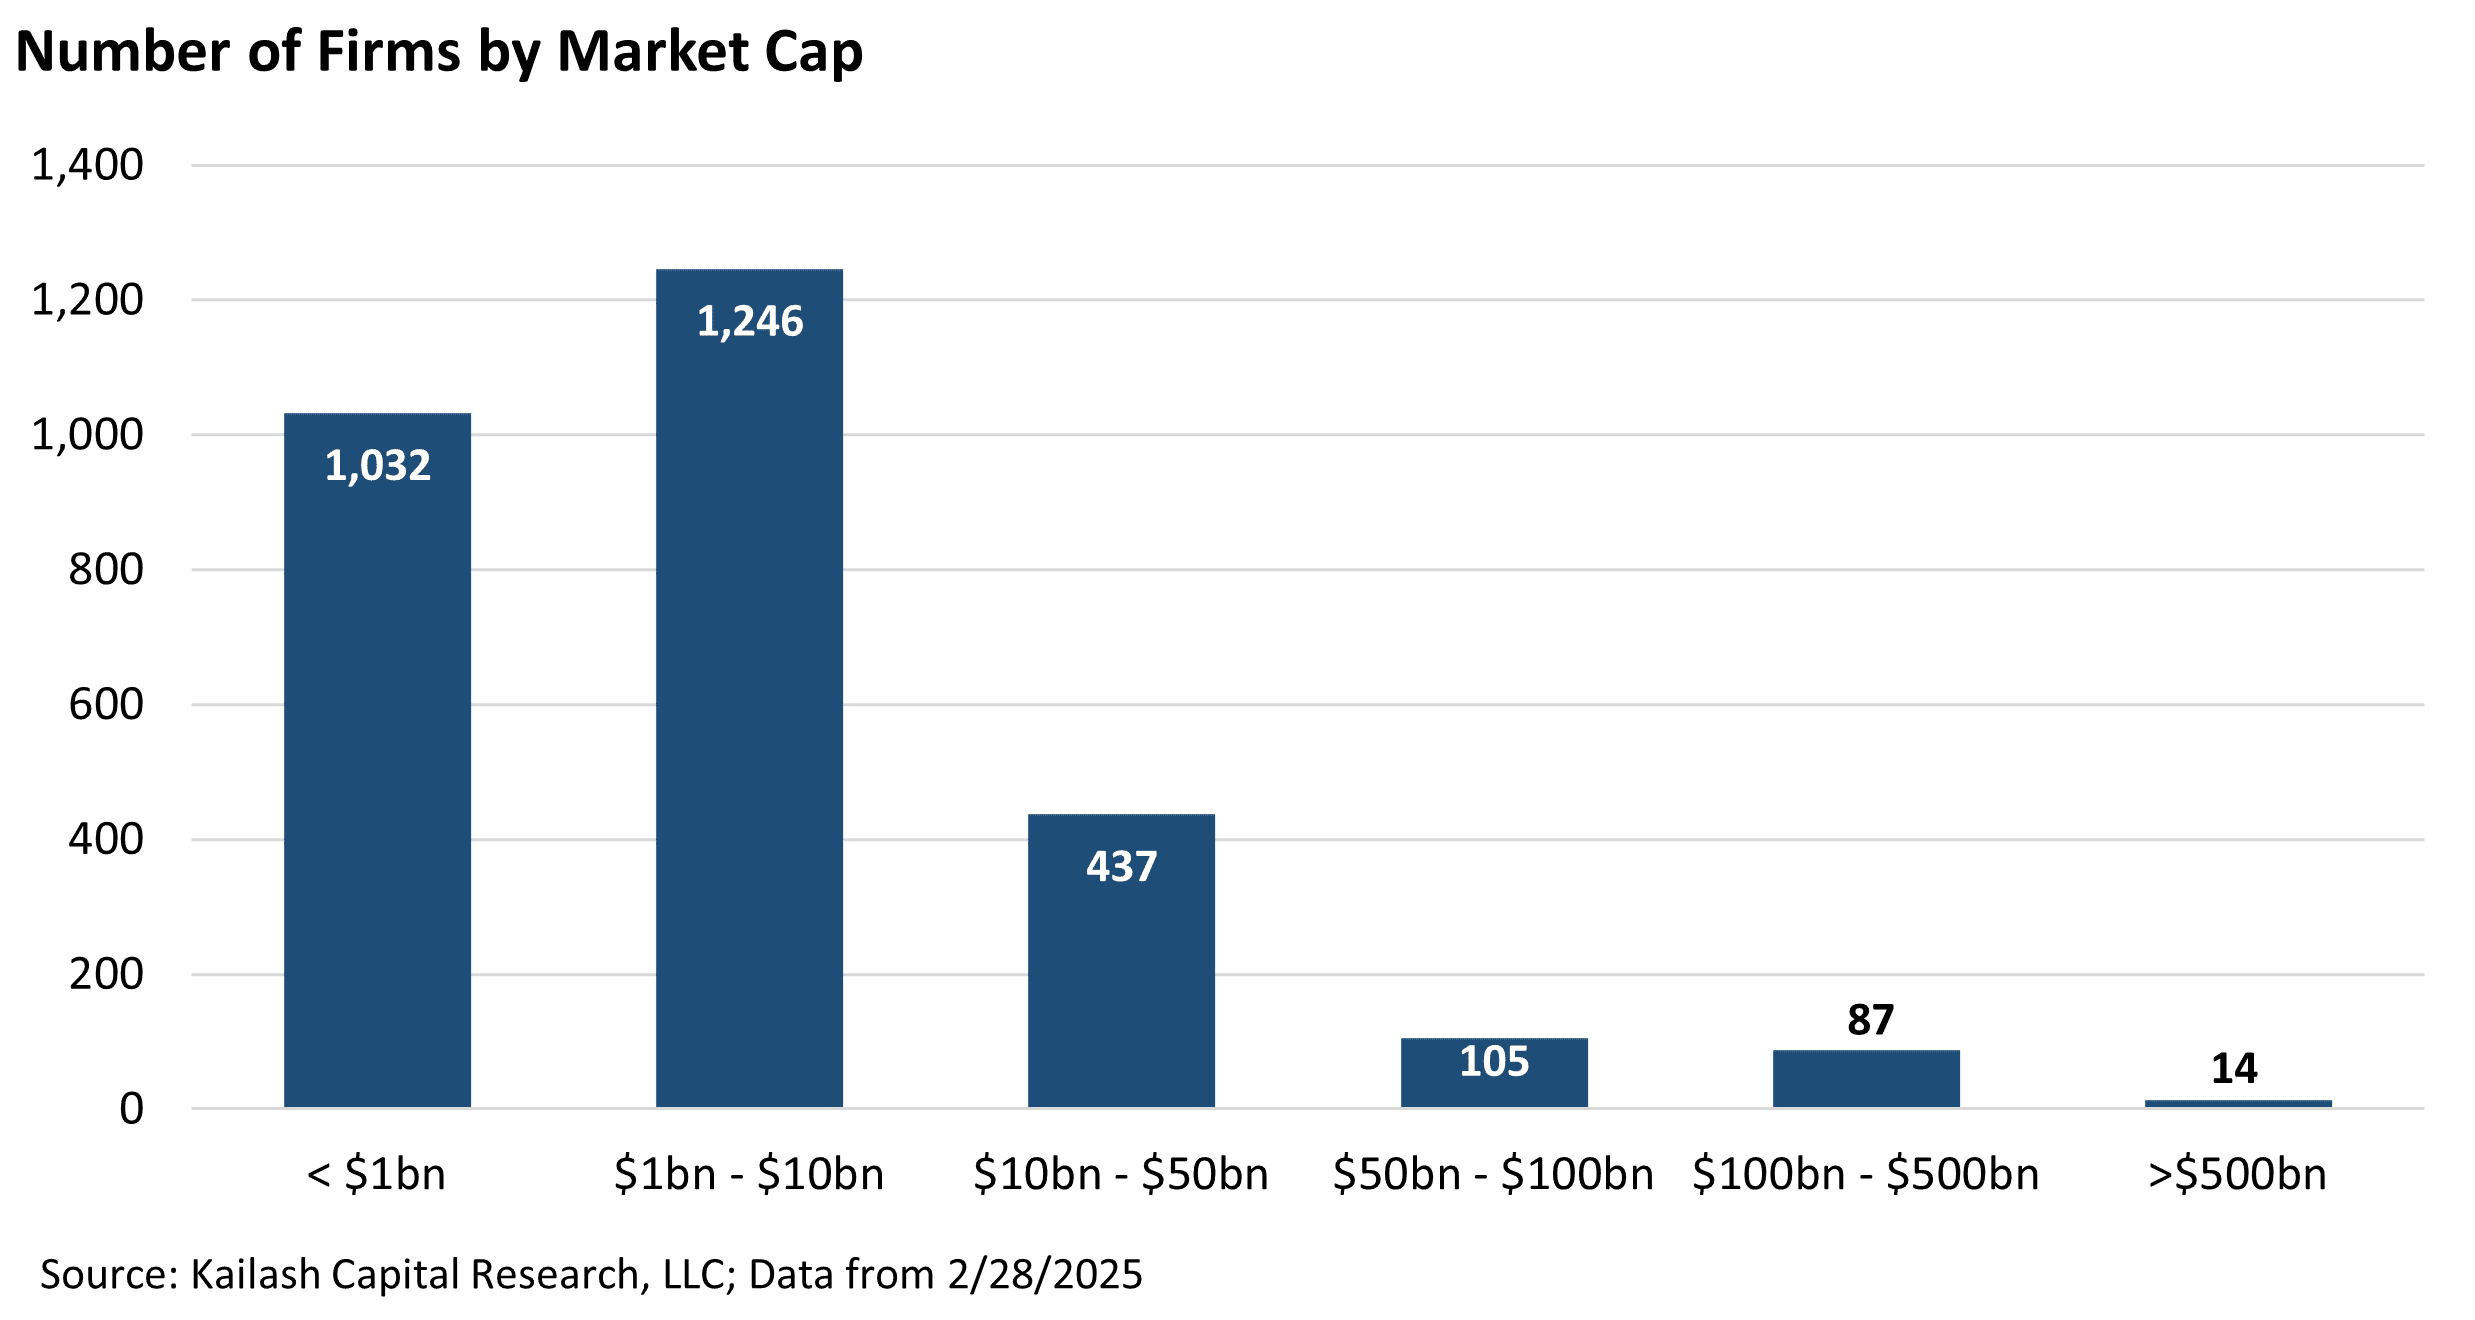

The second chart above shows the sum of the market caps of all the stocks in each bucket. So, looking at the left-most bars above, you can see that if we sum up all 1,032 stocks with a market cap below $1bn, we end up with “only” $400bn in market cap ($0.4 trillion). Looking at the right-most bar we can see the problem: those 14 companies with market caps over $500bn have a combined market value of $22 trillion dollars.
The chart below is familiar to our long-time readers. We’ve been publishing updates on it since March of 2021. It shows the percentage of the Russell 3000 Index that is valued at 10x price to sales or higher.
Why 10x price to sales? Well Scott McNealy of Sun Microsystems fame explained it in such a brief, brutal, and simple fashion that one KCR staffer’s 15 year old understood it. Here’s what he said:
‘At 10 times revenues, to give you a 10-year payback, I have to pay you 100% of revenues for 10 straight years in dividends. That assumes I can get that by my shareholders. That assumes I have zero cost of goods sold, which is very hard for a computer company. That assumes zero expenses, which is really hard with 39,000 employees. That assumes I pay no taxes, which is very hard. And that assumes you pay no taxes on your dividends, which is kind of illegal. And that assumes with zero R&D for the next 10 years, I can maintain the current revenue run rate. Now, having done that, would any of you like to buy my stock at [10x price to sales]? Do you realize how ridiculous those basic assumptions are? You don’t need any transparency. You don’t need any footnotes. What were you thinking?’
— Scott McNealy, Business Week, 2002
Now stare at that chart. Think about the index funds you own whose proponents claim they are both unbeatable (easily disproven), safe, and cheap. They are often valuable tools. But not always.
Today the data is clear: index funds are a cheap way to engage in performance chasing the biggest and most overpriced stocks seen in market history. While you’re owning that and feeling clever, Warren Buffett is sitting on $300bn+ of Treasuries. Good investment processes need not be complicated. Particularly at extremes.

Our critics might point to our work and very fairly gripe:
“You KCR people been complaining about these stocks valued at over 10x price to sales since March of 2021 and you’ve been wrong.”
On the surface, there is a great deal of merit to such criticism.
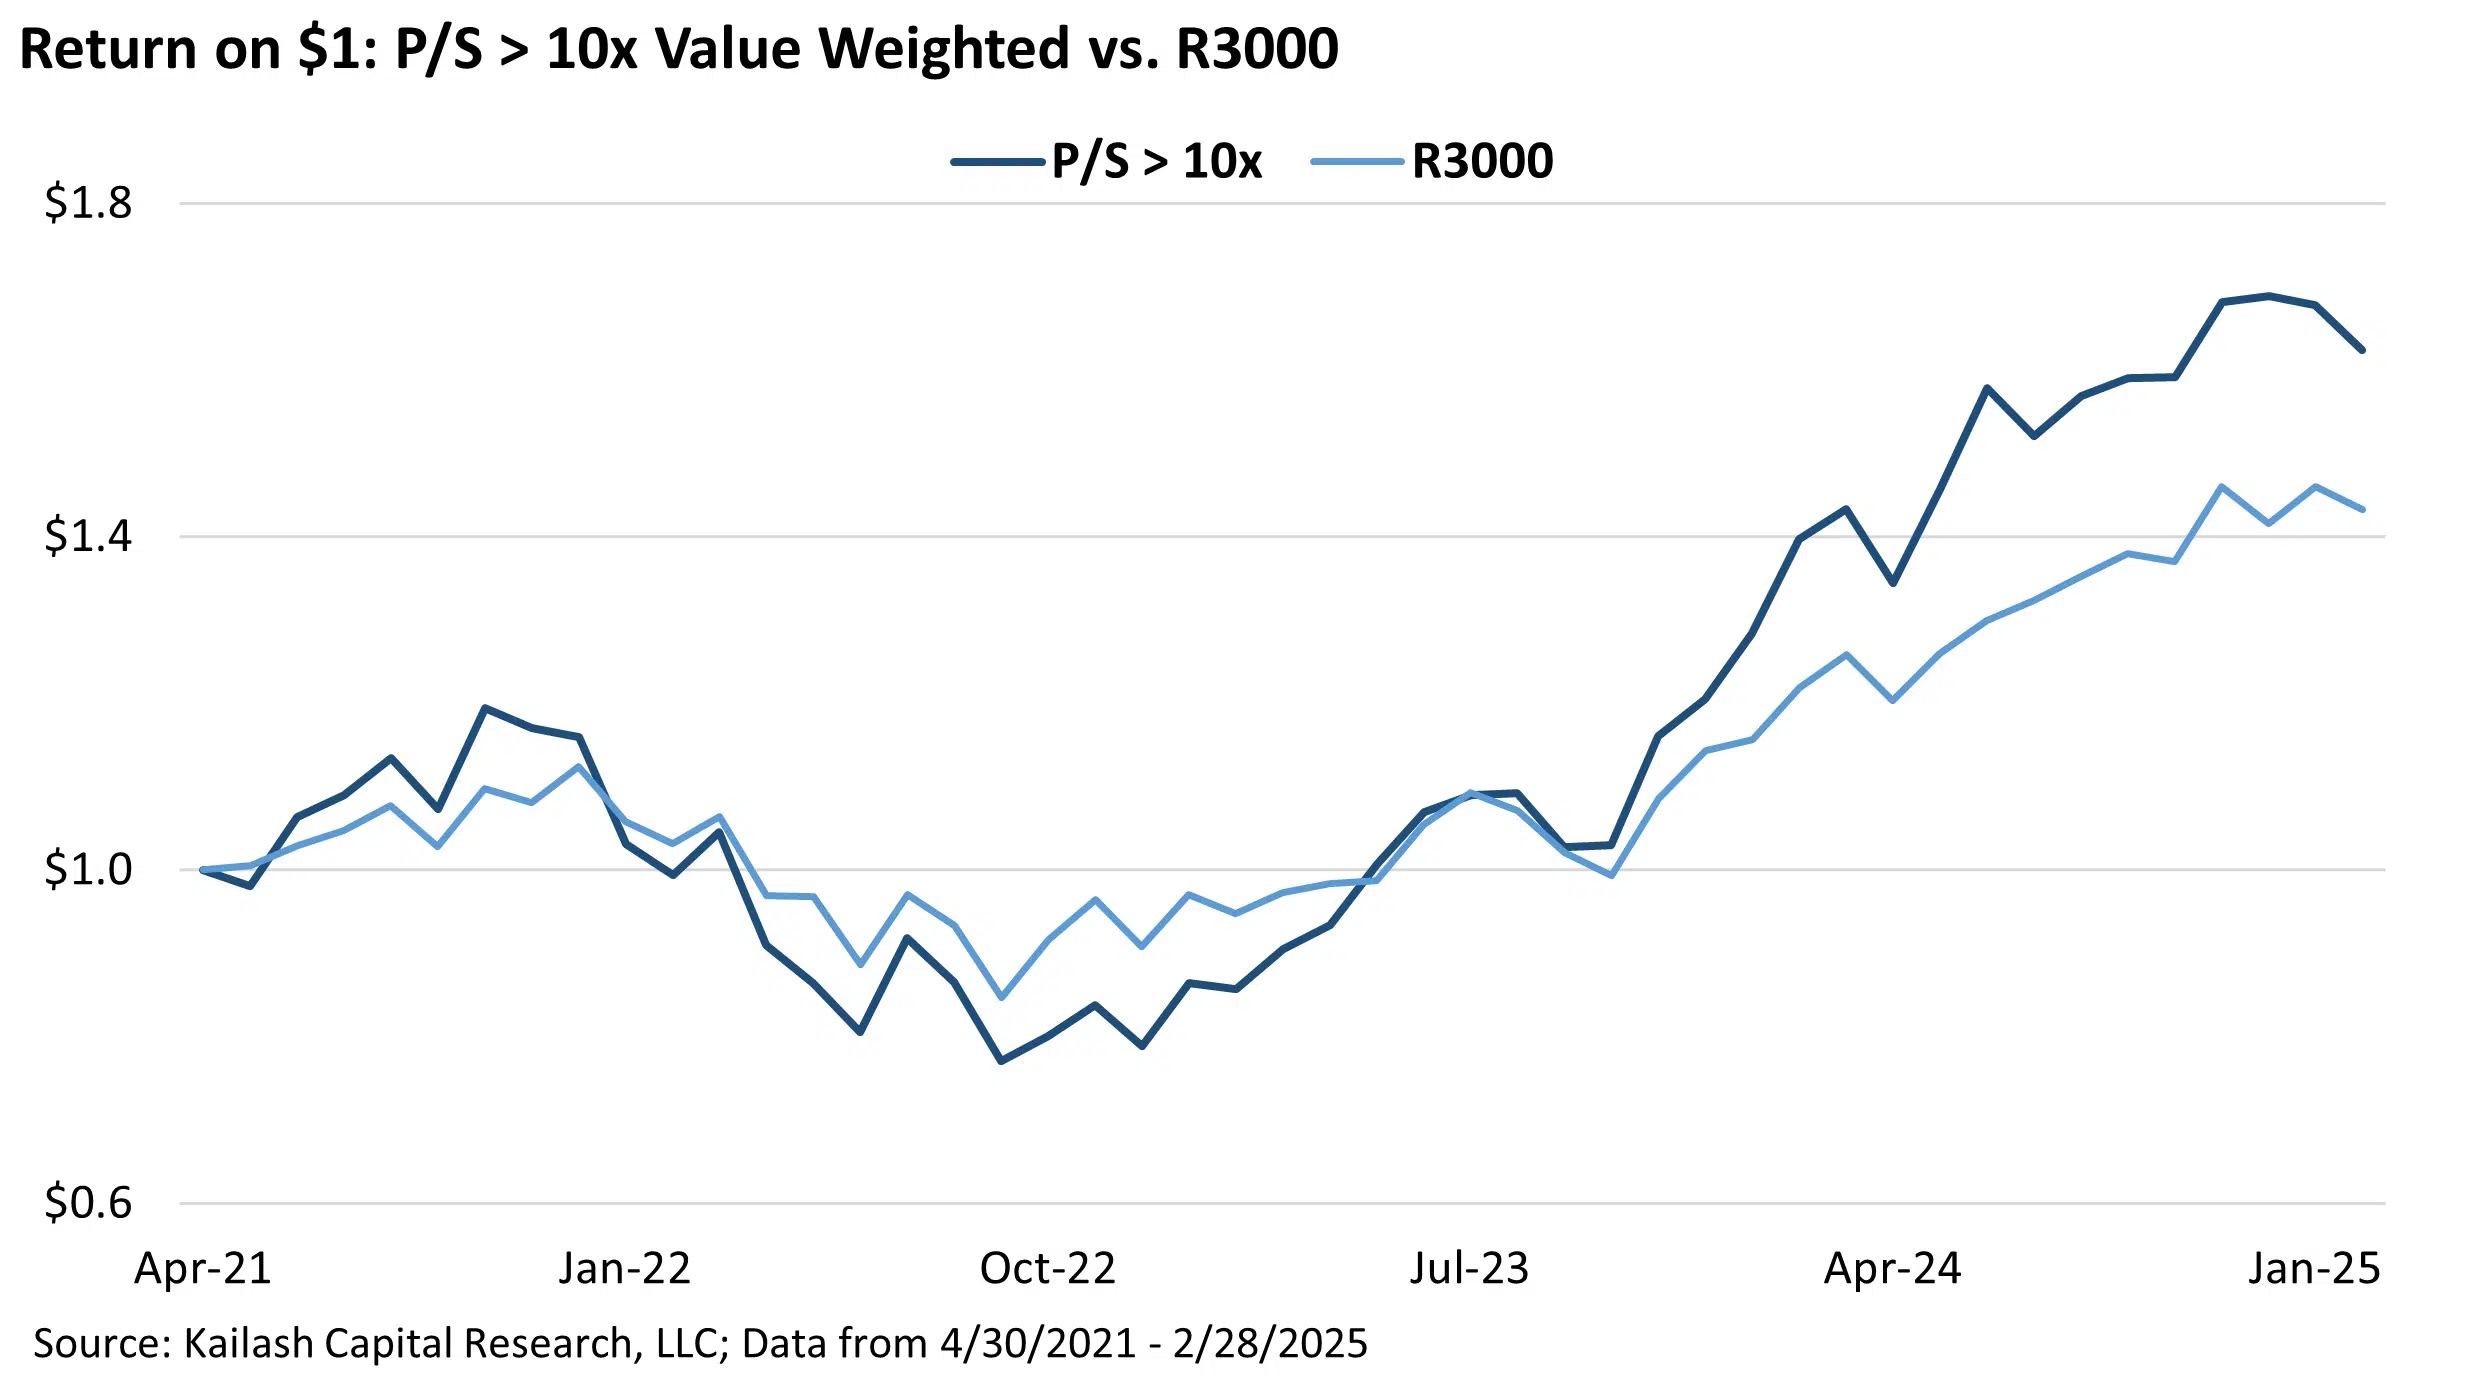
The chart below shows the compound returns of investors in the Russell 3000 Index compared to the returns of the stocks valued with a price to sales (“P/S”) ratio equal to, or greater than, 10x (“P/S > 10x”).
The market’s most expensive stocks, those with a P/S > 10x in navy blue, would have turned $1 invested in them into $1.62. A 62% gain.
Now look at the owners of the Russell 3000 Index in light blue. Holders of the broad market index saw their $1 rise by “only” 43% to $1.43.
We would be the first people to tell you that we cannot time markets.
We also readily acknowledge that despite the passage of ~4 years, markets have not punished the overpriced – they have embraced them and sent them soaring to new heights.
But we would also be quick to tell you that arithmetically blind investing has never been more popular than in today’s index rich and by definition, valuation and quality agnostic, world.
Yet we would suggest that the navy blue line, the return on stocks over 10x price to sales, is a misleading one. Here’s why
- When we originally published our “attack” on the idiocy of investing in stocks priced at over 10x price to sales in March of 2021, there were 622 number of names meeting that valuation criteria
- Over the three years following publication, only 17% of those names have outperformed the Russell 3000
- In fact, 83% of the names actually underperformed the broad benchmark by 48% on average
Why does this matter?
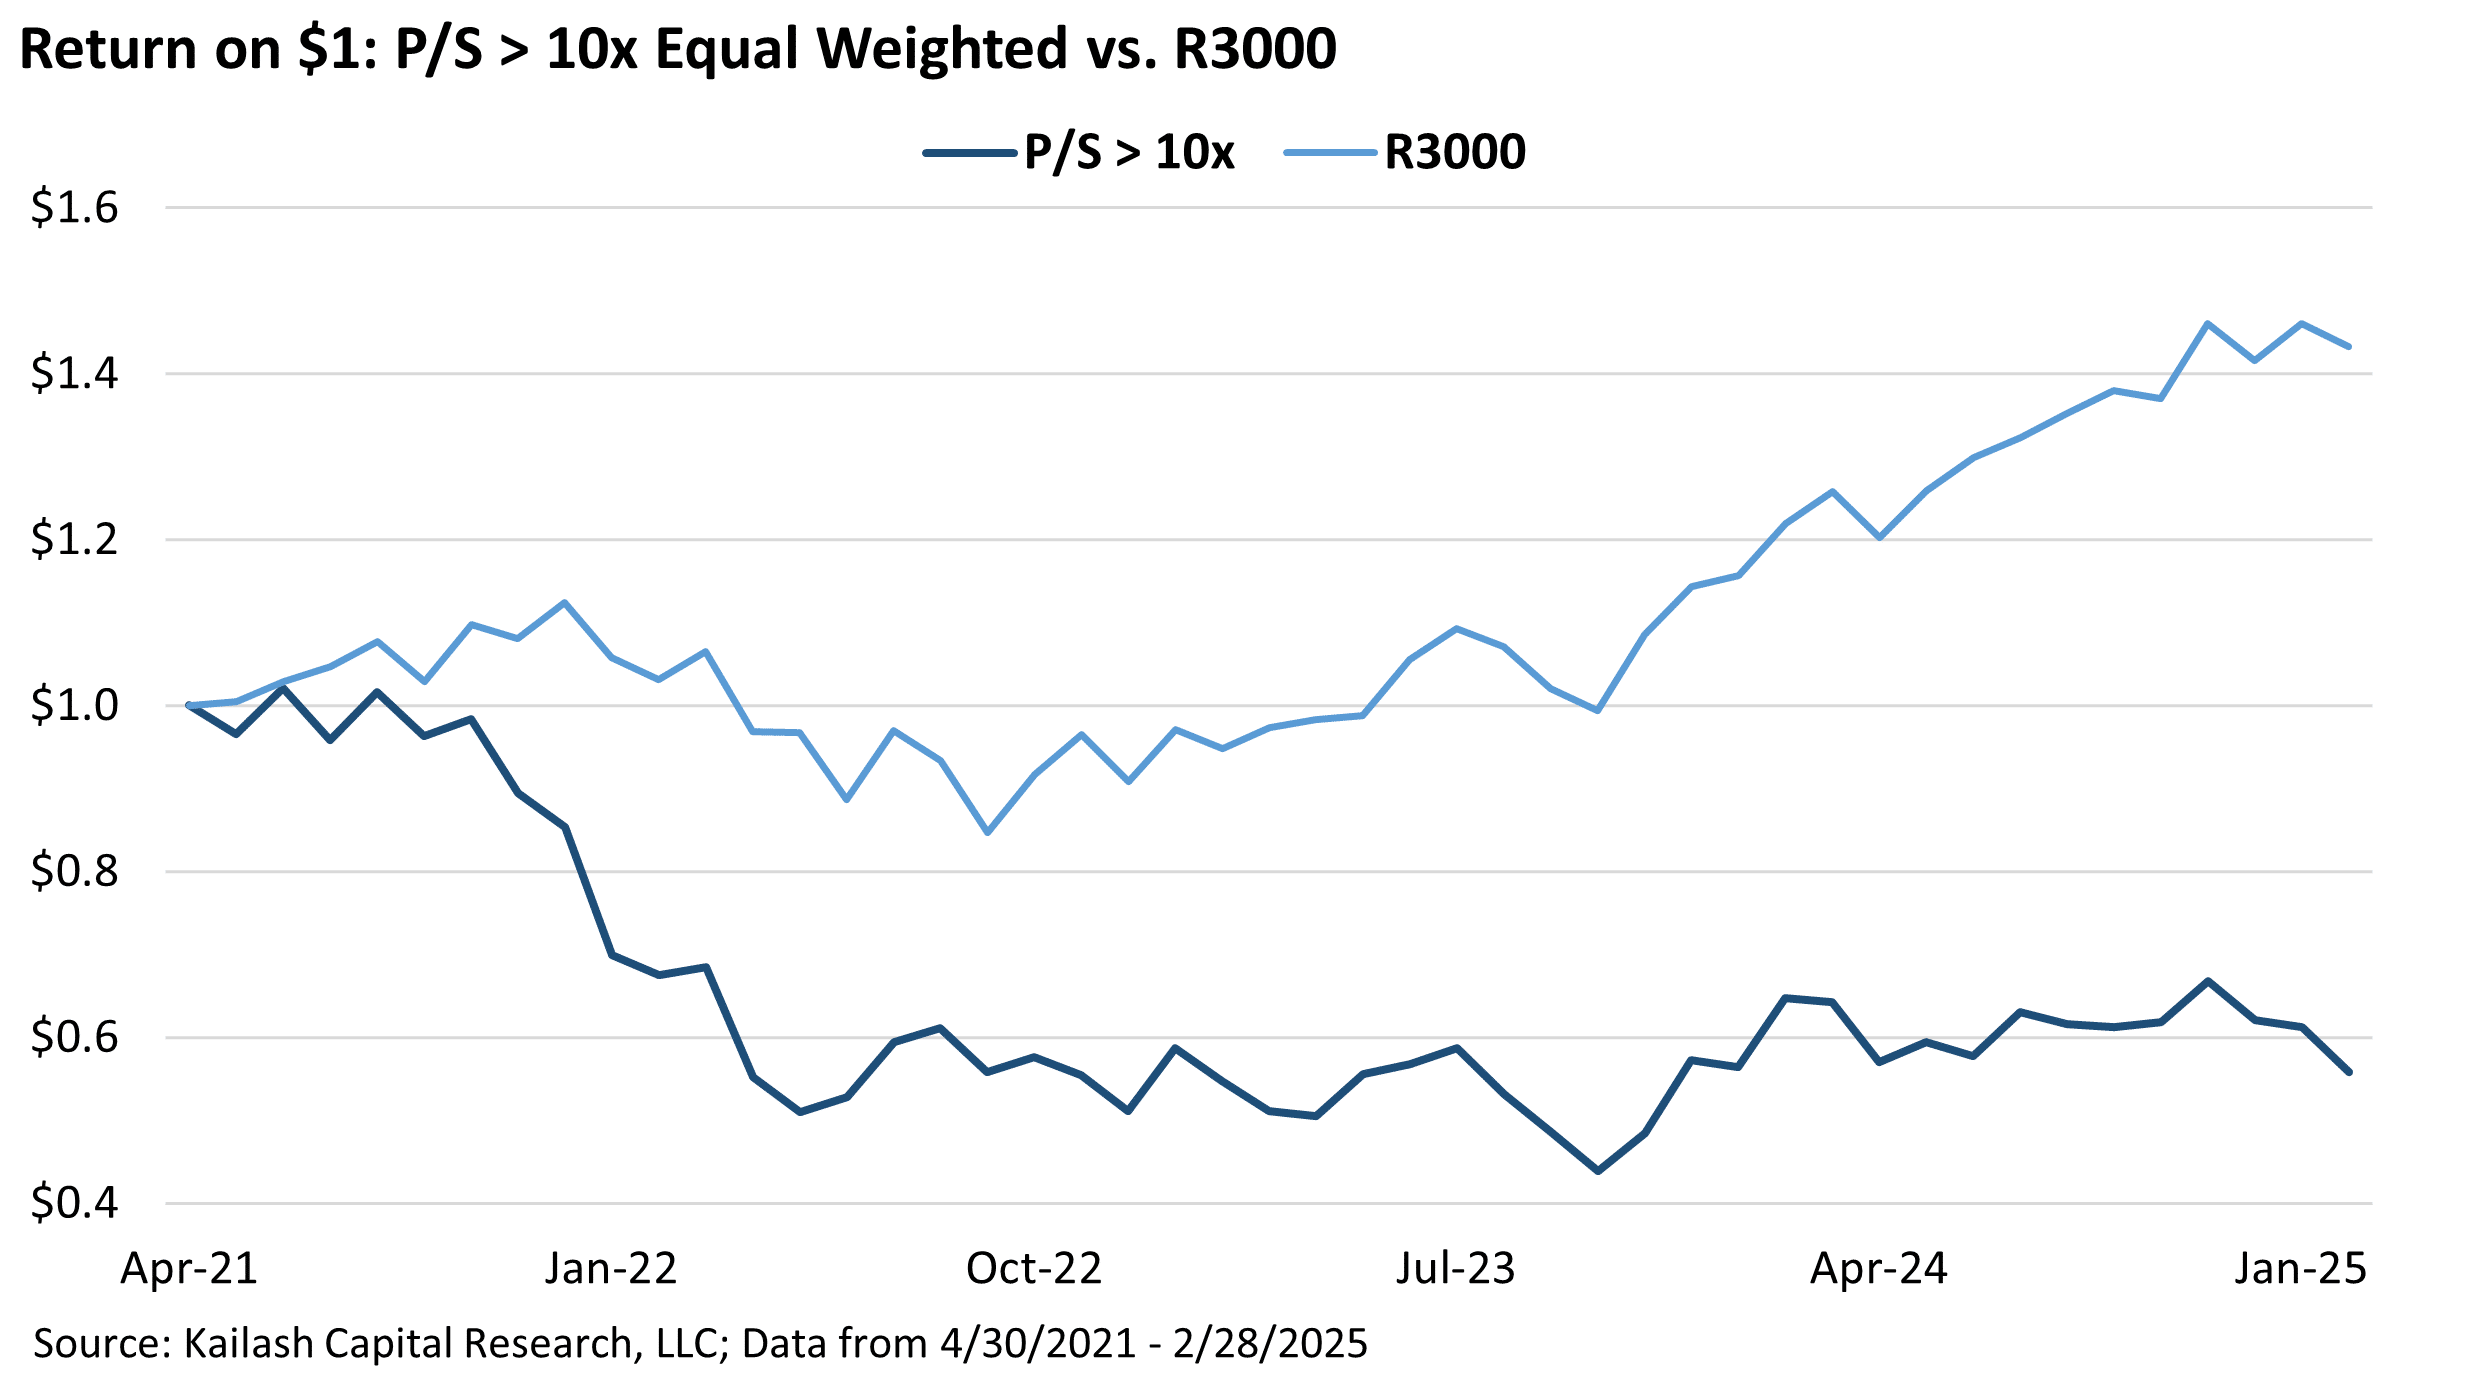
The reason these details are so crucial is that it shows us just how concentrated the returns have been. One of the easiest ways to understand this is to look at the equally weighted returns of the stocks valued over 10x price to sales since March of 2021.
The chart below keeps the light blue line, the return on $1 invested in the Russell 3000 since March of 2021. But now the navy blue line, the return on stocks over 10x price to sales, is calculated weighting every one of these expensive stocks equally.
The impact on returns is as profound as the message it sends:
- On an equally weighted basis, investing in stocks > 10x P/S has been an unmitigated disaster
- That group has taken $1 and sawed it into just 56 cents – requiring investors in the cohort to nearly double their money to just breakeven
- This also suggests that the batting average within stocks over 10x P/S has been a debacle
This foots with the inevitable consequences of investing in richly priced glamour stocks: the payoffs become increasingly volatile. Said simply: what you pay for any asset – no matter the quality – matters.
In KCR’s next piece we will delve into the horrifying payoffs of investing in stocks valued at 20x price to sales. The work will provide a brief and brutal take-down of just how foolish this is using the historical evidence. While this is so very simple, investors today continue to indulge in an empirically reckless and intellectually feckless game of excessive extrapolation.
For a quick reminder on this behavioral death-trap please see our pieces Nvidia: A Quick Example of Excessive Extrapolation and our research Excessive Extrapolation & Stock Based Compensation.
For the rapidly growing list of Financial Advisors that read our work we believe your role in protecting clients’ wealth has never been more valuable than today. The simple act of getting some of your client’s money into products that are either evidence-based active programs or, even, simply diversifying into products that are not cap weighted may prove invaluable over the next decade.
We close on the following page by driving our readers’ eyes on some of the least popular, least crowded, and possibly most promising asset classes we have seen in our careers.
For the purposes of diversification, there is no denying that a great deal can be achieved through the careful selection of other passive vehicles. Structures that use simple equal weighting methodologies to – perish the thought – invest in some non-US equities, are both interesting.
But we will let this page serve as evidence for our high-conviction belief that the best results over the next decade will come from evidence based active managers. Those who can and have enumerated the lessons of centuries of behavioral errors, identified the market’s record inefficiencies, and have products built to exploit the surfeit of “prime rib priced like hamburger meat” that are so abundant today.
Recent work has focused on the extreme opportunities in Mid Cap, Micro Cap, and Small Cap stocks. The table below uses a simple but powerful form of valuation, the free cash flow yield, of various benchmarks to KCR’s simple, low turnover, and tax efficient model portfolios in Midcaps, Small Cap Growth, and Microcaps.

The message has never been easier to understand:
- Investing in the microcap index, left-most bar, exposes you to a collection of stocks that, in aggregate, are burning an incredible amount of cash
- While the small cap Russell 2000 Index is marginally better with a 1% positive free cash flow yield, that still means you are paying 100x cash flow by investing in that index fund
- Looking at the Russell 1000 Growth, Core, and Value benchmarks, across all three indexes you are paying between 50x cash flow (2% FCF Yield) for growth to 30x cash flow (R1000 Core & R1000 Value)
- The last four bars show the free cash flow yield of KCR’s model portfolios in Small Cap GARP, Midcaps, and our Micro Portfolios
- We think it is critical that readers understand that we are not just some deep value shop – our models seek out firms that are above average in earnings quality and balance sheet quality as well as emphasizing valuation
Not only are the stocks in our Model Portfolios trading at a vast discount to their respective benchmarks but the “cheapness” is available despite all those portfolios possessing higher quality stocks.
For Financial Advisors who would like to learn about our institutional commercial partners – all of whom have 10 – 30 year track records of benchmark beating returns combined with modest fees and tax awareness, please let us know.
Please find below a list of the top 10 picks stocks in our Midcap, Small Cap GARP and Micro:


Disclaimer
The information, data, analyses, and opinions presented herein (a) do not constitute investment advice, (b) are provided solely for informational purposes and therefore are not, individually or collectively, an offer to buy or sell a security, (c) are not warranted to be correct, complete or accurate, and (d) are subject to change without notice. Kailash Capital Research, LLC and its affiliates (collectively, “KCR”) shall not be responsible for any trading decisions, damages, or other losses resulting from, or related to, the information, data, analyses or opinions or their use. The information herein may not be reproduced or retransmitted in any manner without the prior written consent of KCR. In preparing the information, data, analyses, and opinions presented herein, KCR has obtained data, statistics, and information from sources it believes to be reliable. KCR, however, does not perform an audit or seek independent verification of any of the data, statistics, and information it receives. KCR and its affiliates do not provide tax, legal, or accounting advice. This material has been prepared for informational purposes only and is not intended to provide, and should not be relied on for tax, legal, or accounting advice. You should consult your tax, legal, and accounting advisors before engaging in any transaction.
Nothing herein shall limit or restrict the right of affiliates of KCR to perform investment management or advisory services for any other persons or entities. Furthermore, nothing herein shall limit or restrict affiliates of KCR from buying, selling, or trading securities or other investments for their own accounts or for the accounts of their clients. Affiliates of KCR may at any time have, acquire, increase, decrease, or dispose of the securities or other investments referenced in this publication. KCR shall have no obligation to recommend securities or investments in this publication as a result of its affiliates’ investment activities for their own accounts or for the accounts of their clients.
© 2023 Kailash Capital Research, LLC – All rights reserved.
March 14, 2025 |
| Authors: Matthew Malgari, Nathan Przybylo, Dr. Sanjeev Bhojraj and John Durkin
March 14, 2025
Authors: Matthew Malgari, Nathan Przybylo, Dr. Sanjeev Bhojraj and John Durkin