
“The private credit market has grown to the size where there is no edge other than the fake attraction of not having to mark their assets accurately and showing artificially low volatility. The space is competing for the same deals as the public market. So, the original concept where it was smaller specialty deals and the lenders had to pay up and give special terms is simply gone. There are a lot of problems in these private portfolios that simply haven’t been marked-to-market.”
So said a long-time friend of KCR. Having successfully navigated the intermittently turbulent waters of high-yield investing for over 30 years, when he talks, we listen. KCR believes his comments may be a succinct and accurate appraisal of the potential fiction occurring in private markets today.
Today’s piece is a simple presentation of publicly available facts followed by some insights from Berkshire Hathaway’s Buffett and Munger on credit markets and bond investing.
Get our insights direct to your inbox: SUBSCRIBE
In our April 2022 missive, “Private Equity Returns: Are Private Markets Safe?,” KCR revisited the interesting arithmetic underpinning private valuations. Around the same time, Blackstone published an alternate view. Citing data through year-end 2021, their piece “Private Credit’s Rapid Growth: A Secular Trend” explained that private credit, now 30% of the debt market, is a growth story for good reason.
They lead with the chart below. In it, you see that “Private Credit” has returned[1] nearly 4x Treasuries with almost the same risk. You can also see that the asset class has nearly doubled the returns of Senior Loans with less than half the risk. Quite an achievement. (Red box is ours.)
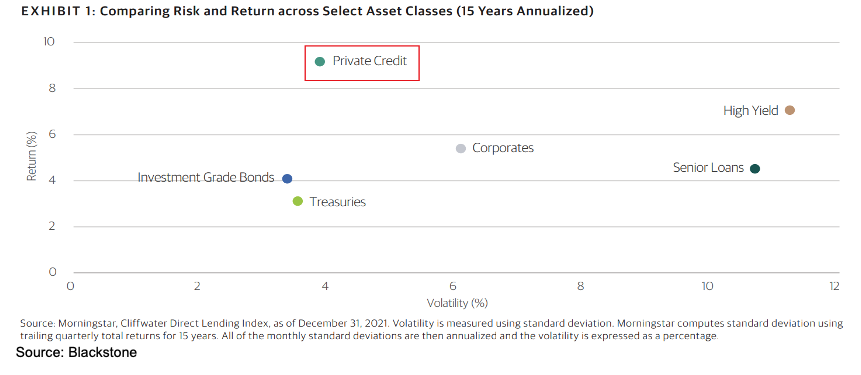
Designed to elicit admiration for an asset-class that some suggest has been the biggest beneficiary of interest rates plumbing 5,000-year lows, we find the image provocative. As the exhibit explains, the returns and volatility for “Private Credit” are sourced from the Cliffwater Direct Lending Index (“CDLI”). As Cliffwater’s fact page explains, the CDLI “…seeks to measure the unlevered, gross of fee performance of U.S. middle market corporate loans…that tracks performance of private middle market loans, the largest segment of the private credit market.”
With that in mind, let’s peruse the footnotes Blackstone provides, where they explain how their private credit structure, BCRED, differs from the indexes in the chart. Highlights ours.
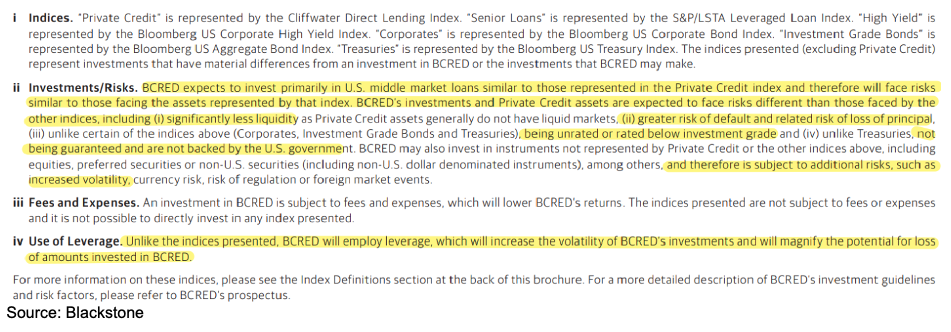
The footnotes are a testament to transparency and caution. BCRED will make loans similar to those in the Cliffwater index. But Blackstone cautions that BCRED faces different risks than the other indexes. Specifically:
Vs. Public Credit Indexes
- less liquidity
- greater risk of default and loss of principal
- unlike investment grade bonds and US Treasury bonds, BCRED’s assets may lack an investment rating and lack the guarantee of the US government
Vs. Public and Private Credit Indexes
- the inclusion of equities, preferreds, and non-US equities will cause increased volatility and…
- unlike the index, the application of leverage will also increase volatility
2022 would prove to be a harrowing year for nearly every asset class as the Fed embarked on the fastest hiking cycle in 40 years. The chart below shows the performance of various indexes and BCRED’s net returns in 2022.
Considering their returns are net, the incremental leverage, lack of liquidity, and other disclosures about factors that would increase volatility, BCRED’s performance in such a volatile year is truly incredible.


Disclaimer
The information, data, analyses, and opinions presented herein (a) do not constitute investment advice, (b) are provided solely for informational purposes and therefore are not, individually or collectively, an offer to buy or sell a security, (c) are not warranted to be correct, complete or accurate, and (d) are subject to change without notice. Kailash Capital Research, LLC and its affiliates (collectively, “KCR”) shall not be responsible for any trading decisions, damages, or other losses resulting from, or related to, the information, data, analyses or opinions or their use. The information herein may not be reproduced or retransmitted in any manner without the prior written consent of KCR. In preparing the information, data, analyses, and opinions presented herein, KCR has obtained data, statistics, and information from sources it believes to be reliable. KCR, however, does not perform an audit or seek independent verification of any of the data, statistics, and information it receives. KCR and its affiliates do not provide tax, legal, or accounting advice. This material has been prepared for informational purposes only and is not intended to provide, and should not be relied on for tax, legal, or accounting advice. You should consult your tax, legal, and accounting advisors before engaging in any transaction.
Nothing herein shall limit or restrict the right of affiliates of KCR to perform investment management or advisory services for any other persons or entities. Furthermore, nothing herein shall limit or restrict affiliates of KCR from buying, selling, or trading securities or other investments for their own accounts or for the accounts of their clients. Affiliates of KCR may at any time have, acquire, increase, decrease, or dispose of the securities or other investments referenced in this publication. KCR shall have no obligation to recommend securities or investments in this publication as a result of its affiliates’ investment activities for their own accounts or for the accounts of their clients.
© 2023 Kailash Capital Research, LLC – All rights reserved.