With Leveraged Single-Stock ETFs, Most Don’t Understand How the Game Actually Works
Leveraged ETFs – You’re Better Off Spinning a Roulette Wheel
Leveraged ETFs look like a shortcut: twice (or three times) the action of a stock, in a tidy wrapper you can buy in a brokerage account. The problem—explained plainly in this paper—is that the shortcut is built on a misunderstanding. These funds are engineered to deliver a multiple of the underlying’s return or one day, then they reset and do it again the next day. That daily reset means the experience of holding a leveraged ETF for more than a day will not deliver the headline multiple of the stock’s return. It’s a different product with different math—one where the path the stock takes matters as much as (and sometimes more than) where it ends up.
Get our insights direct to your inbox: SUBSCRIBE
The first flaw is the one investors trip over most: compounding plus volatility creates drag. Gains and losses don’t cancel out neatly in real life because returns are geometrically linked: a loss results in a smaller base, and recovering requires a larger percentage gain. This effect gets harsher when you multiply the daily ups and downs by 2x or 3x. So even if you’re “right” about the stock over time, a choppy path can steadily erode the ETF’s value—sometimes dramatically—through volatility decay.
Then comes the second flaw: the real-world cost of manufacturing leverage. These funds typically rely on derivatives, and the “rent” on those derivatives tends to rise when the underlying gets more volatile—exactly when leveraged ETF holders are already fighting volatility drag. Volatility doesn’t just hurt you through compounding—it can also raise the toll you pay for leverage while you’re getting hurt.
The bottom line is blunt: leveraged ETFs are trading instruments, not investments. They can do what they say on the label—deliver a daily multiple—but holding them longer turns your outcome into a bet on volatility and path, not just direction. Even if an investor turns out to be right about the direction of the stock, the return from holding one of these ETFs for more than one day will be dragged down by volatility and volatility-driven costs.
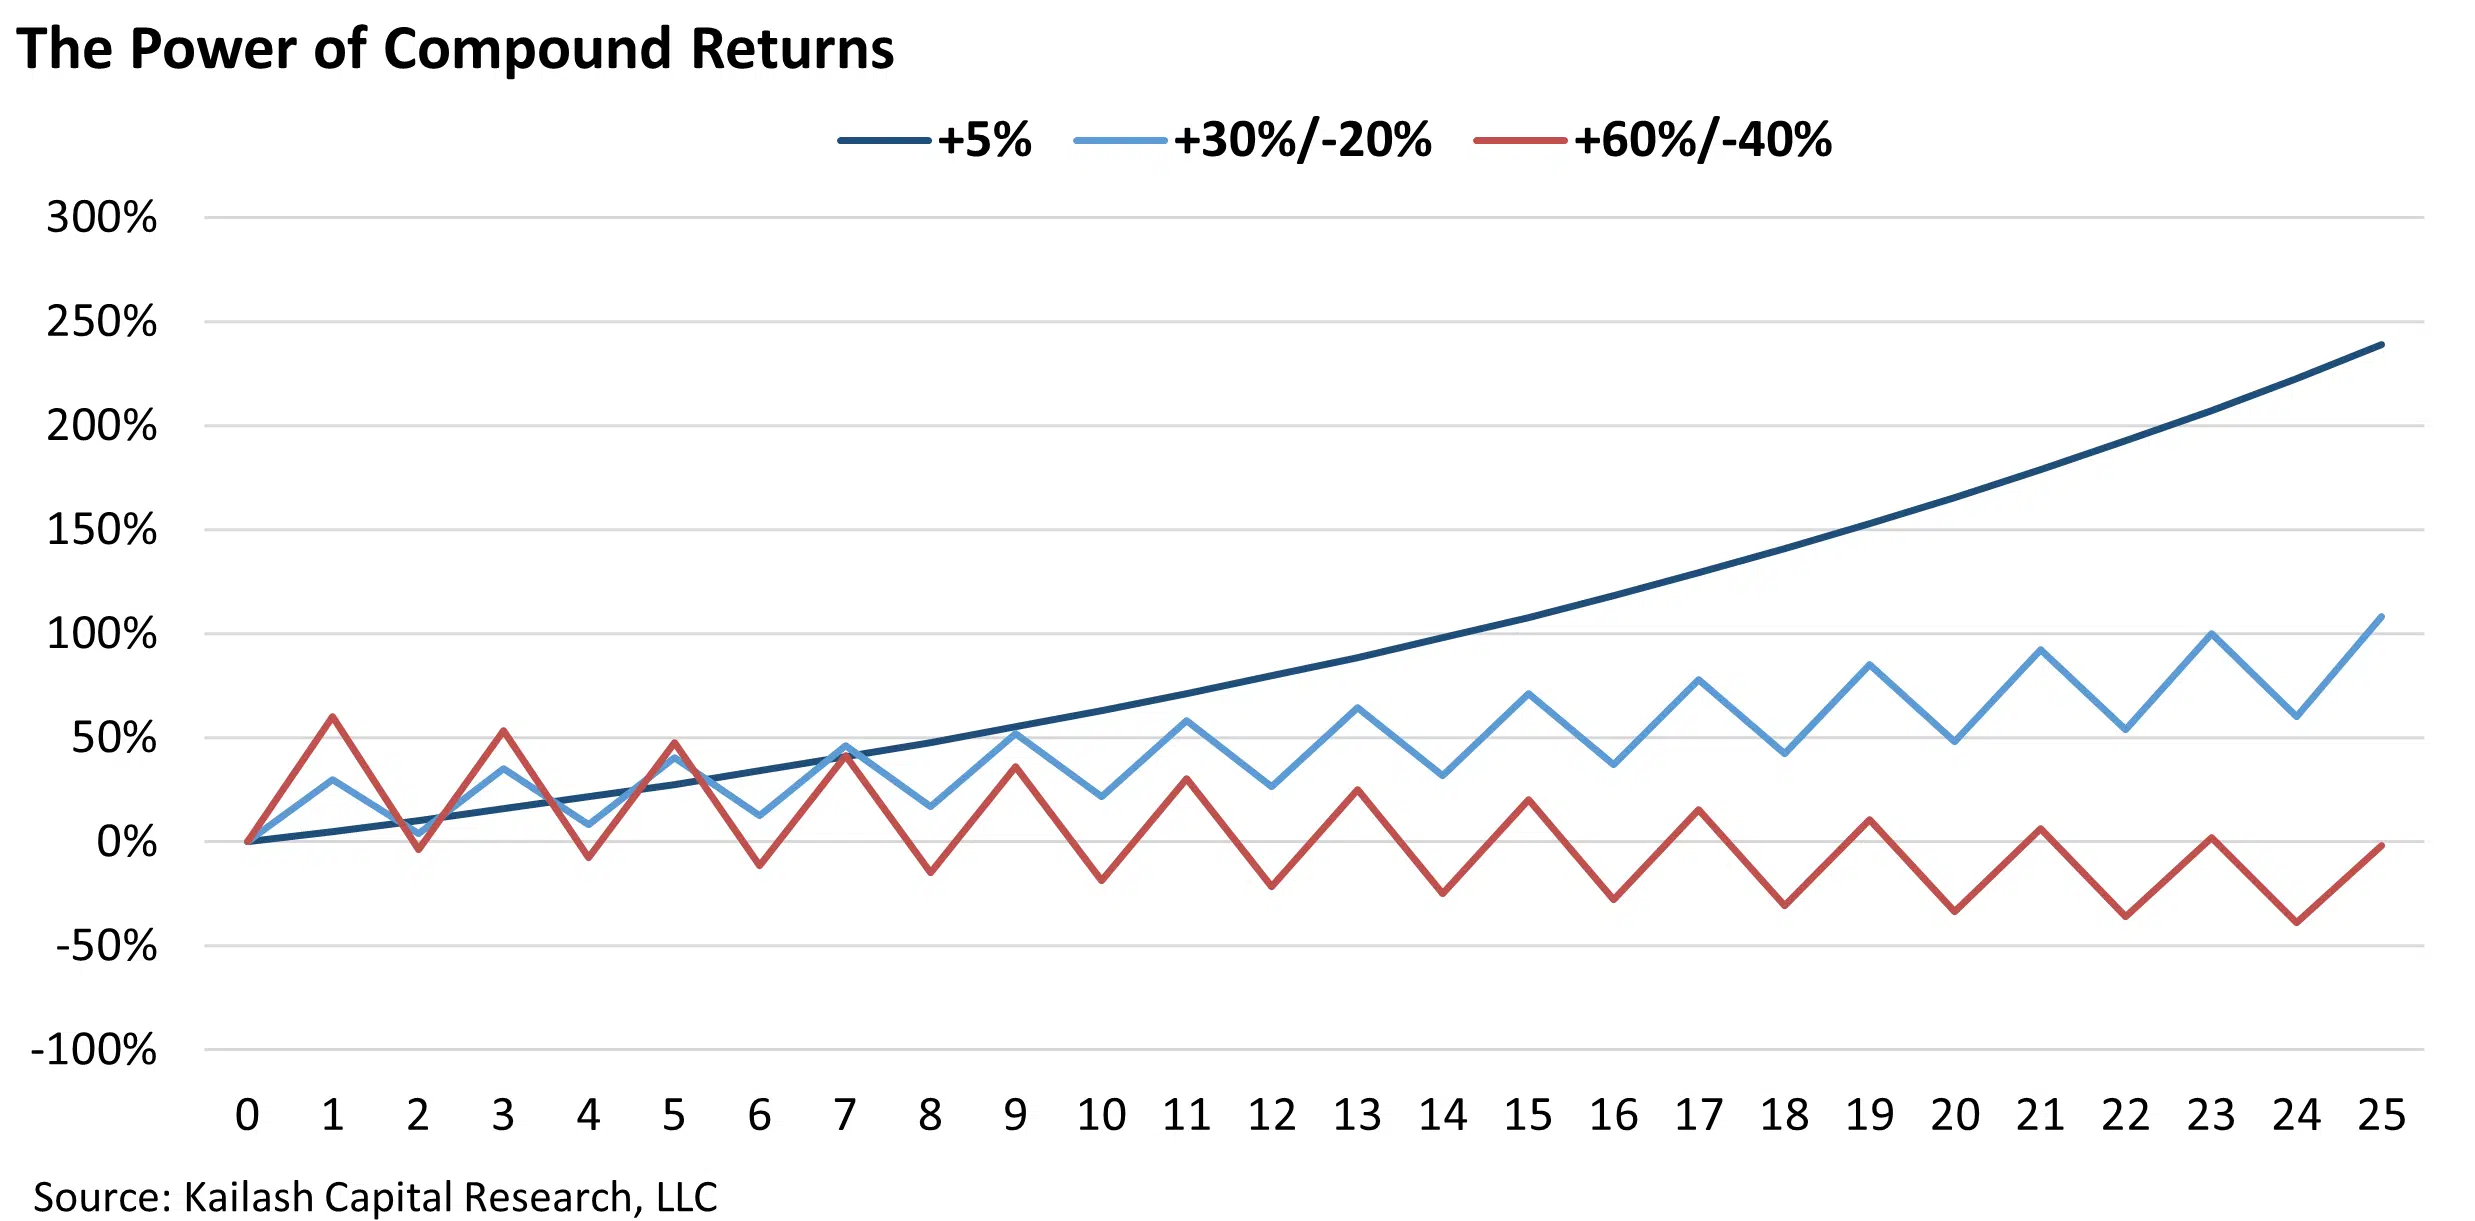
Geometrically-Linked Returns – Sadly Misunderstood
The impact of negative values (losses) in a series of returns is often under-appreciated. Given the choice between a positive 5% return every year for 25 years, or returns that alternate between +30% and -20%, or +60% and -40% over the same period, we find most people would choose the up-and-down returns because the returns in the “up” years are much bigger than the returns in the “down” years – and the spread is much bigger than the 5% constant return.
Volatility – For Leveraged ETFs, It’s a Real Drag
Moving away from this simple example above, consider Stock ABC and two leveraged ETFs on that stock – one that delivers 2X Stock ABC’s one-day return and one that delivers 3X. We use a random number generator to simulate daily returns for the price of ABC instead of using perfectly offsetting ups and downs. To make it even more “fair”, as investors expect stocks to move higher over time (otherwise, why not just keep your money in T-bills?), we bias the random number generator so that the stock price can move up as much as 15% per day, but cannot move down by more than 10% per day.
The chart below shows randomly generated returns that Stock ABC could have experienced over three months and how 2X and 3X leverage would affect returns over that period.


Disclaimer
The information, data, analyses, and opinions presented herein (a) do not constitute investment advice, (b) are provided solely for informational purposes and therefore are not, individually or collectively, an offer to buy or sell a security, (c) are not warranted to be correct, complete or accurate, and (d) are subject to change without notice. Kailash Capital Research, LLC and its affiliates (collectively, “KCR”) shall not be responsible for any trading decisions, damages, or other losses resulting from, or related to, the information, data, analyses or opinions or their use. The information herein may not be reproduced or retransmitted in any manner without the prior written consent of KCR. In preparing the information, data, analyses, and opinions presented herein, KCR has obtained data, statistics, and information from sources it believes to be reliable. KCR, however, does not perform an audit or seek independent verification of any of the data, statistics, and information it receives. KCR and its affiliates do not provide tax, legal, or accounting advice. This material has been prepared for informational purposes only and is not intended to provide, and should not be relied on for tax, legal, or accounting advice. You should consult your tax, legal, and accounting advisors before engaging in any transaction.
Nothing herein shall limit or restrict the right of affiliates of KCR to perform investment management or advisory services for any other persons or entities. Furthermore, nothing herein shall limit or restrict affiliates of KCR from buying, selling, or trading securities or other investments for their own accounts or for the accounts of their clients. Affiliates of KCR may at any time have, acquire, increase, decrease, or dispose of the securities or other investments referenced in this publication. KCR shall have no obligation to recommend securities or investments in this publication as a result of its affiliates’ investment activities for their own accounts or for the accounts of their clients.
© 2026 Kailash Capital Research, LLC – All rights reserved.
March 13, 2026 |
| Authors: Matthew Malgari, Nathan Przybylo, Dr. Sanjeev Bhojraj and John Durkin
March 13, 2026
Authors: Matthew Malgari, Nathan Przybylo, Dr. Sanjeev Bhojraj and John Durkin