Every year since the launch of our website, we have posted a piece reviewing KCR’s work from the prior year. Today’s post continues that tradition. We would like to thank our rapidly growing list of readers for their support, engagement, and thoughtful kindness. KCR has updated all the charts below through December 31, 2023.
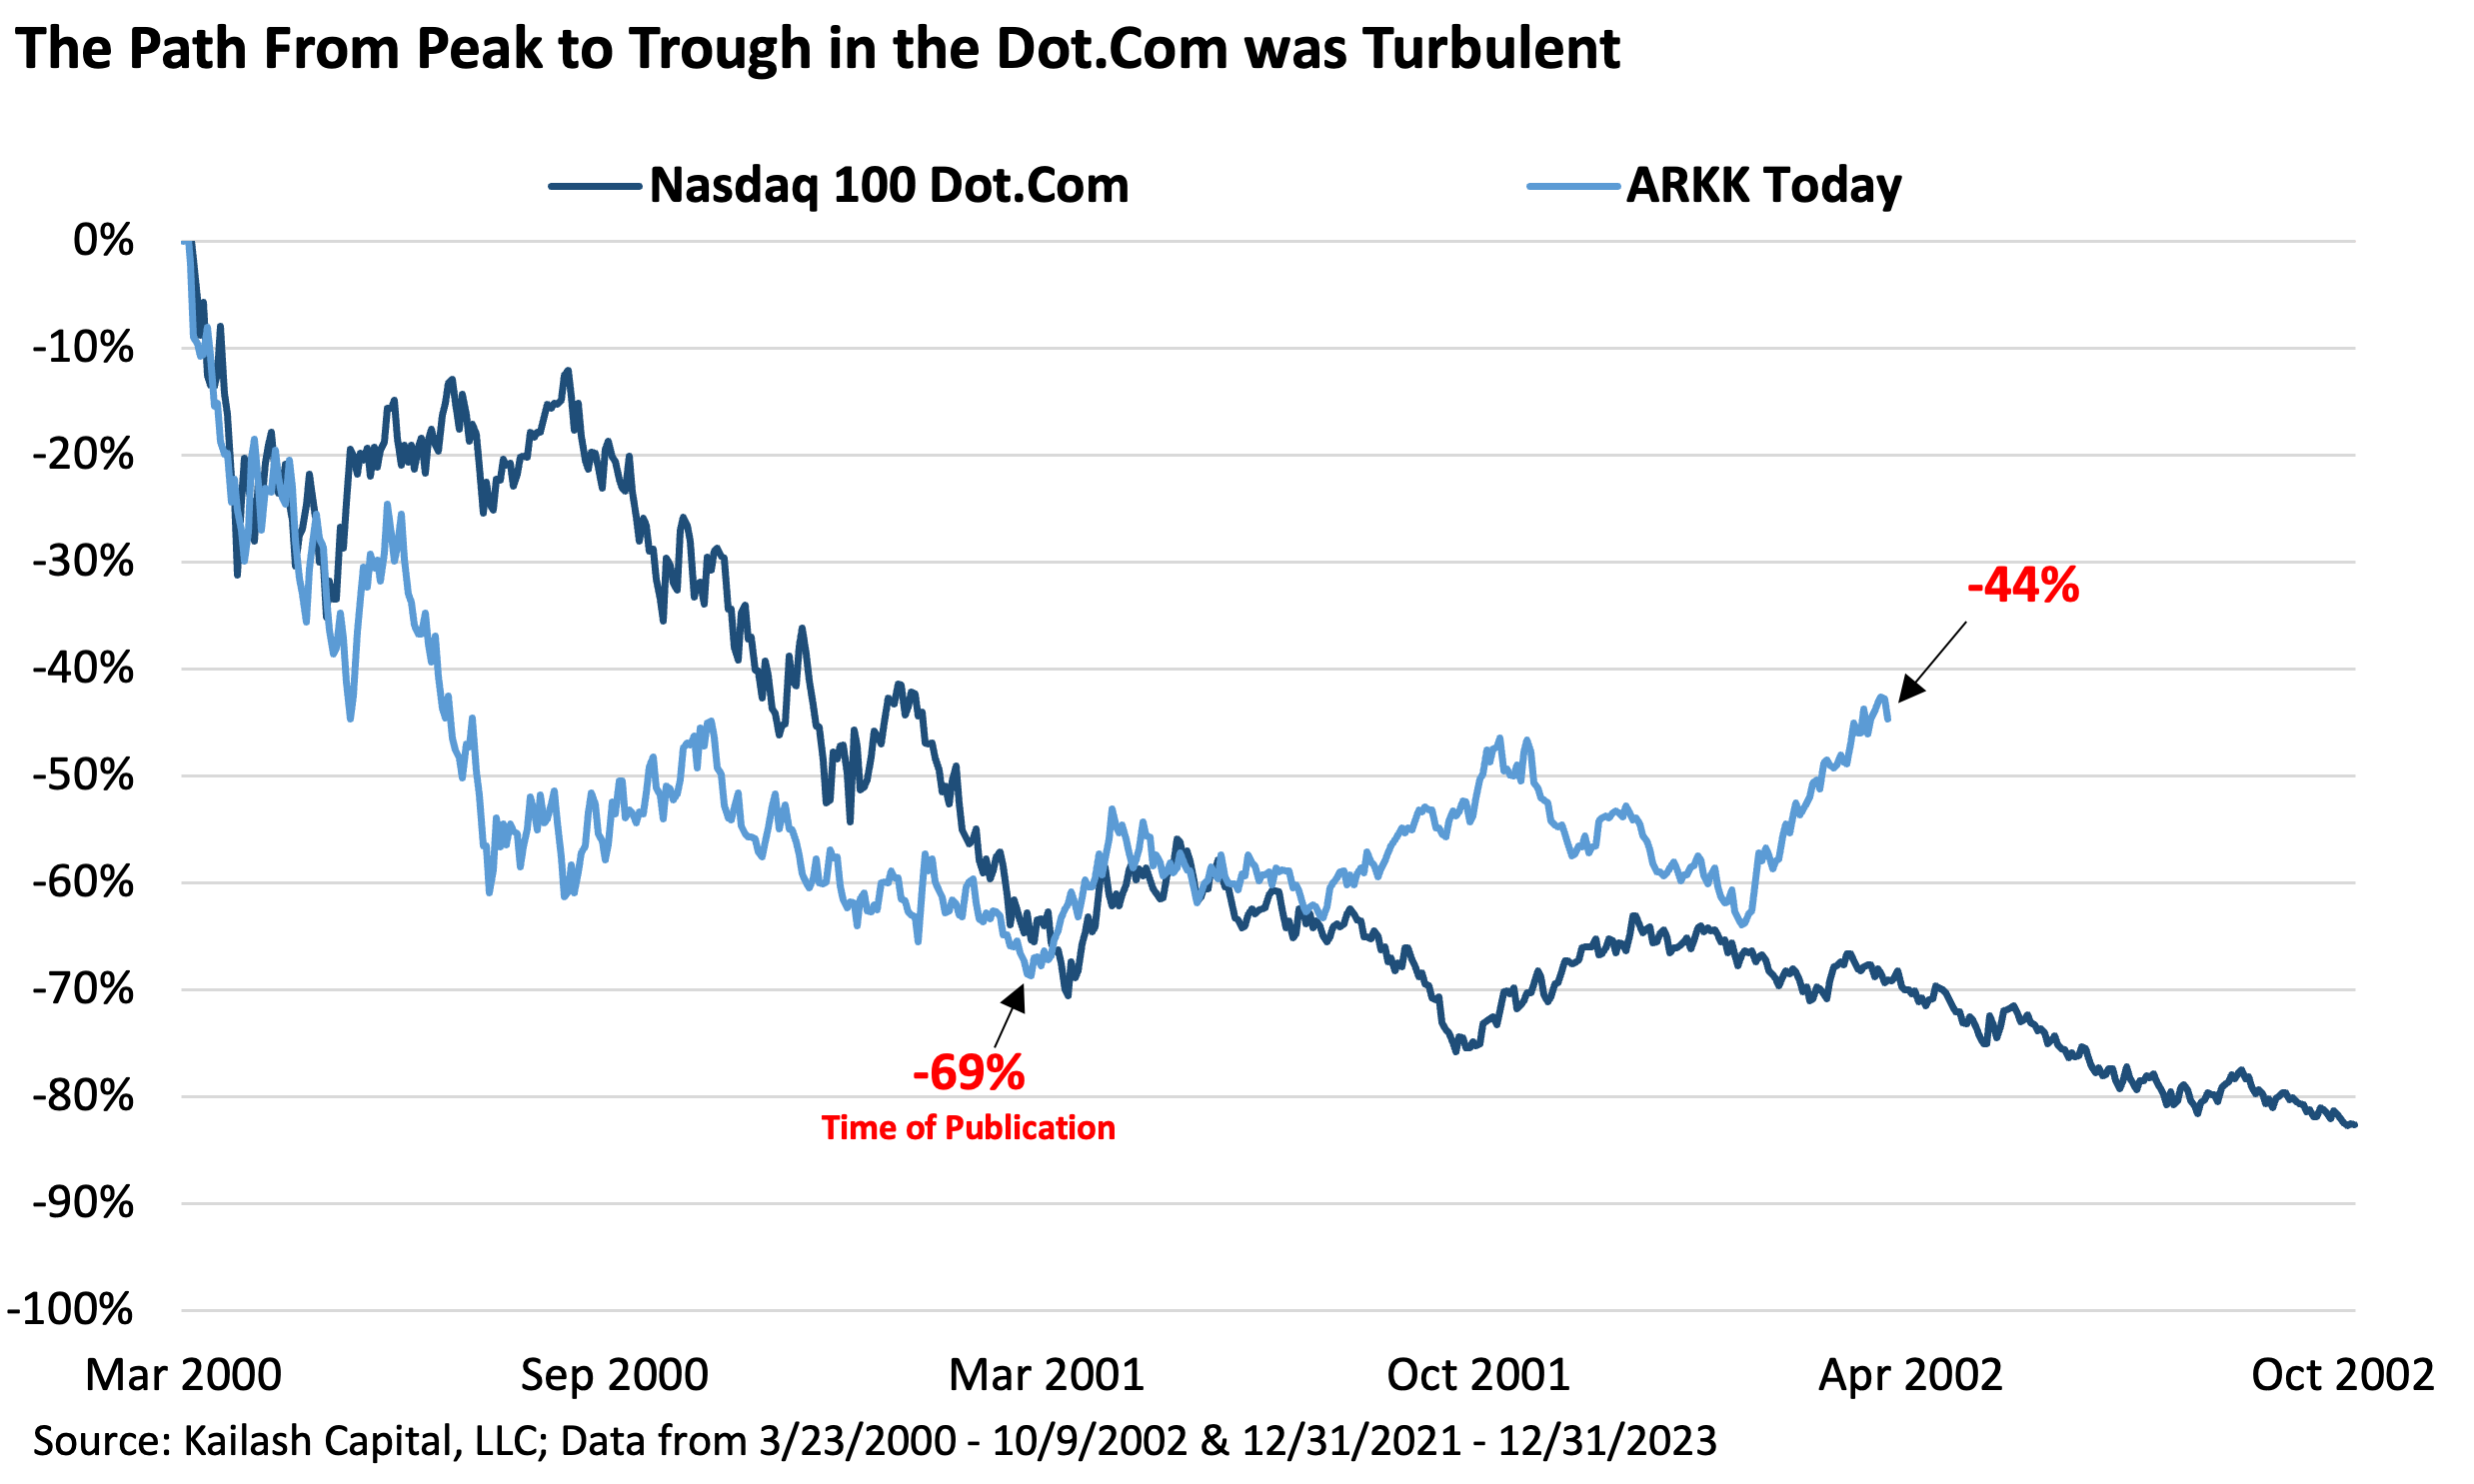
From our piece ARKK vs. QQQ, the first chart shows the collapse in the QQQs from the dot.com peak to the trough and overlays ARKK’s decline from the broad market peak in December of 2021. The historical data indicated a sharp bounce in low-quality and overpriced mega-caps in 2023 was likely if the 2001 precedent held.
Get our insights direct to your inbox: SUBSCRIBE
History has rhymed. Similar to 2001, speculators have plunged back in. What has been different this cycle is the length and magnitude of this “echo-bubble.” 2001’s first violent counter-trend rally happened over just 40 trading days before proceeding to collapse again. This cycle, the rally has gone higher and longer than it did in 2001. Despite the ferocious 2023 rally, ARKK is still down -44% from our starting point. So what now?
The below table contrasts some basic valuation and fundamental metrics of ARKK’s holdings, the S&P 500, and KCR’s Large Cap Portfolio. As one article noted “…despite the Fund losing $9.5 billion in investor funds as a result of [ARKK’s] wagers, flows have held up well. … ‘There is a category of investor that is trapped. They’re anchored to the price at which they purchased it…”[i] Are you trapped? If so, why?

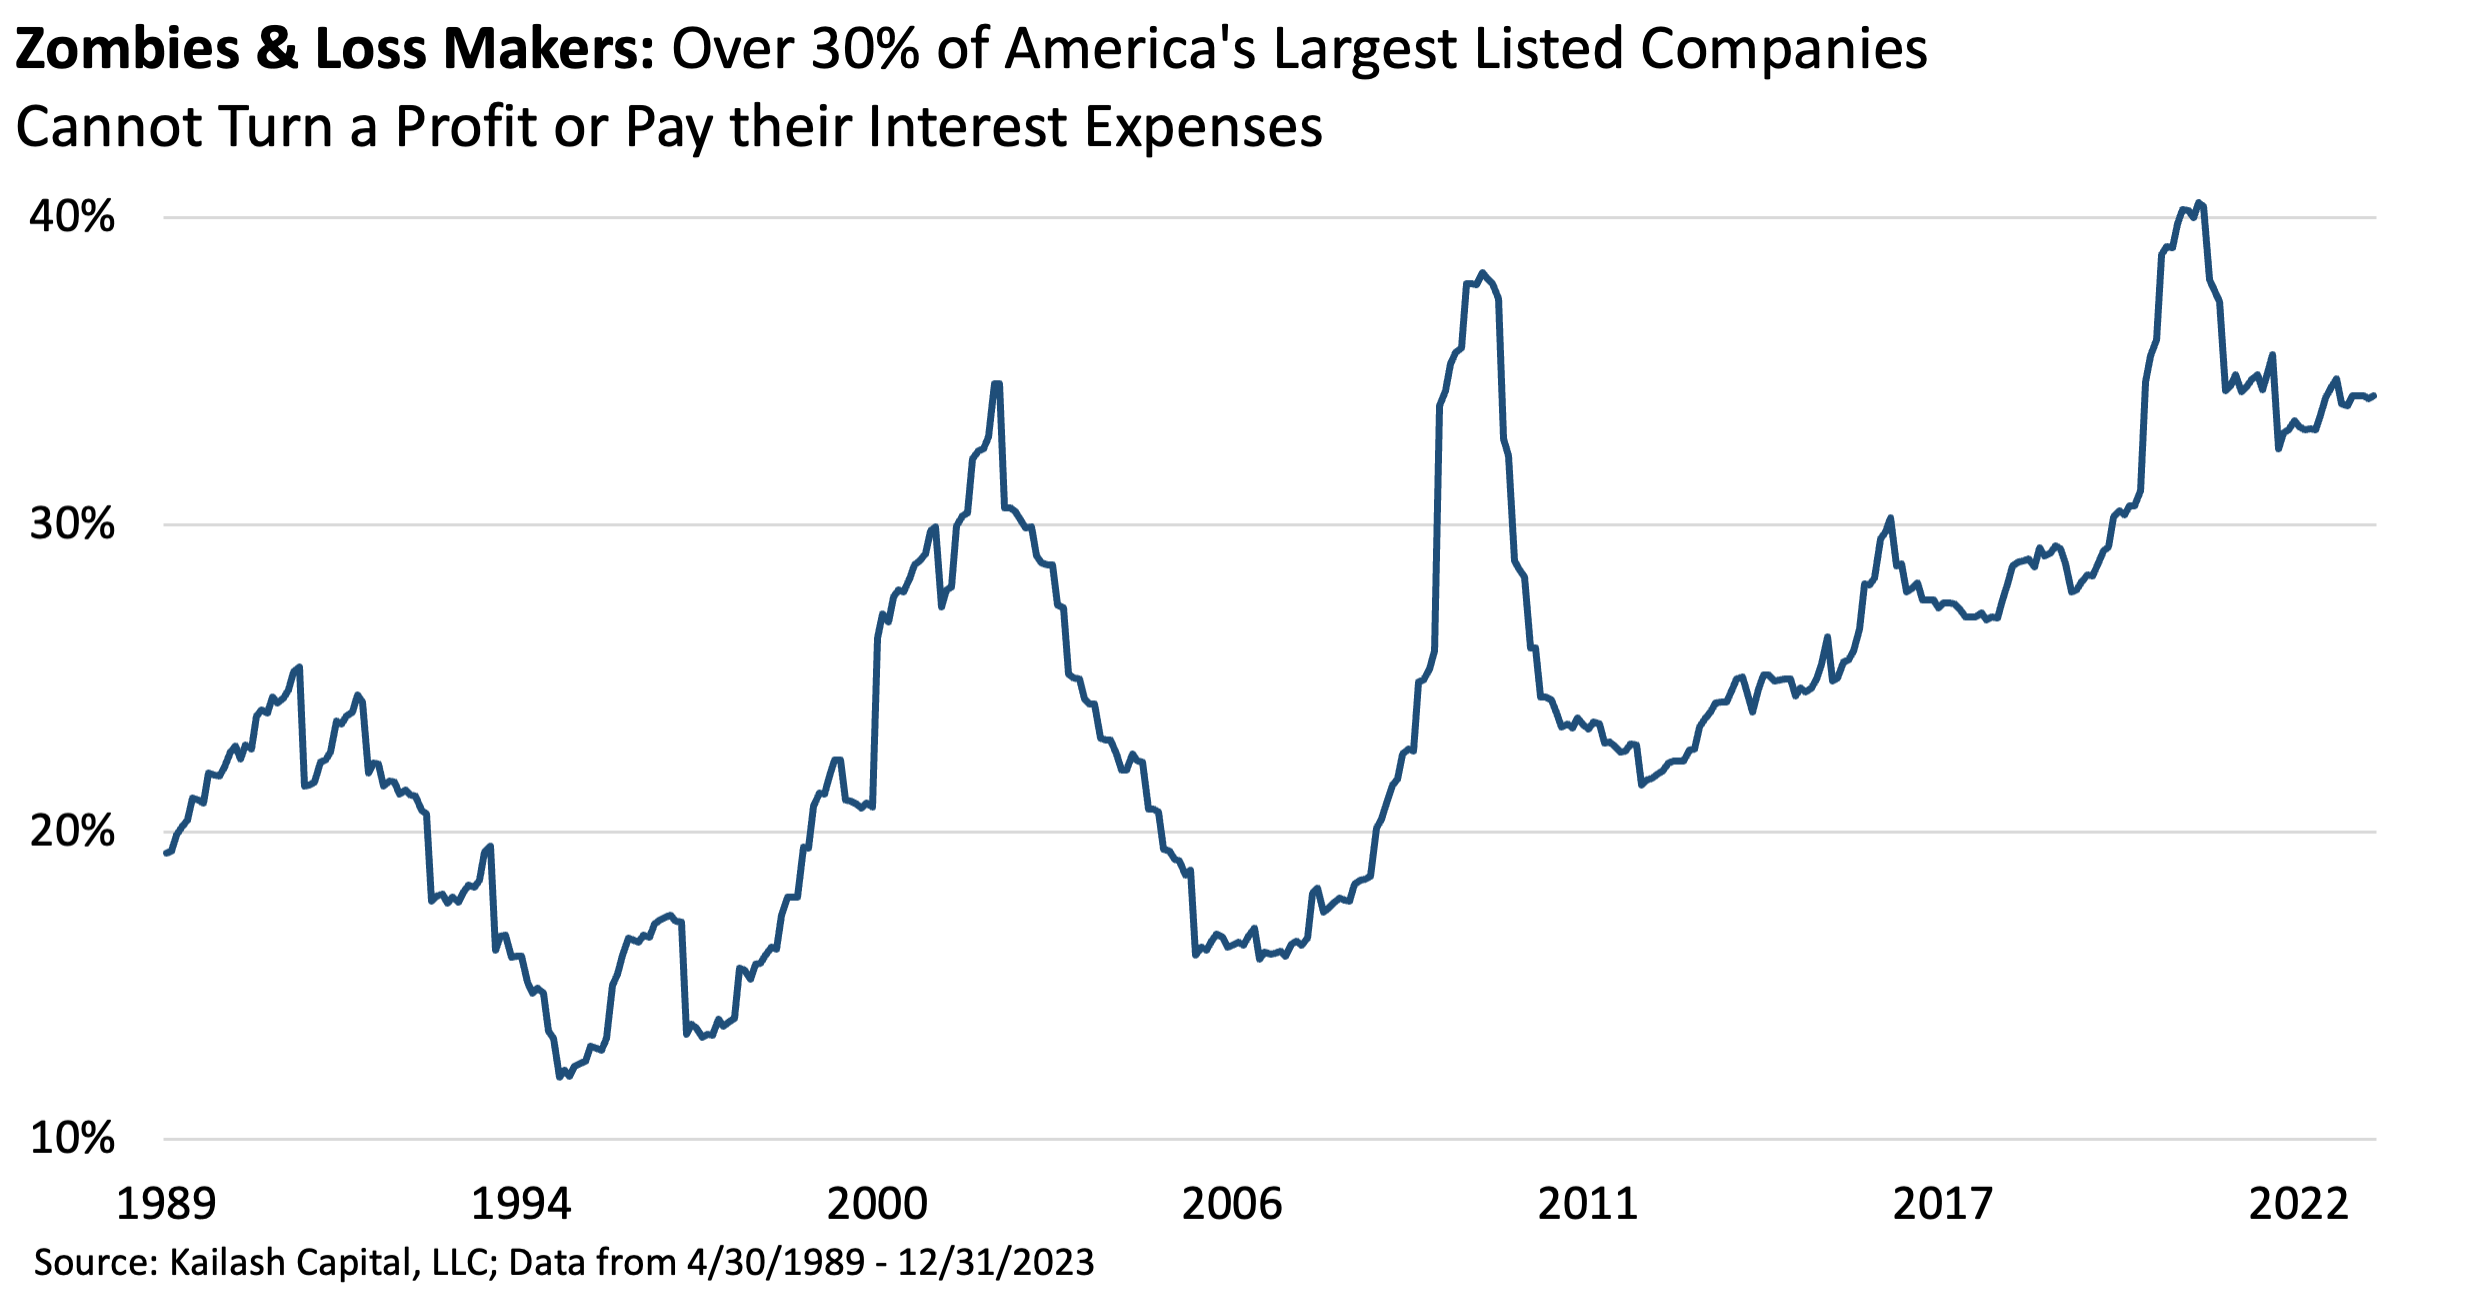
KCR followed up that piece with The Art of Stock Picking Returns. The chart below shows the percentage of the Russell 3000 that either lose money or can’t afford to pay the interest expense on their debt. We dubbed this group the “Loss Makers and Zombies.” Over 33%, or ~1,000 of America’s listed companies qualify.
This is happening against a backdrop of corporate profit margins shattering the record last seen in 1929.
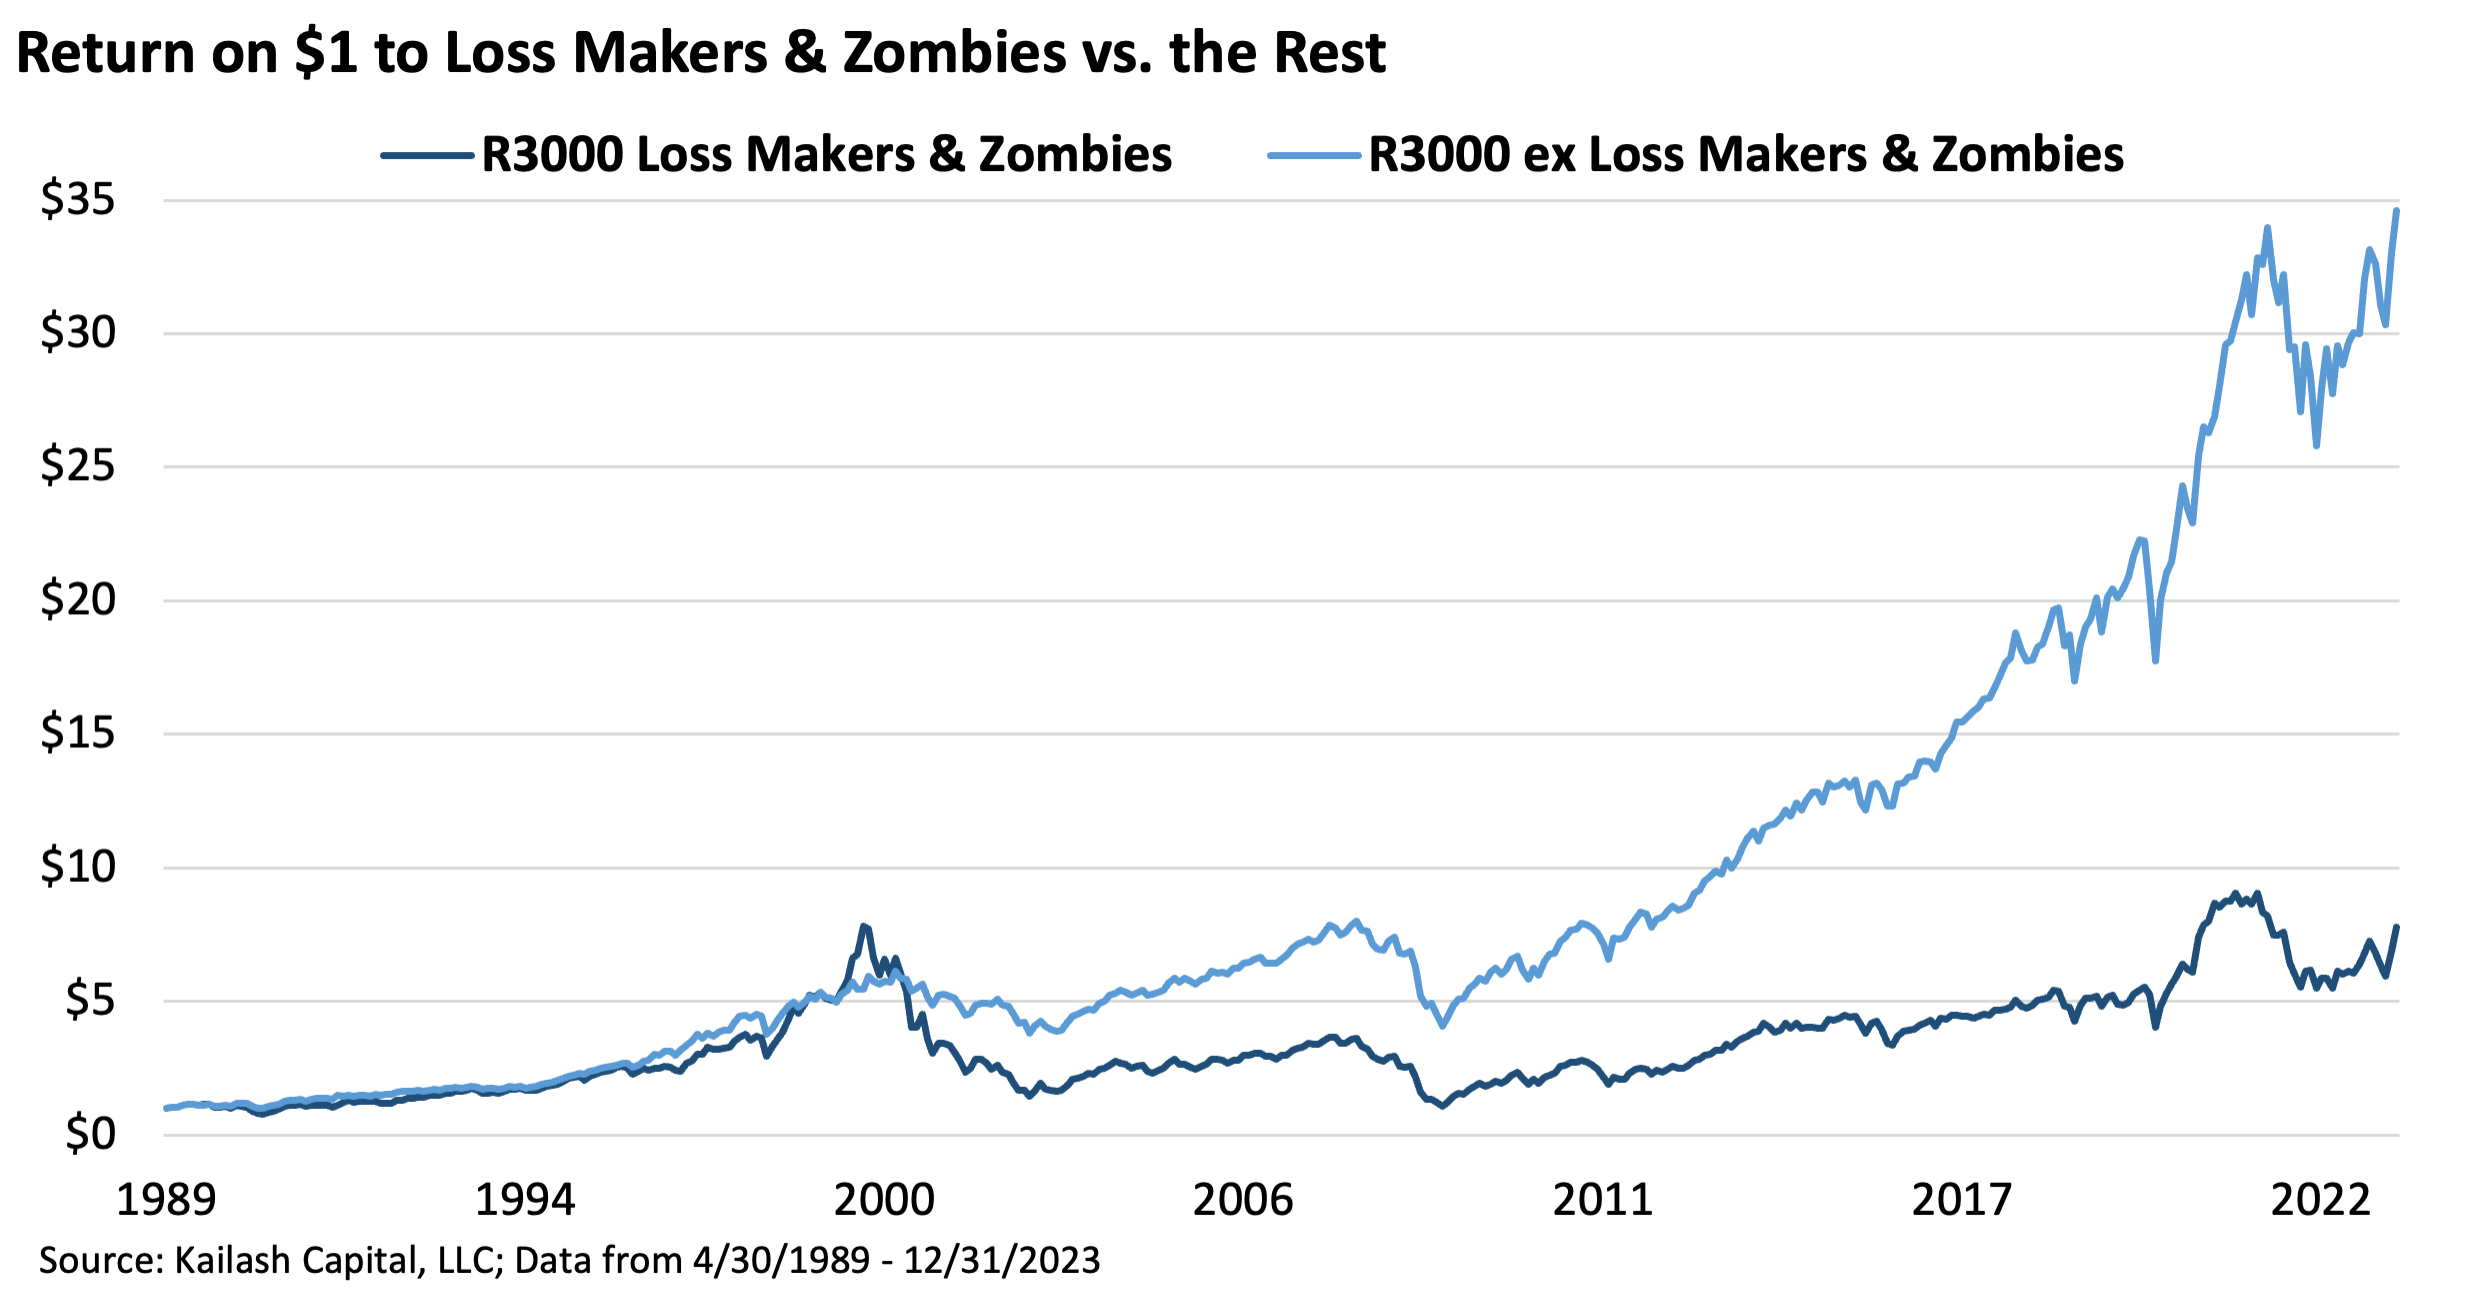
The chart below shows the compound return on $1 of loss makers & zombies vs. all other stocks. We believe avoiding the zombies seems like an obvious first step to better long-term returns. To each their own.
In KCR’s piece, Financial Follies, This Time is Different & Other Rubbish, we presented the below chart.
100 of the largest stocks in America are now priced at ~10x sales. Complicated? We think not.

We pointed out that just 30 stocks represented ~70% of the Russell 1000 Growth Index’s weight in our piece Mega Cap Stocks. Stories about US stocks being worth more than entire countries are now common. Remember when the land under Japan’s Imperial Palace was once more valuable than all of California?

In How to Value Tech Companies, we noted that IT firms in the S&P500 had hit nearly 8x P/S in 2021 surpassing the dot.com peak. After a brief correction in 2022, we’re right back to the all-time records.

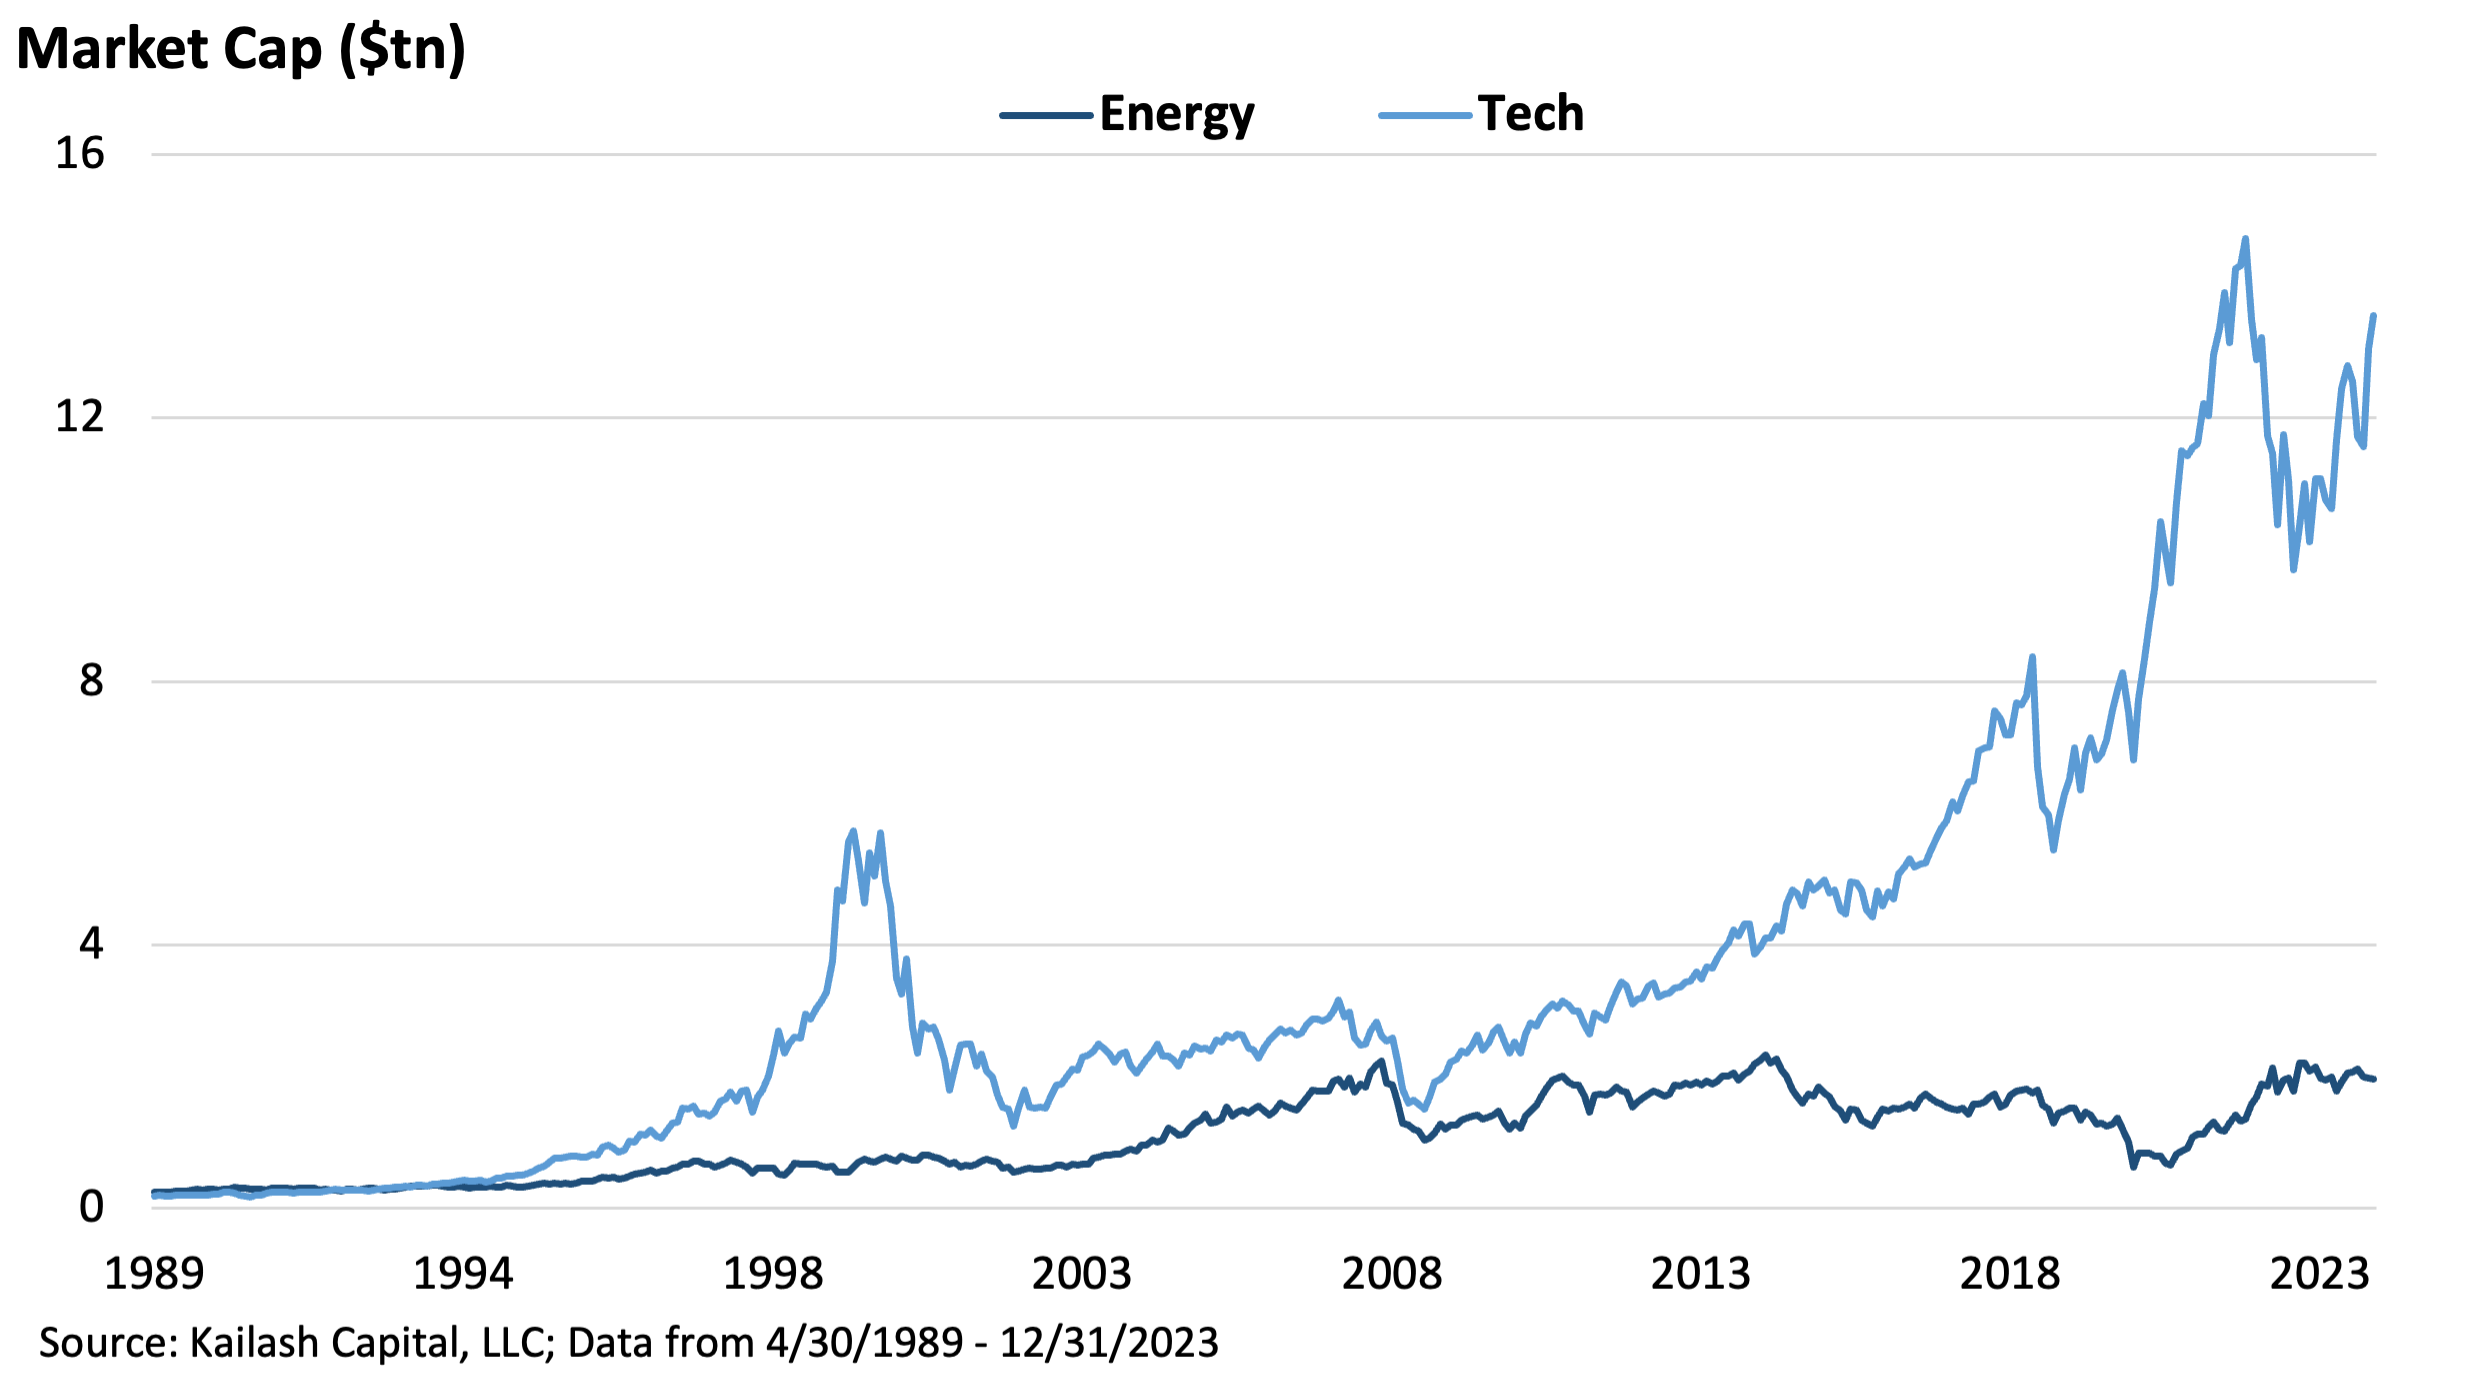
In AI, Oil & Gas, we noted that based on fundamentals, Energy and Tech looked surprisingly similar. We’ve updated the chart below and admit, tech has pulled ahead a bit. We discussed the potential risks from inflated Tech sales and profits due to vendor financing in Everything AI, a problem that simply can’t exist in Energy.
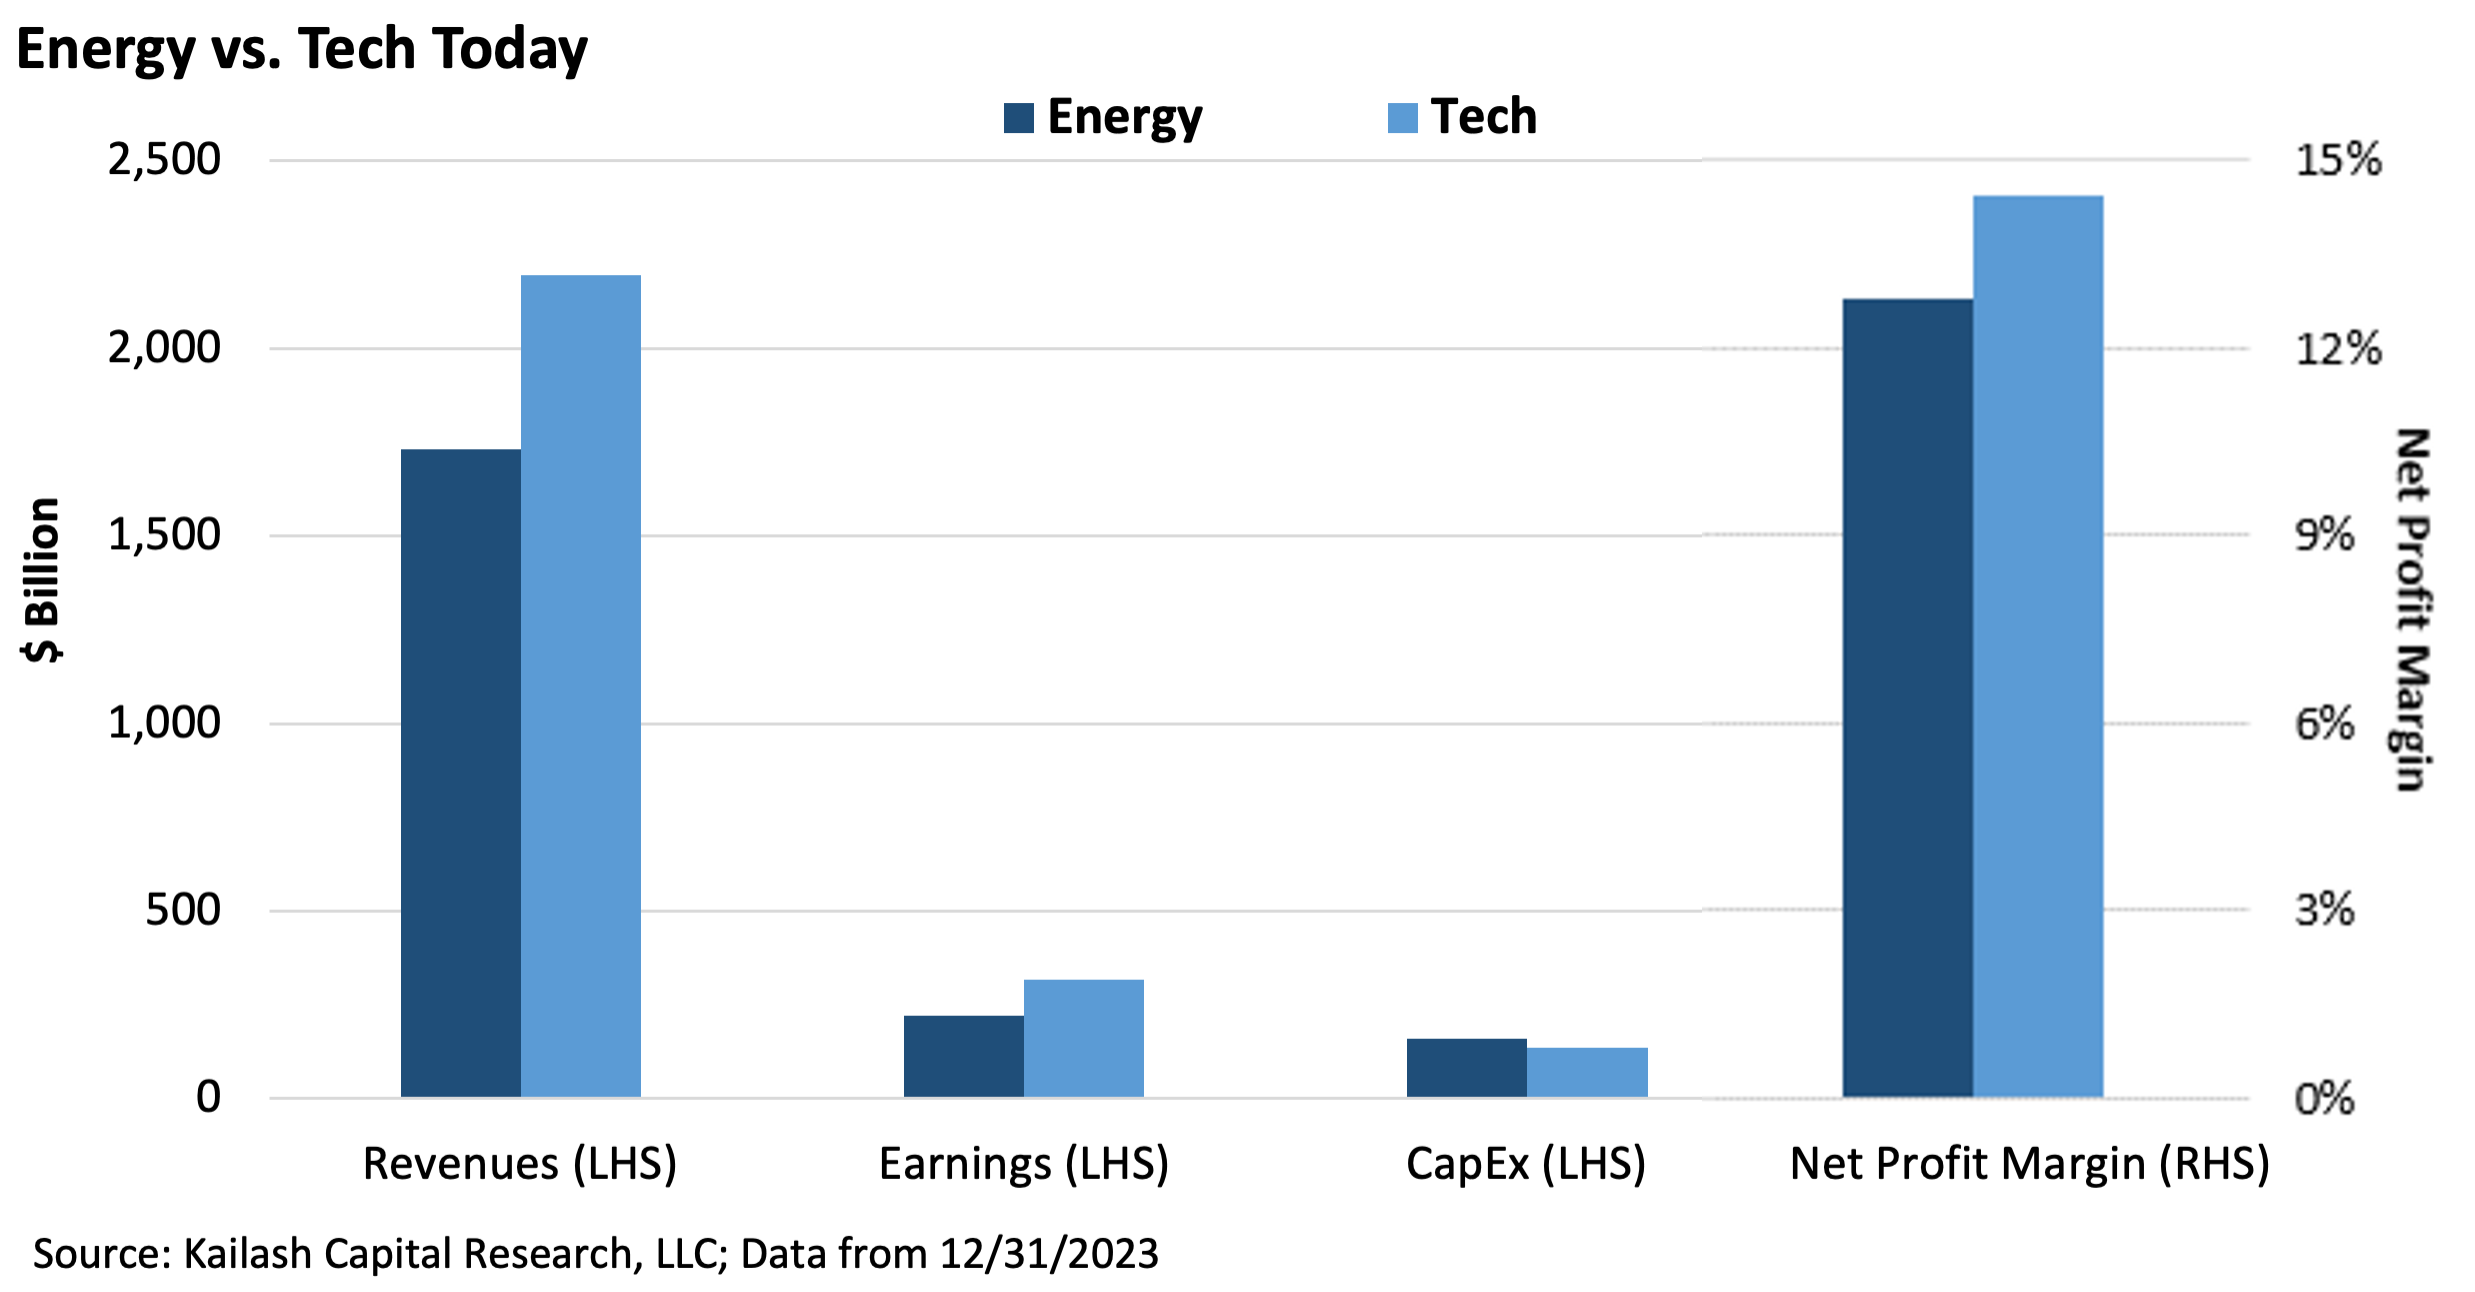
We agree that Tech’s earnings are nothing like Energy’s earnings. But the view that Tech is better than Energy is so consensus that Tech is now valued at a $10 trillion premium to Energy despite similar fundamentals. We are not saying “buy energy, sell tech” – there’s lots of tech we love. But as we reminded readers: Tech’s earnings were far more cyclical than Energy’s in the dot.com bubble and nearly as bad in the GFC.
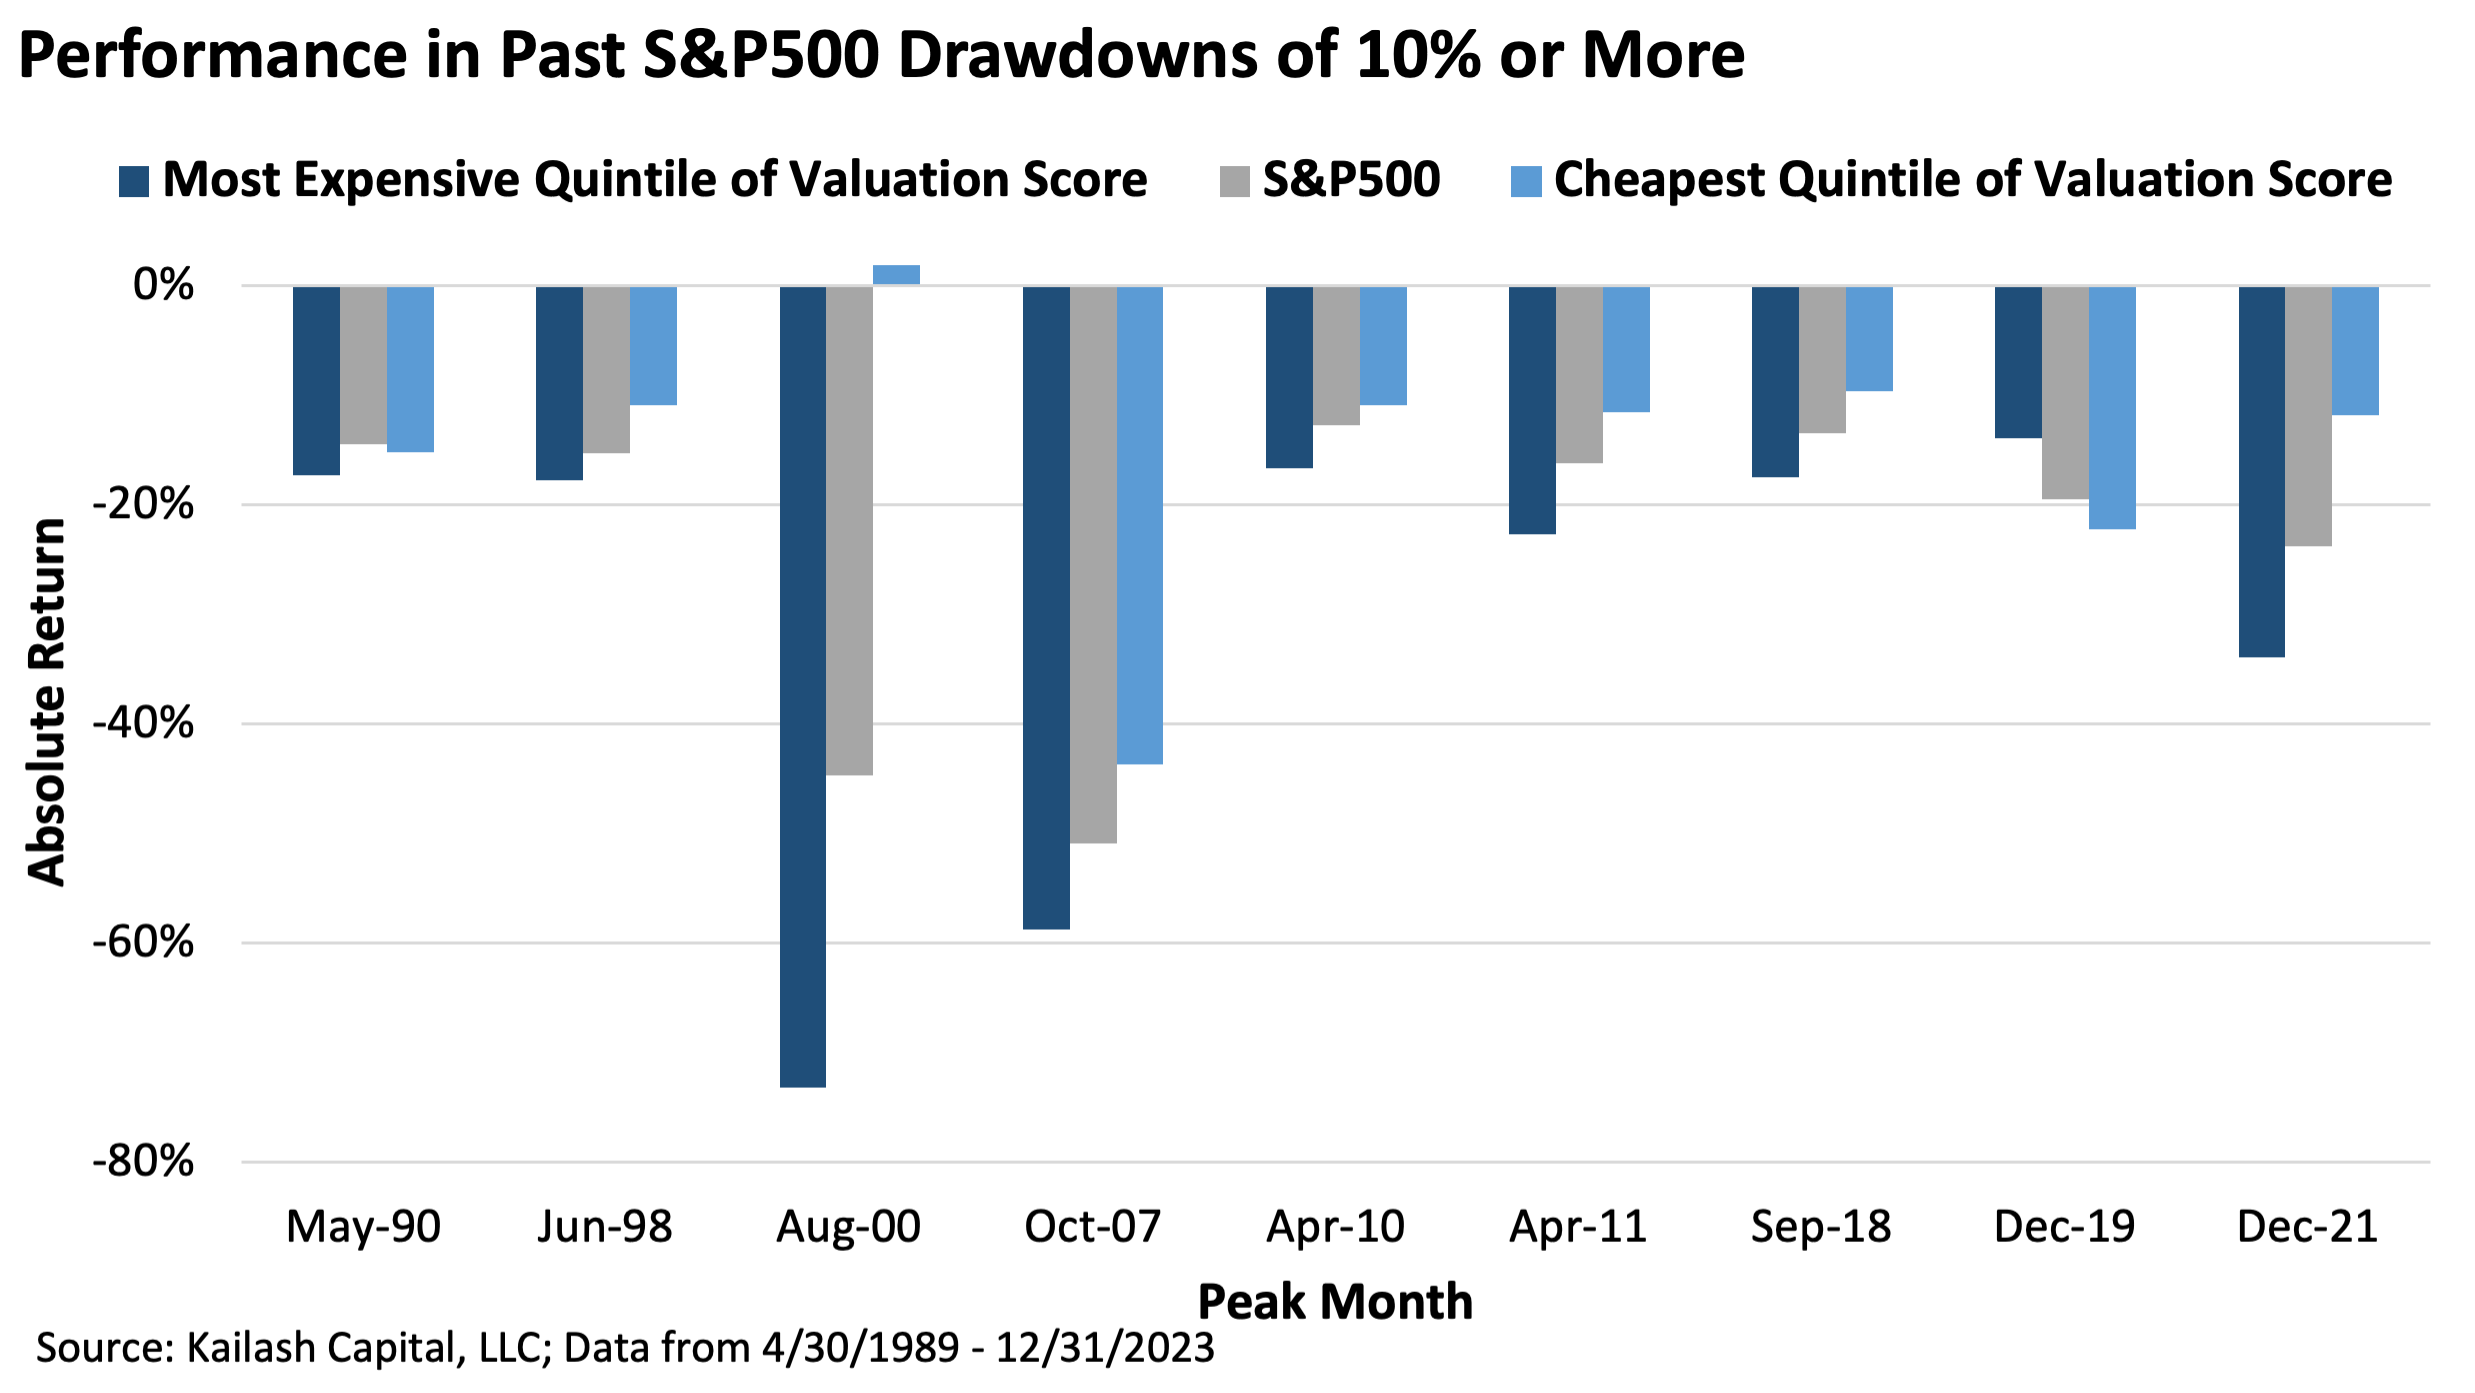
We’ll close with our favorite saying: what you pay matters. In Equity Valuations Matter, we showed that in every correction[ii], expensive stocks using KCR’s valuation score have gotten smashed compared to our cheap stocks.
KCR would like to thank our many subscribers again for their interest in our work.
What’s In Your Portfolio?™
Disclaimer
The information, data, analyses, and opinions presented herein (a) do not constitute investment advice, (b) are provided solely for informational purposes and therefore are not, individually or collectively, an offer to buy or sell a security, (c) are not warranted to be correct, complete or accurate, and (d) are subject to change without notice. Kailash Capital Research, LLC and its affiliates (collectively, “KCR”) shall not be responsible for any trading decisions, damages, or other losses resulting from, or related to, the information, data, analyses or opinions or their use. The information herein may not be reproduced or retransmitted in any manner without the prior written consent of KCR. In preparing the information, data, analyses, and opinions presented herein, KCR has obtained data, statistics, and information from sources it believes to be reliable. KCR, however, does not perform an audit or seek independent verification of any of the data, statistics, and information it receives. KCR and its affiliates do not provide tax, legal, or accounting advice. This material has been prepared for informational purposes only and is not intended to provide, and should not be relied on for tax, legal, or accounting advice. You should consult your tax, legal, and accounting advisors before engaging in any transaction.
Nothing herein shall limit or restrict the right of affiliates of KCR to perform investment management or advisory services for any other persons or entities. Furthermore, nothing herein shall limit or restrict affiliates of KCR from buying, selling, or trading securities or other investments for their own accounts or for the accounts of their clients. Affiliates of KCR may at any time have, acquire, increase, decrease, or dispose of the securities or other investments referenced in this publication. KCR shall have no obligation to recommend securities or investments in this publication as a result of its affiliates’ investment activities for their own accounts or for the accounts of their clients.
© 2024 Kailash Capital Research, LLC – All rights reserved.