A Systematic Approach to Identifying Clients with the Highest Risk Profiles
On Sept. 15, 2008, Lisa Roitman, a managing director at Lehman Brothers, was enjoying herself at a block party with her family in Greenwich, Connecticut, when a neighbor who worked at Goldman Sachs approached her. “I heard you were filing today,” he said. She was blindsided.
Roitman had come over to the investment bank from HSBC just one year earlier. During the interviewing process at Lehman, she said she was convinced of the company’s health. She was hired to work on fund derivatives, and said she was paid around $1 million a year to do so. She converted all the employee stock she’d accumulated since the 1990s into Lehman shares.
Get our insights direct to your inbox: SUBSCRIBE
Some troubling signs soon appeared. The mortgage traders who sat on the same floor as her were disappearing. “It was hard to tell if people were quitting or if people were being let go,” she said. “But it was fewer and fewer people.”
Then, she was rattled by the failure of another investment bank, Bear Stearns. “There are so many risk and credit controls within these institutions,” Roitman, now 50, said. “Unless someone is doing something wrong, how does something like that happen?”
The demise of the company cost her around $1 million in savings, she said.
She remembers thinking, “Now I have to start all over again.” Suddenly, she was worried about paying for her children’s college and if she’d have enough to retire. She had set her parents up with a Lehman fund manager, and they took a hit, too. She was insecure about the future and wondered, “If I could lose this job, what else could I lose?”
In the aftermath of the bankruptcy, she stayed on to finish out her clients’ deals. Since, she’s worked as a lawyer at a handful of smaller financial companies, where she says she makes half of what she made at Lehman. “I’ve never recovered,” she said.
Yet the financial loss, she said, was not the hardest one. “What I lost was my identity,” she said. “Our business was done.” –Annie Nova, “Where former Lehman Brothers employees are today”
Even for those who lived through the dot.com crash and the Great Financial Crisis, it is easy to forget the pain of crashes. Most of the KCR team was actively investing money in both those crises. And still, we struggle to remember the incredible fear that gripped the nation as the news filled with stories about it being the start of another Great Depression.
We bring this up for a reason: Life’s bills do not always come at market tops. We do not believe we can time markets. We say this because the data is as clear as it is unforgiving.
Below, we’ve updated two charts long-time readers are now familiar with. Their point seems clear to us. Few times in history has having at least some of your money in an evidence-based strategy been more important.
Diversification played a critical role in preserving and growing capital through both the dot.com and GFC corrections. As a large amount of research published by KCR has shown, there are fantastic opportunities in small-cap, mid-cap, and large-cap for active managers. Rarely have we seen quality and value spreads so wide.
Let’s dive in – lots of pictures ahead:
Top chart: valuation. Stocks are expensive on one of the simplest and most empirically robust methods we are aware of. Buffett’s market cap to GDP. Today, we are beyond dot.com.
Bottom chart, leverage. The US went on a bender during a decade of zero interest rates. Debt in the non-financial corporate sector is higher than before the peak of the dot.com bubble and the GFC.
Why it matters:
• At the peak of the dot.com bubble stocks hit all-time high valuations, and there was record debt
• At the peak prior to the GFC, stocks were cheaper than the dot.com peak, but there was too much debt
• The results for investors in index funds at those moments in history were catastrophic, characterized by plunging equity valuations and long stretches before investors broke even.
Today, stocks are more expensive than the dot.com peak and there is more debt than in the GFC.

The remainder of this paper is a follow-on work to our note Excessive Extrapolation & Stock Based
Compensation, which leaned on data, feedback from FAs, and research from behavioral finance to document:
• Individuals have been flooded with a record $1.8 trillion in stock-based compensation
• Financial Advisors reported many clients had excessive concentration in stock issued from employers
• FAs were struggling to convince clients to engage in even the most basic diversification tactics
The good news is that a record amount of wealth has been issued to employees. Reprinting the chart from our prior piece below, we see the number is enormous. Employees have been flooded with $1.8 trillion in stock over the last 10 years, an all-time record.

The bad news is that:
• Much of the stock issued to employees is trading at extreme valuations, making them prone to collapse
• Within that overvalued cohort, there tends to be a tremendous amount of low-quality junk
• We have seen this movie before – specifically in 1999, and the results were disastrous
Today’s piece offers two (hopefully) valuable insights:
1. A simple and systematic method to help Financial Advisors identify which clients hold what might be the most dangerous stocks.
2. Help active equity fund managers by identifying stocks with the worst fundamentals and most unforgiving valuations that have flooded employees with stock, a potential hidden risk factor in portfolios.
The chart below restructures the data from the chart above. We cut the $1.8 trillion in stock comp issued to employees into five buckets – from the cheapest 20% of stocks (Quintile 1) to the most expensive (Quintile 5). The first bar shows that the cheapest 20% of companies have issued “only” $217 billion in stock to employees.
Look at the last bar in red. That is the most expensive 20% of stocks in the United States. An incredible $677 billion of stock sent to employees has come from the 20% of companies that are the most highly valued.

So, how expensive is that $667 billion of stock employees were granted? Painfully expensive. The stuff is valued at an incredible 10.4x price to sales today. That level of valuation makes the math merciless even for the highest quality blue-chips.

Let’s recap to keep it simple:
• Equity valuations are back at dot.com highs, and debt levels are higher than in 2007 before the GFC
• The most expensive companies today have issued more stock to employees than any time in history
• Many employees have an outsized amount of their net worth in these expensive stocks and are refusing basic diversification despite their holdings being valued at over 10x price to sales today.
Why does that matter so much for Financial Advisors and Institutional Investors? We’ve pulled some data out of our work on the brutal nature of buying stocks valued at over 10x price to sales and reposted it here for convenience. Let’s walk through it quickly as this is not complicated.
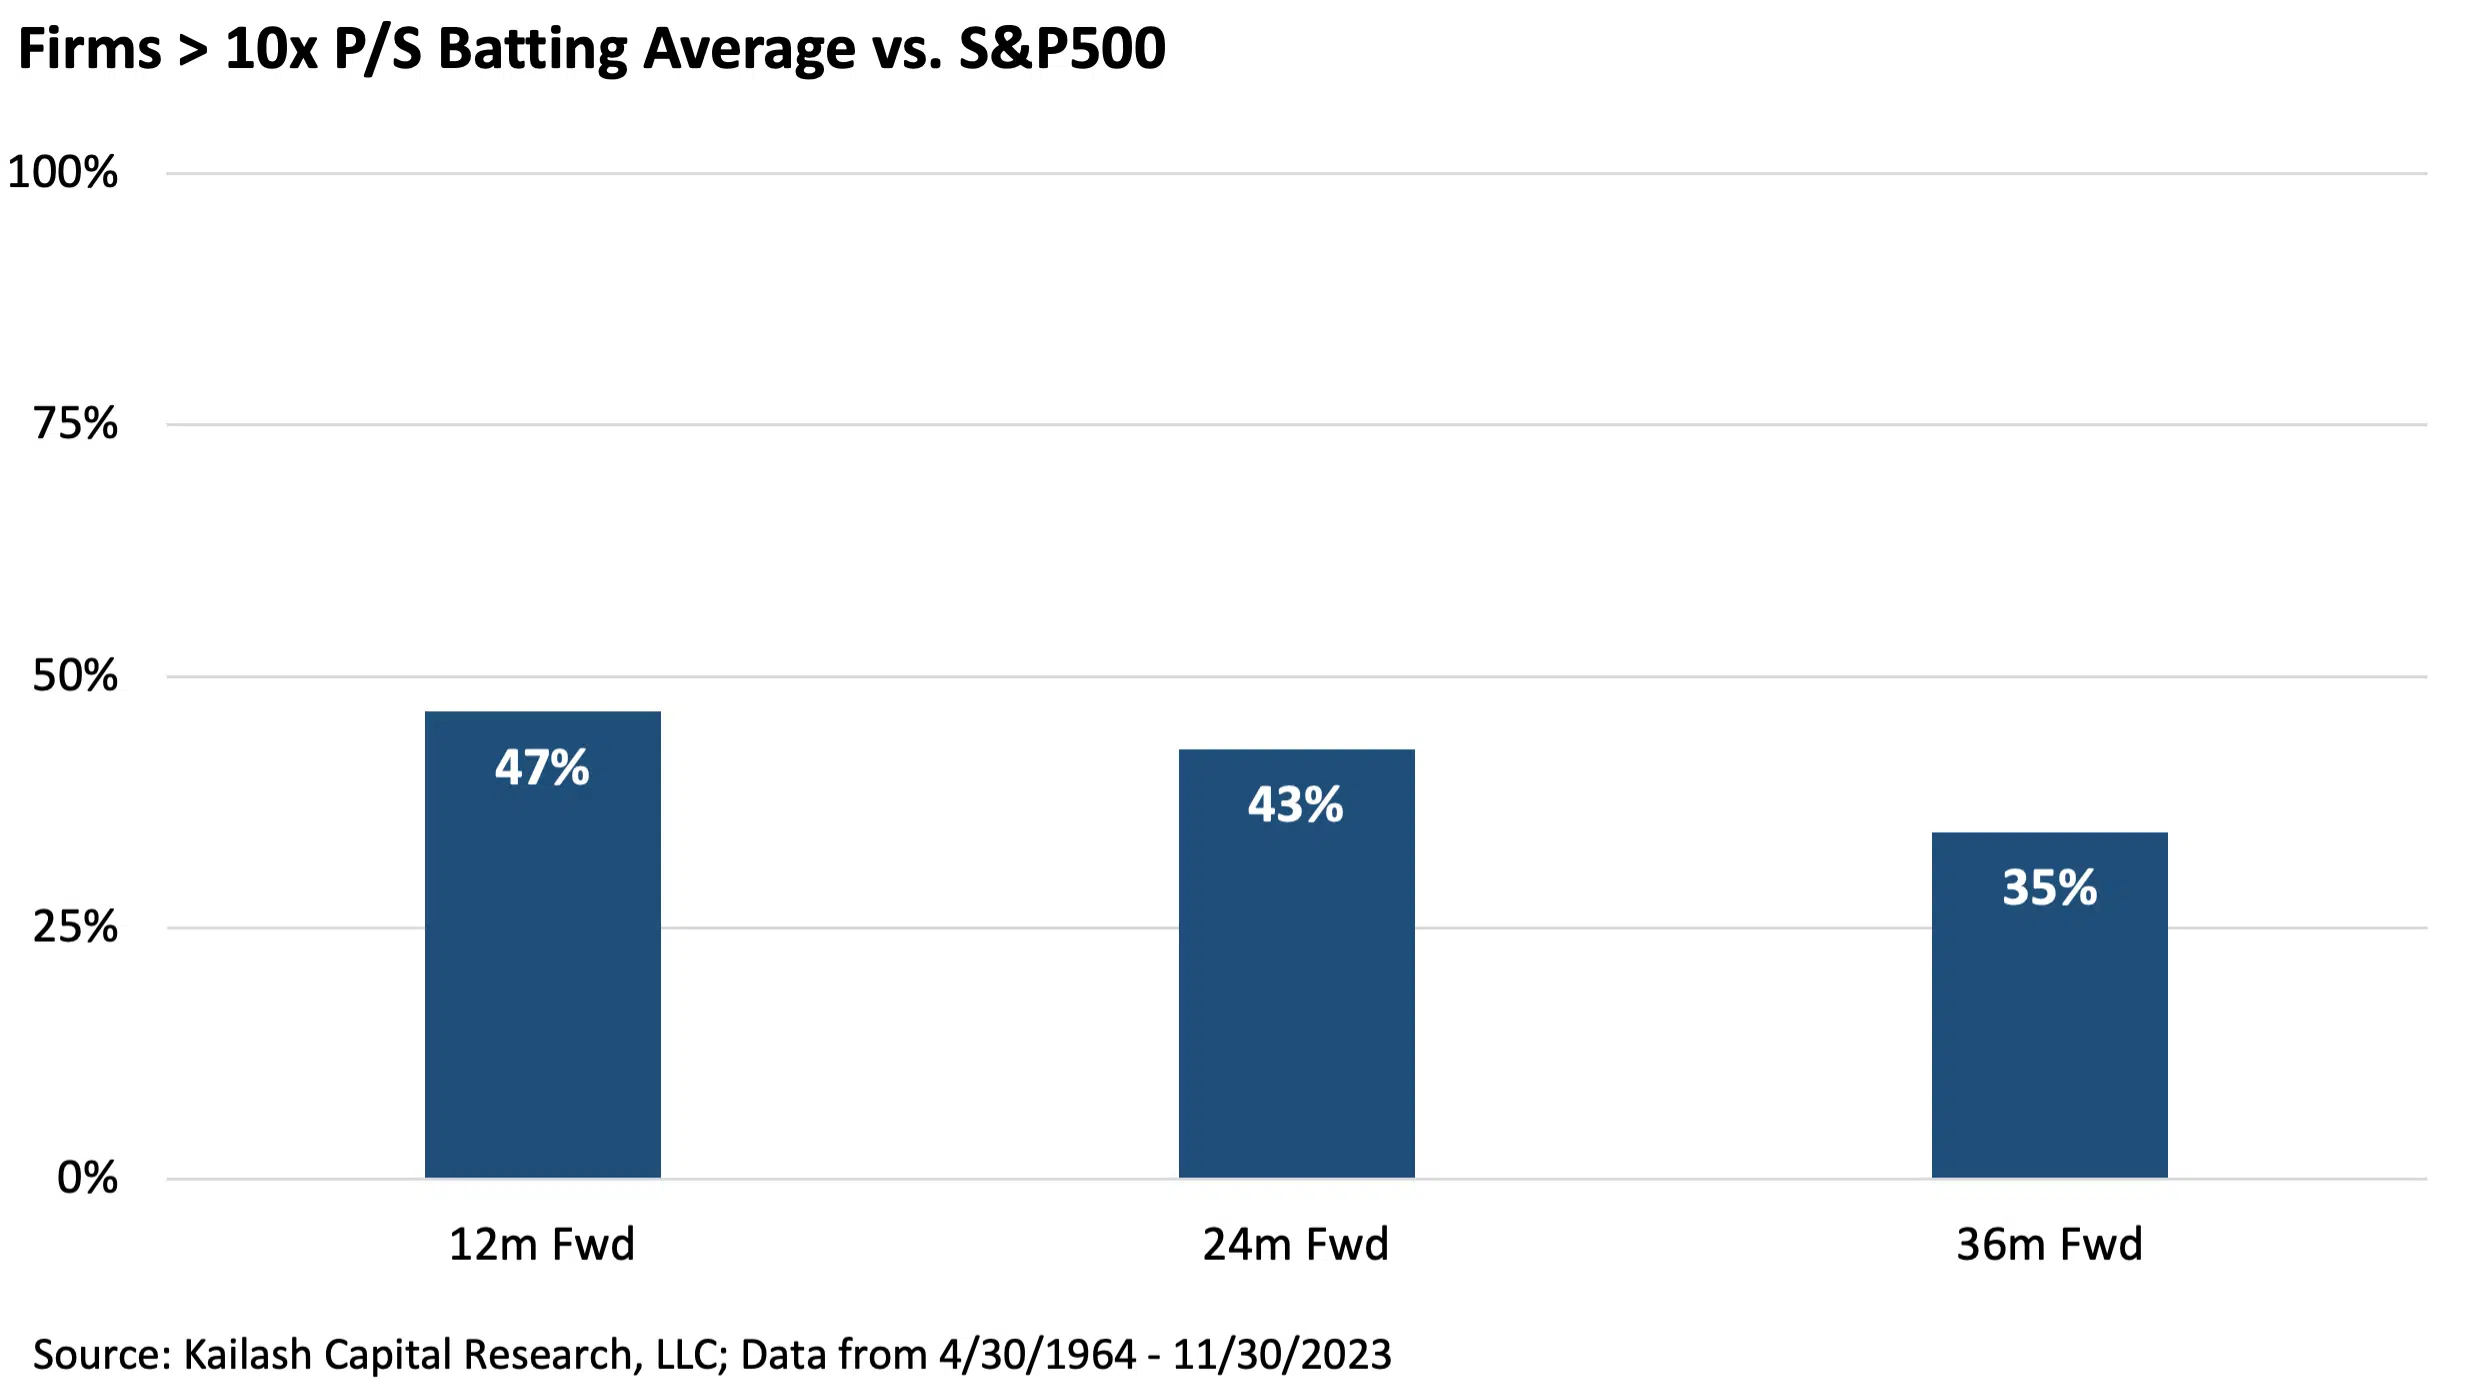
First, “batting averages,” or how often a stock valued at 10x price to sales (P/S) beats the S&P 500 over various horizons. The chart below shows that an owner of a stock valued at 10x P/S only beats the index:
First bar: 47% of the time over the subsequent 12 months.
Second bar: 43% of the time over the subsequent 24 months.
Third bar: the odds here are abysmal – owners of stocks >10x P/S win only 35% of the time over 36 months.
We’d remind our readers that the glitz of Las Vegas was built on a 1% advantage.
Let’s rephrase those facts to help us see the contrast more clearly. Someone holding a stock valued at 10x price to sales loses to the benchmark.
• 53% of the time over the next year. 100% – 47% = 53% loss rate
• 57% of the time over the next two years. 100% – 43% = 57% loss rate
• 65% of the time over the next three years. 100% – 35% = 65% loss rate.
Even worse, is that when owners of these expensive stocks lose, they lose by a massive amount. The chart below quantifies this for us:
First bar: an owner of a stock valued at over 10x price to sales loses to the benchmark by -19%, on average, in the next year.
Second bar: an owner of a stock valued at over 10x price to sales loses to the benchmark by -30%, on average, over the next two years.
Third bar: an owner of a stock valued at over 10x price to sales loses to the benchmark by -34%, on average, over the next three years.

To summarize the lessons of history:
• Employees are sitting on a record amount of stock-based compensation valued at over 10x P/S
• Stocks valued over 10x P/S have horrible batting averages and “reliably” lose to the index
• And when they lose, they lose by catastrophic amounts
The first row in the table below shows the fundamentals for all the stocks in the most expensive quintile of P/S that our models dislike with a market cap greater than $5bn. You can see these expensive stocks have minimal FCF/EV of 0.6%, trade at an incredible 11x sales and 69x P/E, are diluting shareholders, and have a volatility, or beta, of 1.3. Now compare that to the S&P 500 underneath. Not complicated.

Below, we list all the stocks that make up that first row. The expensive junk. There are 109 stocks on that list. If you are a Financial Advisor with a client who has a lot of money in one of these things, the case for diversification is urgent and supported by the evidence. KCR obviously has a much larger list of mediocre and expensive stocks that might blow up your clients (and your business). Please do not hesitate to reach out if you would like a broader universe.
We highlighted that by 1998, roughly 90% of Coca-Cola’s retirement plan was made up of KO stock, which was trading at 11x sales. Despite being a profitable, dividend-paying blue chip, the math is merciless at that multiple. A decade later, KO’s stock was still down.
The KCR team is a group of pragmatic optimists. Emphasis on “pragmatic.” We can be optimistic about America’s long-term prospects while still acknowledging the data from capital markets. The data suggests a more diversified and selective approach to investing has rarely looked more important than today.


Disclaimer
The information, data, analyses, and opinions presented herein (a) do not constitute investment advice, (b) are provided solely for informational purposes and therefore are not, individually or collectively, an offer to buy or sell a security, (c) are not warranted to be correct, complete or accurate, and (d) are subject to change without notice. Kailash Capital Research, LLC and its affiliates (collectively, “KCR”) shall not be responsible for any trading decisions, damages, or other losses resulting from, or related to, the information, data, analyses or opinions or their use. The information herein may not be reproduced or retransmitted in any manner without the prior written consent of KCR. In preparing the information, data, analyses, and opinions presented herein, KCR has obtained data, statistics, and information from sources it believes to be reliable. KCR, however, does not perform an audit or seek independent verification of any of the data, statistics, and information it receives. KCR and its affiliates do not provide tax, legal, or accounting advice. This material has been prepared for informational purposes only and is not intended to provide, and should not be relied on for tax, legal, or accounting advice. You should consult your tax, legal, and accounting advisors before engaging in any transaction.
Nothing herein shall limit or restrict the right of affiliates of KCR to perform investment management or advisory services for any other persons or entities. Furthermore, nothing herein shall limit or restrict affiliates of KCR from buying, selling, or trading securities or other investments for their own accounts or for the accounts of their clients. Affiliates of KCR may at any time have, acquire, increase, decrease, or dispose of the securities or other investments referenced in this publication. KCR shall have no obligation to recommend securities or investments in this publication as a result of its affiliates’ investment activities for their own accounts or for the accounts of their clients.
© 2023 Kailash Capital Research, LLC – All rights reserved.
September 10, 2024 |
| Authors: Matthew Malgari, Nathan Przybylo, Dr. Sanjeev Bhojraj and John Durkin
September 10, 2024
Authors: Matthew Malgari, Nathan Przybylo, Dr. Sanjeev Bhojraj and John Durkin