Over time, Midcap’s performance, diversified sector exposure, and growth potential suggest that midcaps deserve a dedicated allocation in any long-term portfolio. This series will highlight some key data supporting Midcap’s role in delivering advantaged returns.
Midcap stocks are typically defined as the 800 smallest stocks in the Russell 1000 Index. As a stand-alone asset class, they have often stood in the shadow of large-cap giants and small-cap upstarts. Rarely has that been a more accurate appraisal of markets than today.
Indulging in excessive extrapolation, investors have put their full-faith into one of the most inefficient market pricing structures we have seen. We’ll write more about that inefficiency later.
Get our insights direct to your inbox: SUBSCRIBE
Today we are going to snap through some simple charts that make the basic case for why a dedicated allocation to the Midcap Sector is a “must-have” for disciplined investment programs.
Investors in many Large Cap Index Funds and actively managed products that compete with said indexes often assume they are getting reasonable exposure to midcap stocks. That has never been less true than today.
The chart below shows the weighting of Midcaps in the Russell 1000 since 1964.[1] No matter if you are using Large Cap Index Funds or Actively Managed Funds, investors’ exposure to Midcaps has never been this low.
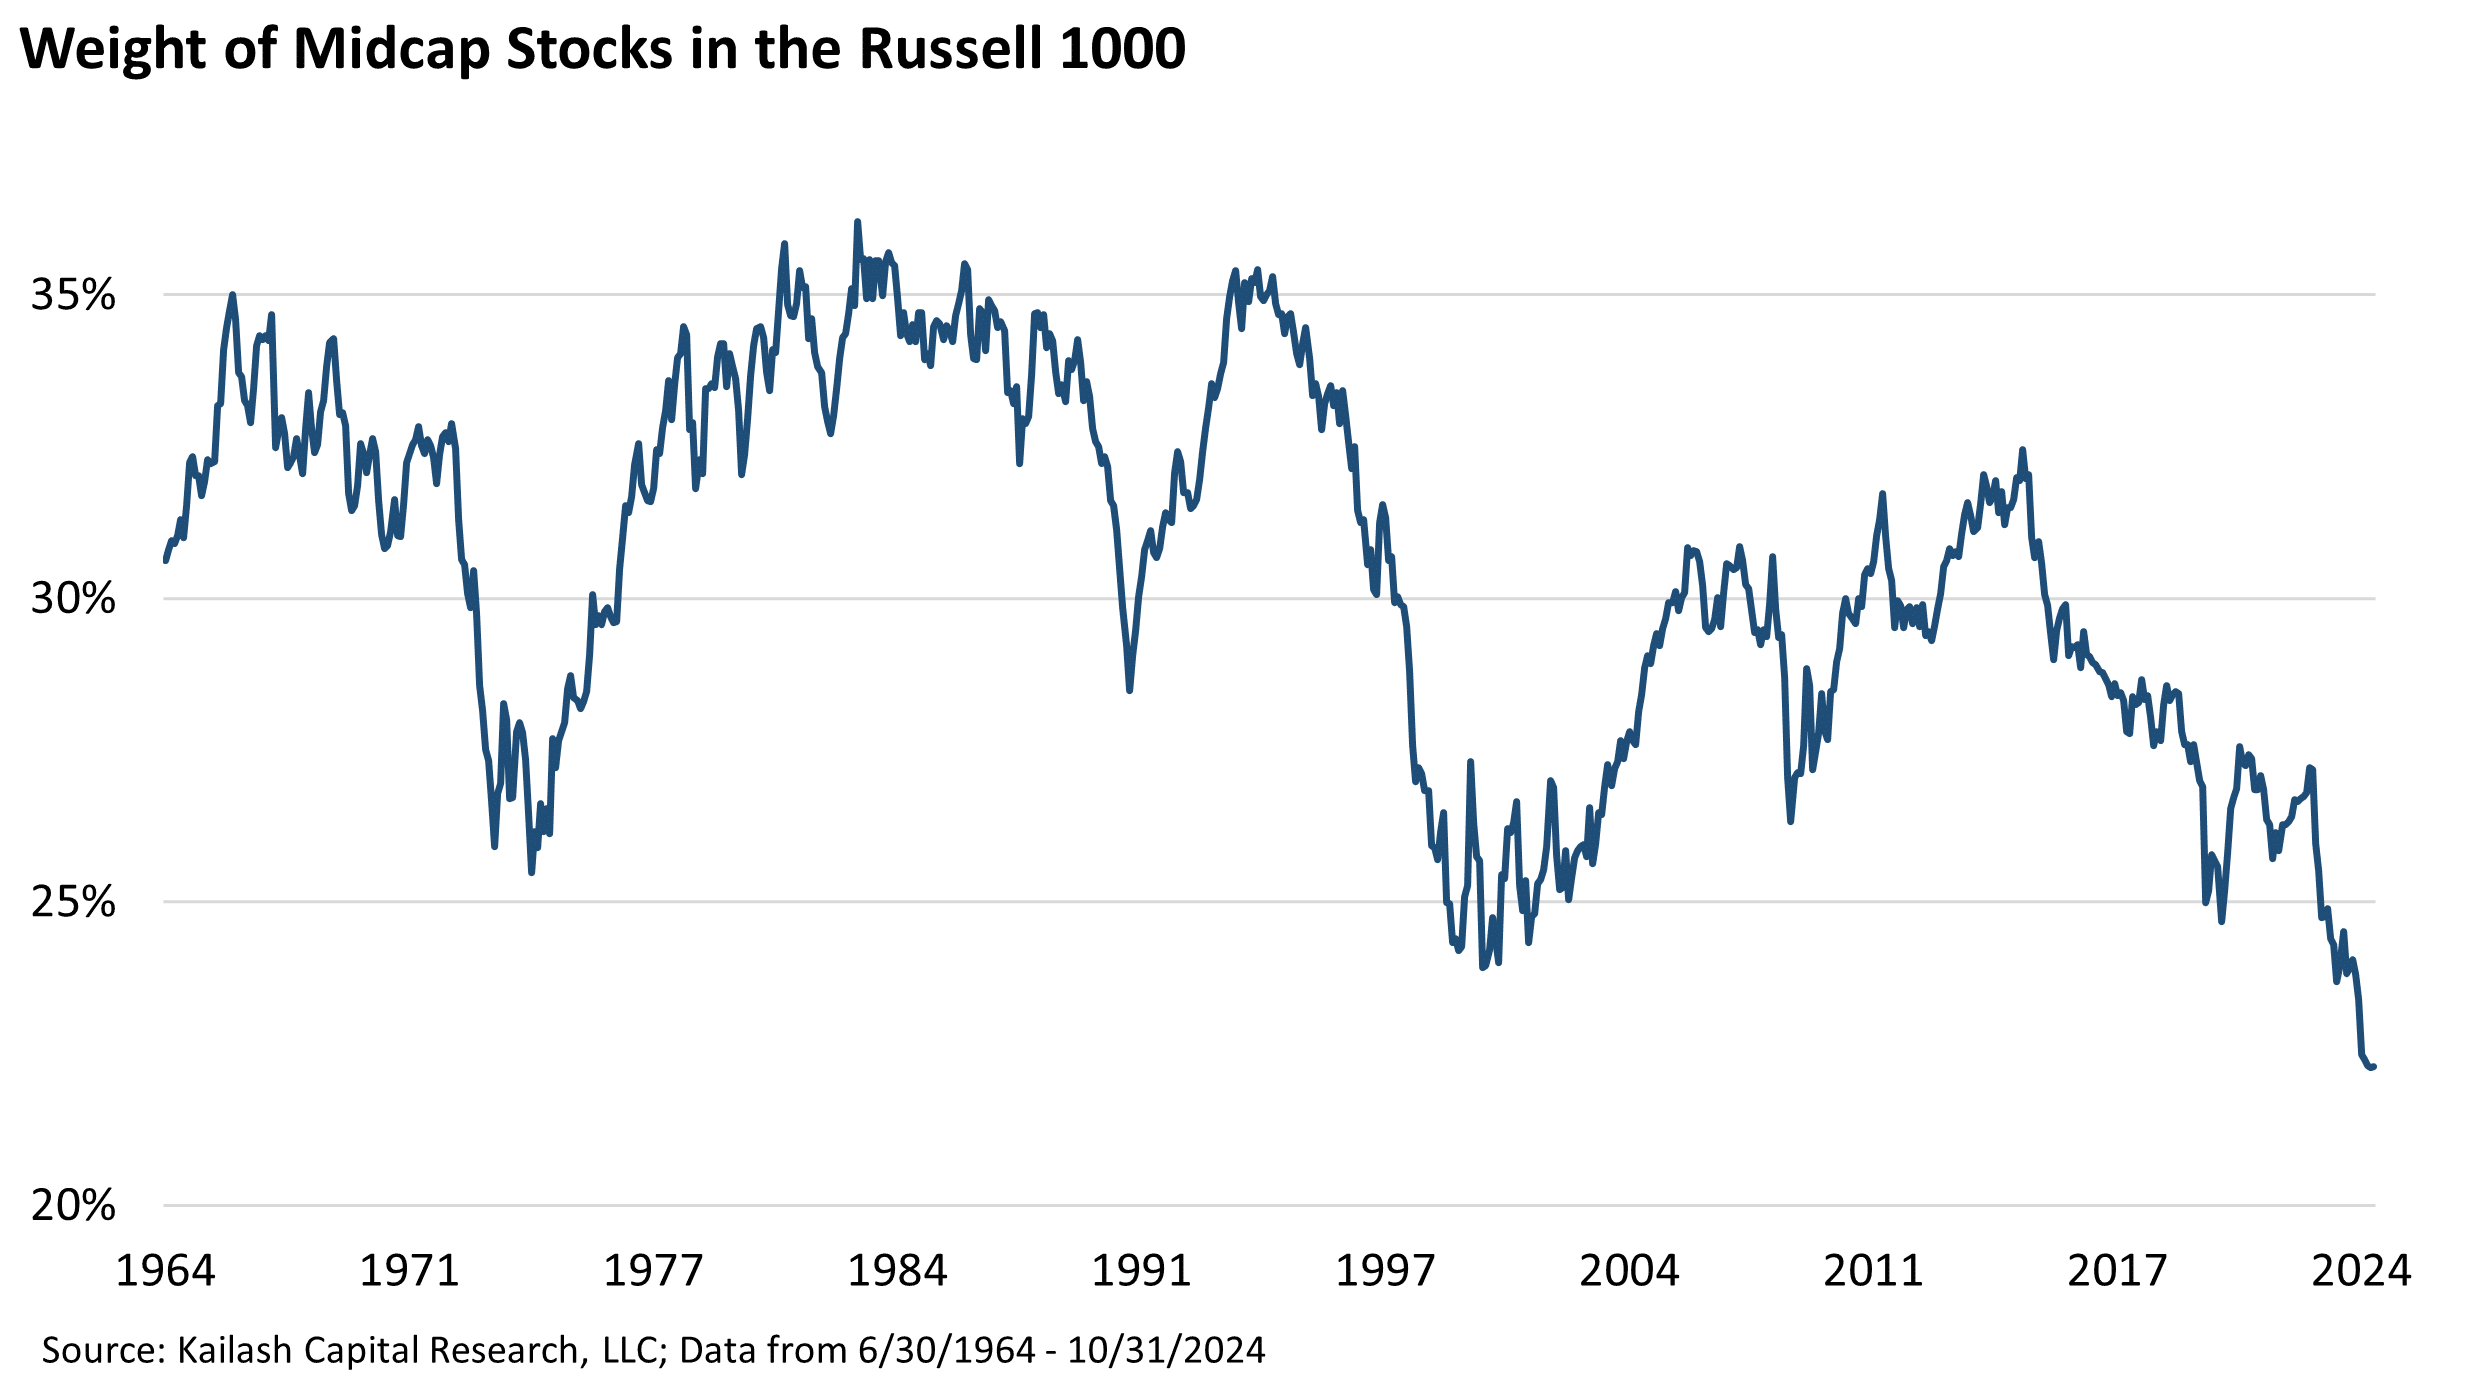
This record-low exposure to midcaps today is unfortunate. Let’s walk through why.
The only other instance where investor exposure was so lopsided to large caps was the peak of the dot.com bubble. In that moment, those who clung to the large cap index would see the value of their holdings tumble and it took a full five years to break even. In contrast, investors with the courage to rotate into midcaps would watch as those smaller, more modestly valued, and economically nimble stocks soared over those five years. Since 12/31/1999, midcaps are up 790% and the R1 is up only 539%. 24 years and the R1 is still losing.

The chart below shows the performance of $1 invested in midcaps compared to $1 invested in the Russell 1000 from 1964 to 2024. Over this 60-year period, midcaps significantly outpaced the Russell 1000.

The chart below shows the historical batting average of midcaps vs. the Russell 1000 large cap index. Midcaps consistently beat the Russell 1000 index over all rolling 1-, 3-, 5-, and 10-year rolling horizons. It is easy to dismiss a 55% batting average but what is a casino’s edge in blackjack? These are non-trivial numbers.

This trend underscores a critical advantage: midcap stocks tend to consistently deliver solid returns, which can be especially valuable for long-term investors. By maintaining a dedicated allocation to midcaps, investors can harness this consistency to potentially enhance their portfolio’s overall performance.
In addition to their performance and growth potential, midcap stocks offer a more balanced sector distribution compared to the Russell 1000.
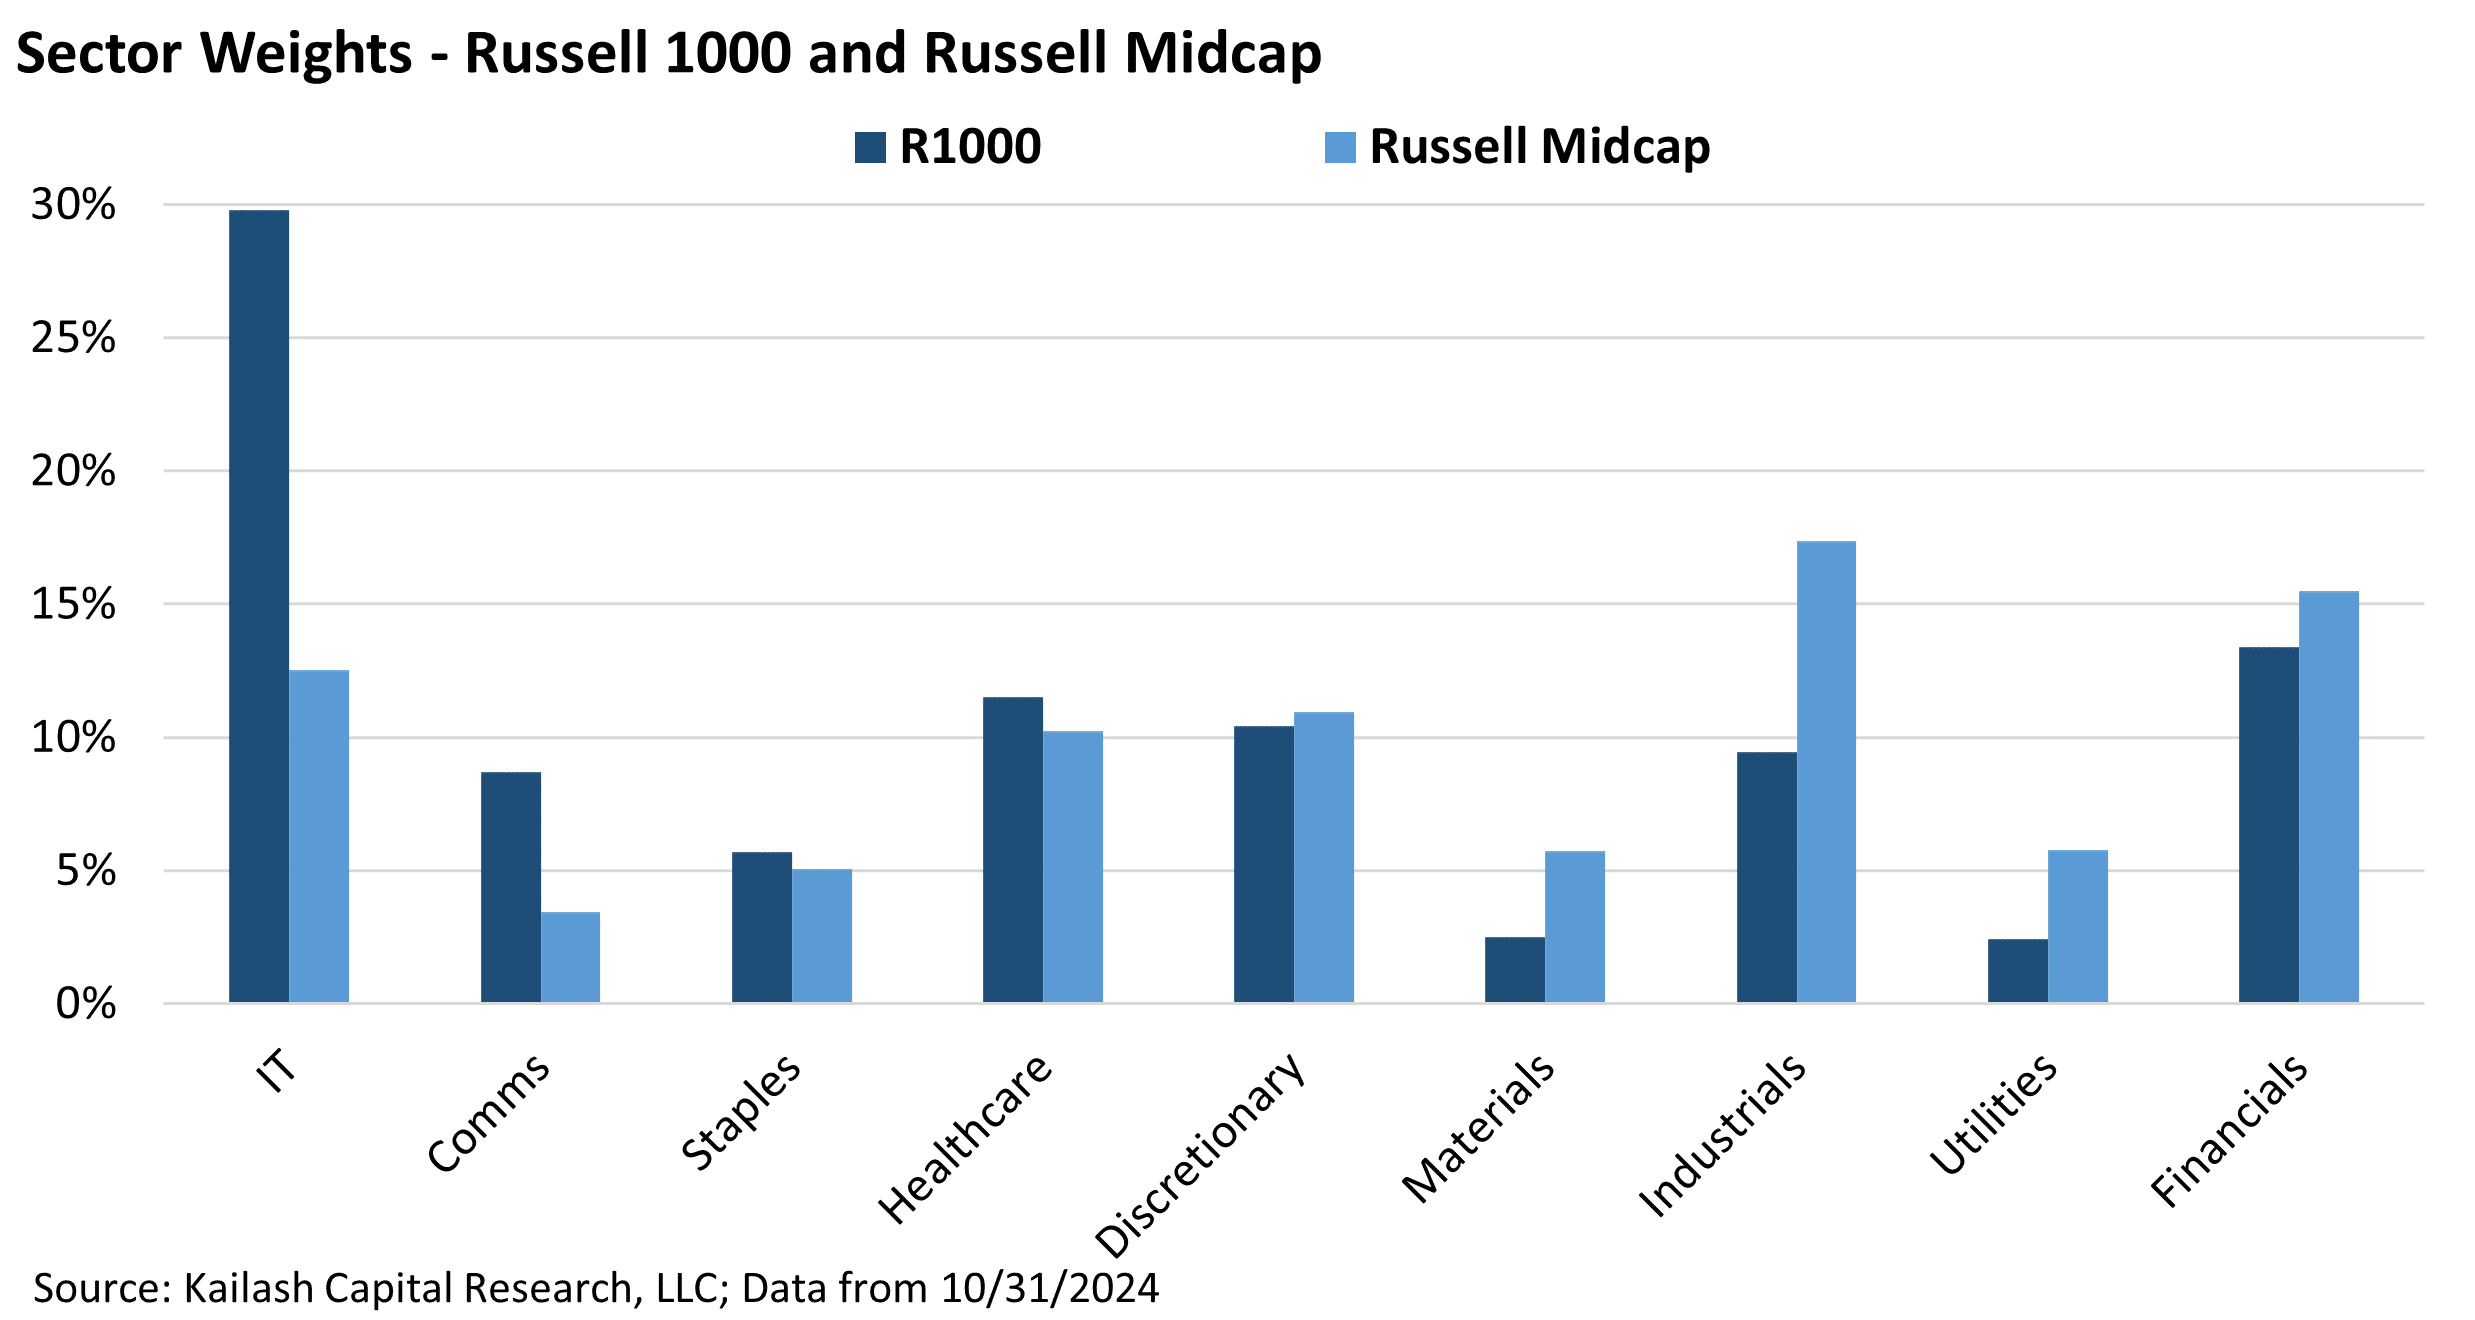
The Russell 1000’s concentration in Information Technology exceeds 25%, whereas the sector allocation within midcaps is notably more diversified, with more representation in Industrials, Consumer Discretionary, and Financials. This diversified sector exposure helps mitigate risks associated with overreliance on a single industry, an issue that can affect more concentrated large-cap indices.
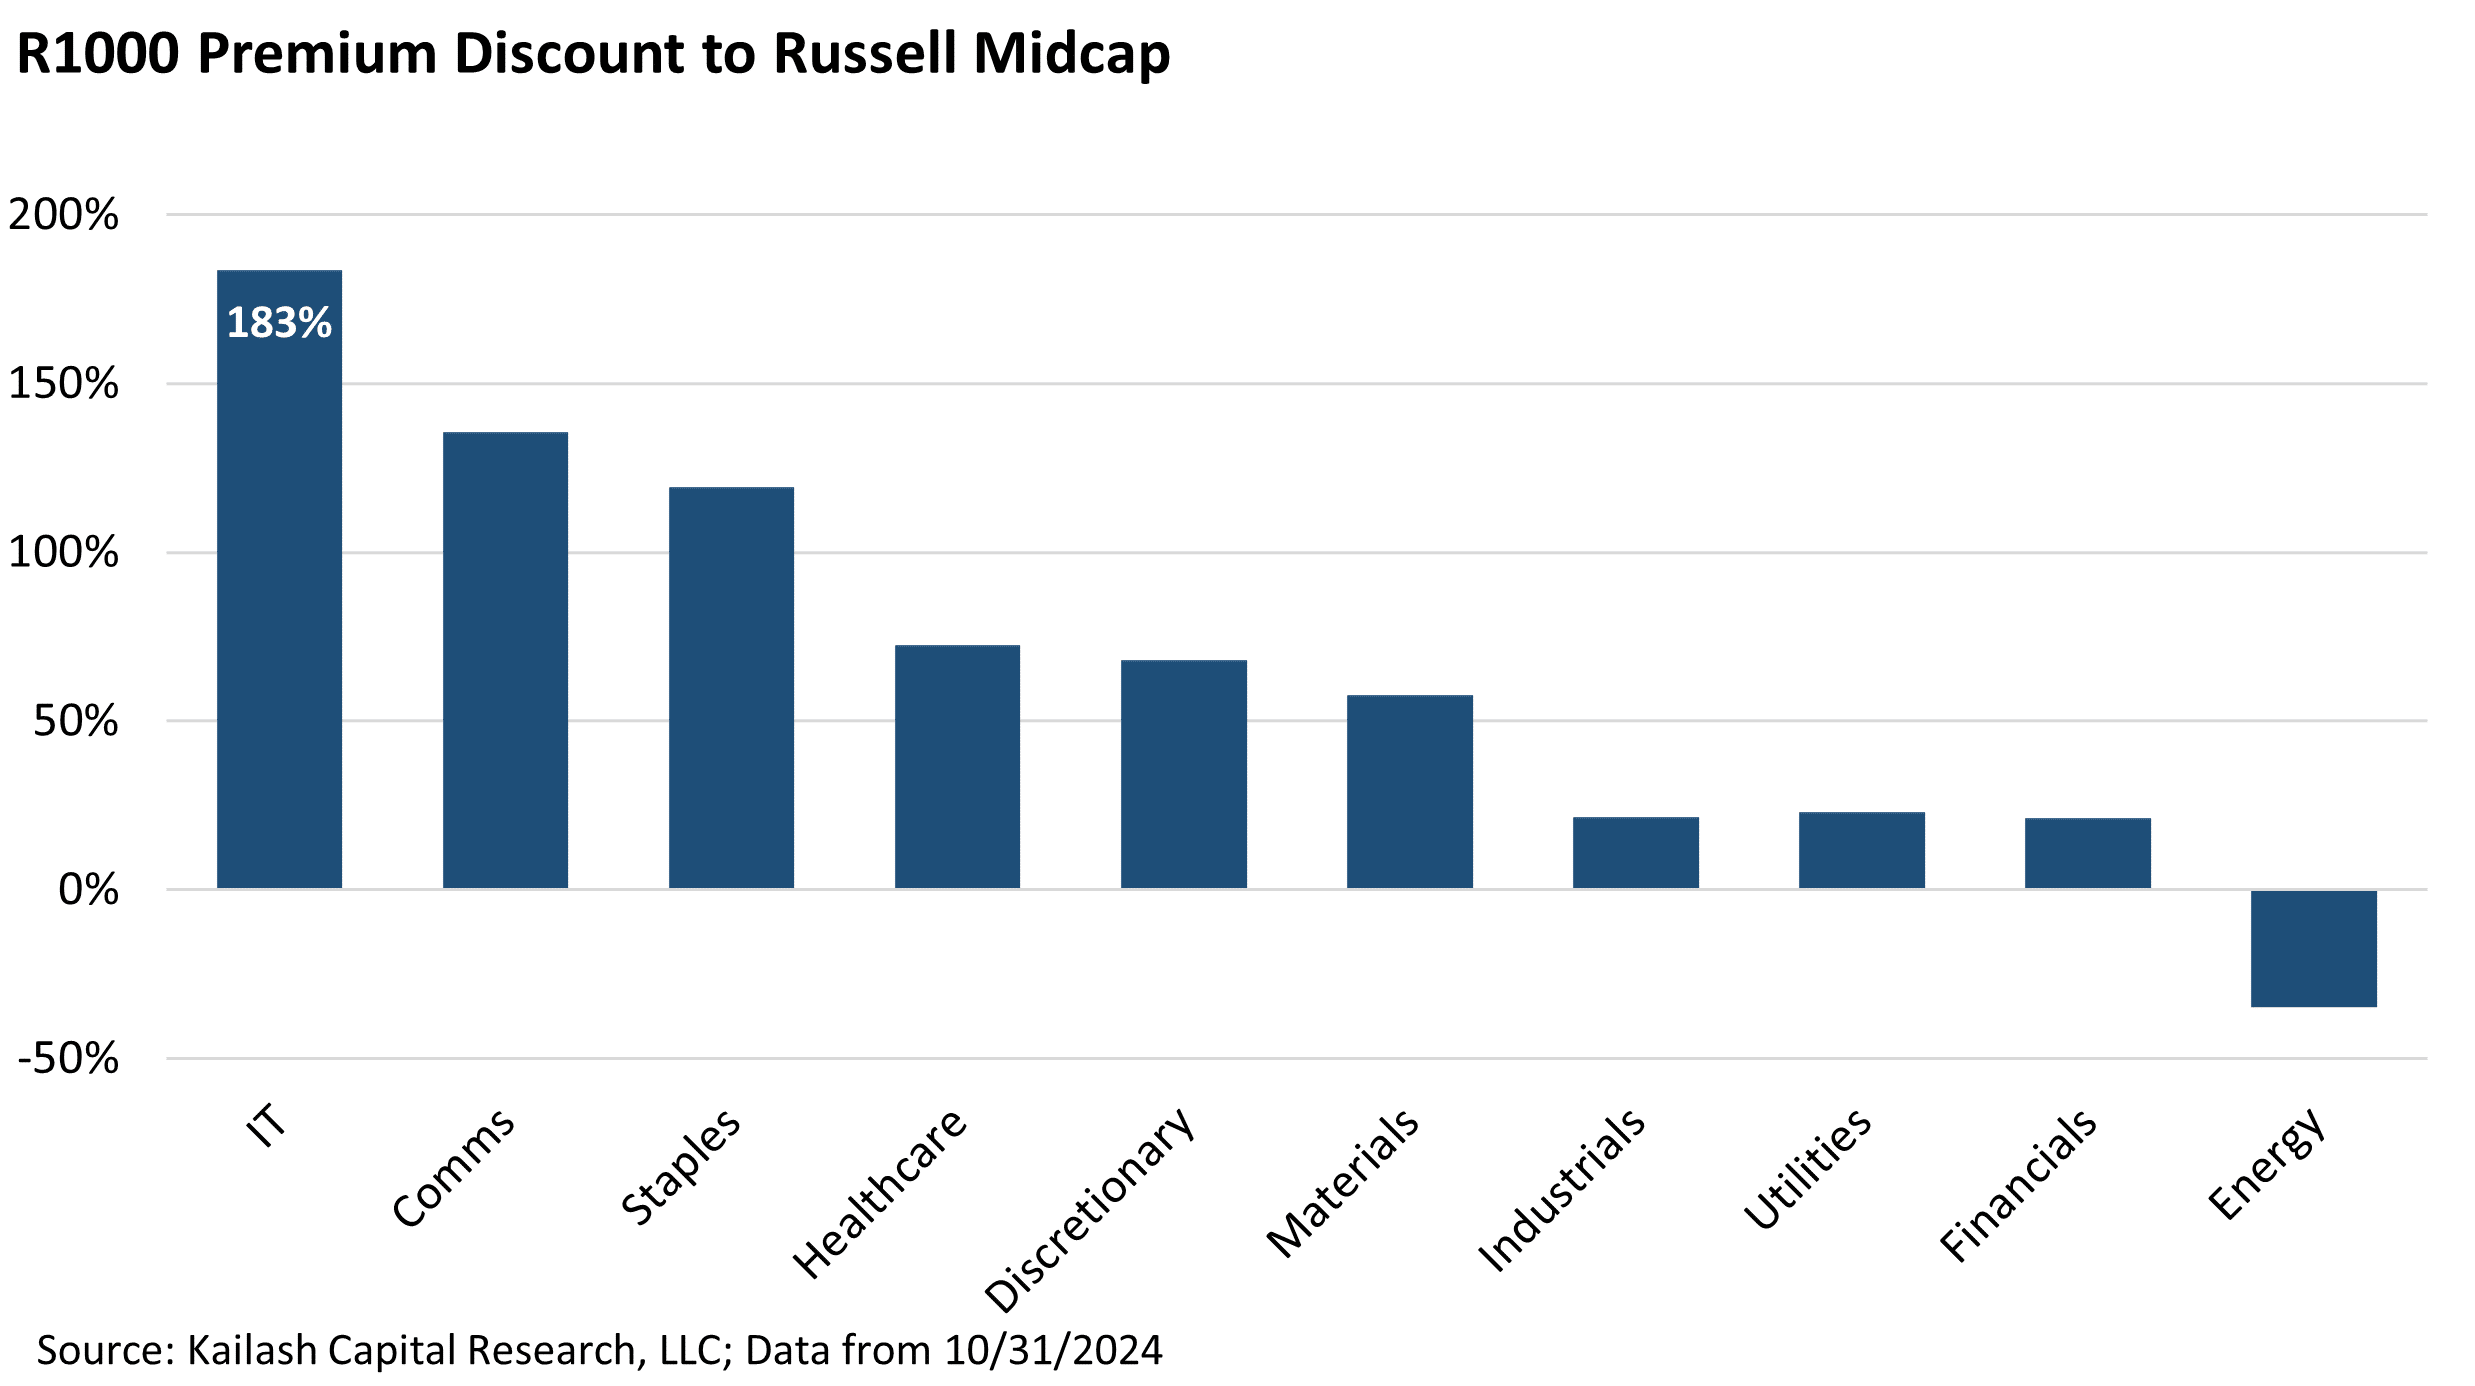
The chart below shows the premium or discount of the sectors in the Russell 1000 Index today compared to the sector exposure in the Russell Midcap Index today. When the bar is above zero it means the Large Cap sector is more expensive than the equivalent sector in the Midcap benchmark.
For example, the first bar shows that the Russell 1000’s technology stocks trade at a 183% premium to the tech stocks in the Russell Midcap index. Looking from left to right, you can see that every sector, excluding Energy, is more expensive in the Russell 1000 compared to the Midcap benchmark. So not only does Midcap provide investors with much more balanced sector exposure, but the stocks within those sectors also tend to trade at deep discounts to their large cap peers.
Combined, we think it is reasonable to believe this further strengthens midcaps’ value proposition, providing a risk-reward profile that can enhance overall portfolio stability.
Conclusion
The data reviewed here presents a compelling case for midcap stocks as a key component in long-term investment strategies. Midcaps have consistently outperformed broader indices and large-cap stocks over various rolling periods, illustrating their reliability and growth potential. The long-term performance of midcaps, as evidenced by the power of compounding over six decades, highlights their capacity to deliver significant returns. Additionally, midcaps offer a balance of higher returns and diversified sector exposure, which can provide investors with an attractive risk-reward profile.
Below we have listed KCR’s Top 25 Midcap Stocks for December 2024.
Our next piece on Midcaps will provide compelling evidence on why today may represent one of the most opportune times to diversify into midcaps.


Disclaimer
The information, data, analyses, and opinions presented herein (a) do not constitute investment advice, (b) are provided solely for informational purposes and therefore are not, individually or collectively, an offer to buy or sell a security, (c) are not warranted to be correct, complete or accurate, and (d) are subject to change without notice. Kailash Capital Research, LLC and its affiliates (collectively, “KCR”) shall not be responsible for any trading decisions, damages, or other losses resulting from, or related to, the information, data, analyses or opinions or their use. The information herein may not be reproduced or retransmitted in any manner without the prior written consent of KCR. In preparing the information, data, analyses, and opinions presented herein, KCR has obtained data, statistics, and information from sources it believes to be reliable. KCR, however, does not perform an audit or seek independent verification of any of the data, statistics, and information it receives. KCR and its affiliates do not provide tax, legal, or accounting advice. This material has been prepared for informational purposes only and is not intended to provide, and should not be relied on for tax, legal, or accounting advice. You should consult your tax, legal, and accounting advisors before engaging in any transaction.
Nothing herein shall limit or restrict the right of affiliates of KCR to perform investment management or advisory services for any other persons or entities. Furthermore, nothing herein shall limit or restrict affiliates of KCR from buying, selling, or trading securities or other investments for their own accounts or for the accounts of their clients. Affiliates of KCR may at any time have, acquire, increase, decrease, or dispose of the securities or other investments referenced in this publication. KCR shall have no obligation to recommend securities or investments in this publication as a result of its affiliates’ investment activities for their own accounts or for the accounts of their clients.
© 2023 Kailash Capital Research, LLC – All rights reserved.
December 5, 2024 |
| Authors: Matthew Malgari, Nathan Przybylo, Dr. Sanjeev Bhojraj and John Durkin
December 5, 2024
Authors: Matthew Malgari, Nathan Przybylo, Dr. Sanjeev Bhojraj and John Durkin