In Part I of our piece on Midcap stocks, we led out with a chart showing that investors’ allocation to midcap stocks had fallen to levels last seen at the peak of the dot.com bubble; the lowest levels since 1964. We explained how investors willing to pivot into unloved midcaps in 1999 saw outsized gains while those who remained in the large cap index spent five solid years earning precisely nothing. Today’s work presents data that suggests it may be one of the best moments in history for investors to tack into high quality midcaps.
Get our insights direct to your inbox: SUBSCRIBE
Summary:
Large-cap stocks, as represented by the Russell 1000 Index, have reached valuation levels that rival or exceed speculative peaks seen in 2000 and 2021, underscoring a significant concentration of market enthusiasm in the largest companies. Price-to-sales (P/S) ratios for the top 50 stocks in this group now stand at nearly three times those of their mid-cap peers, creating one of the largest valuation gaps in modern history.
This disparity is not just a number on a chart; it reflects an increasingly crowded trade in large-cap equities that has led to heightened concentration risk. Investors have favored these giants in the wake of macroeconomic uncertainty and liquidity-driven rallies. Yet, the historic premium on these companies signals that future returns may be constrained. Conversely, midcap stocks, with their more modest valuations and historically consistent performance, represent a compelling alternative.
Importantly, midcaps have historically delivered steady earnings and sales growth, often outpacing their larger counterparts over extended periods. As large-cap valuations soar, midcaps offer a balance of growth and stability that could drive meaningful long-term portfolio returns. The current environment, marked by extreme valuation divergences, suggests it might be one of the best opportunities in decades to realign portfolios away from the overextended large-cap space and toward midcap equities.
By capitalizing on these dynamics, investors can position themselves not only to reduce concentration risk but also to benefit from the robust growth potential of mid-sized companies. The choice to pivot now could be the key to effectively navigating this unique market landscape.
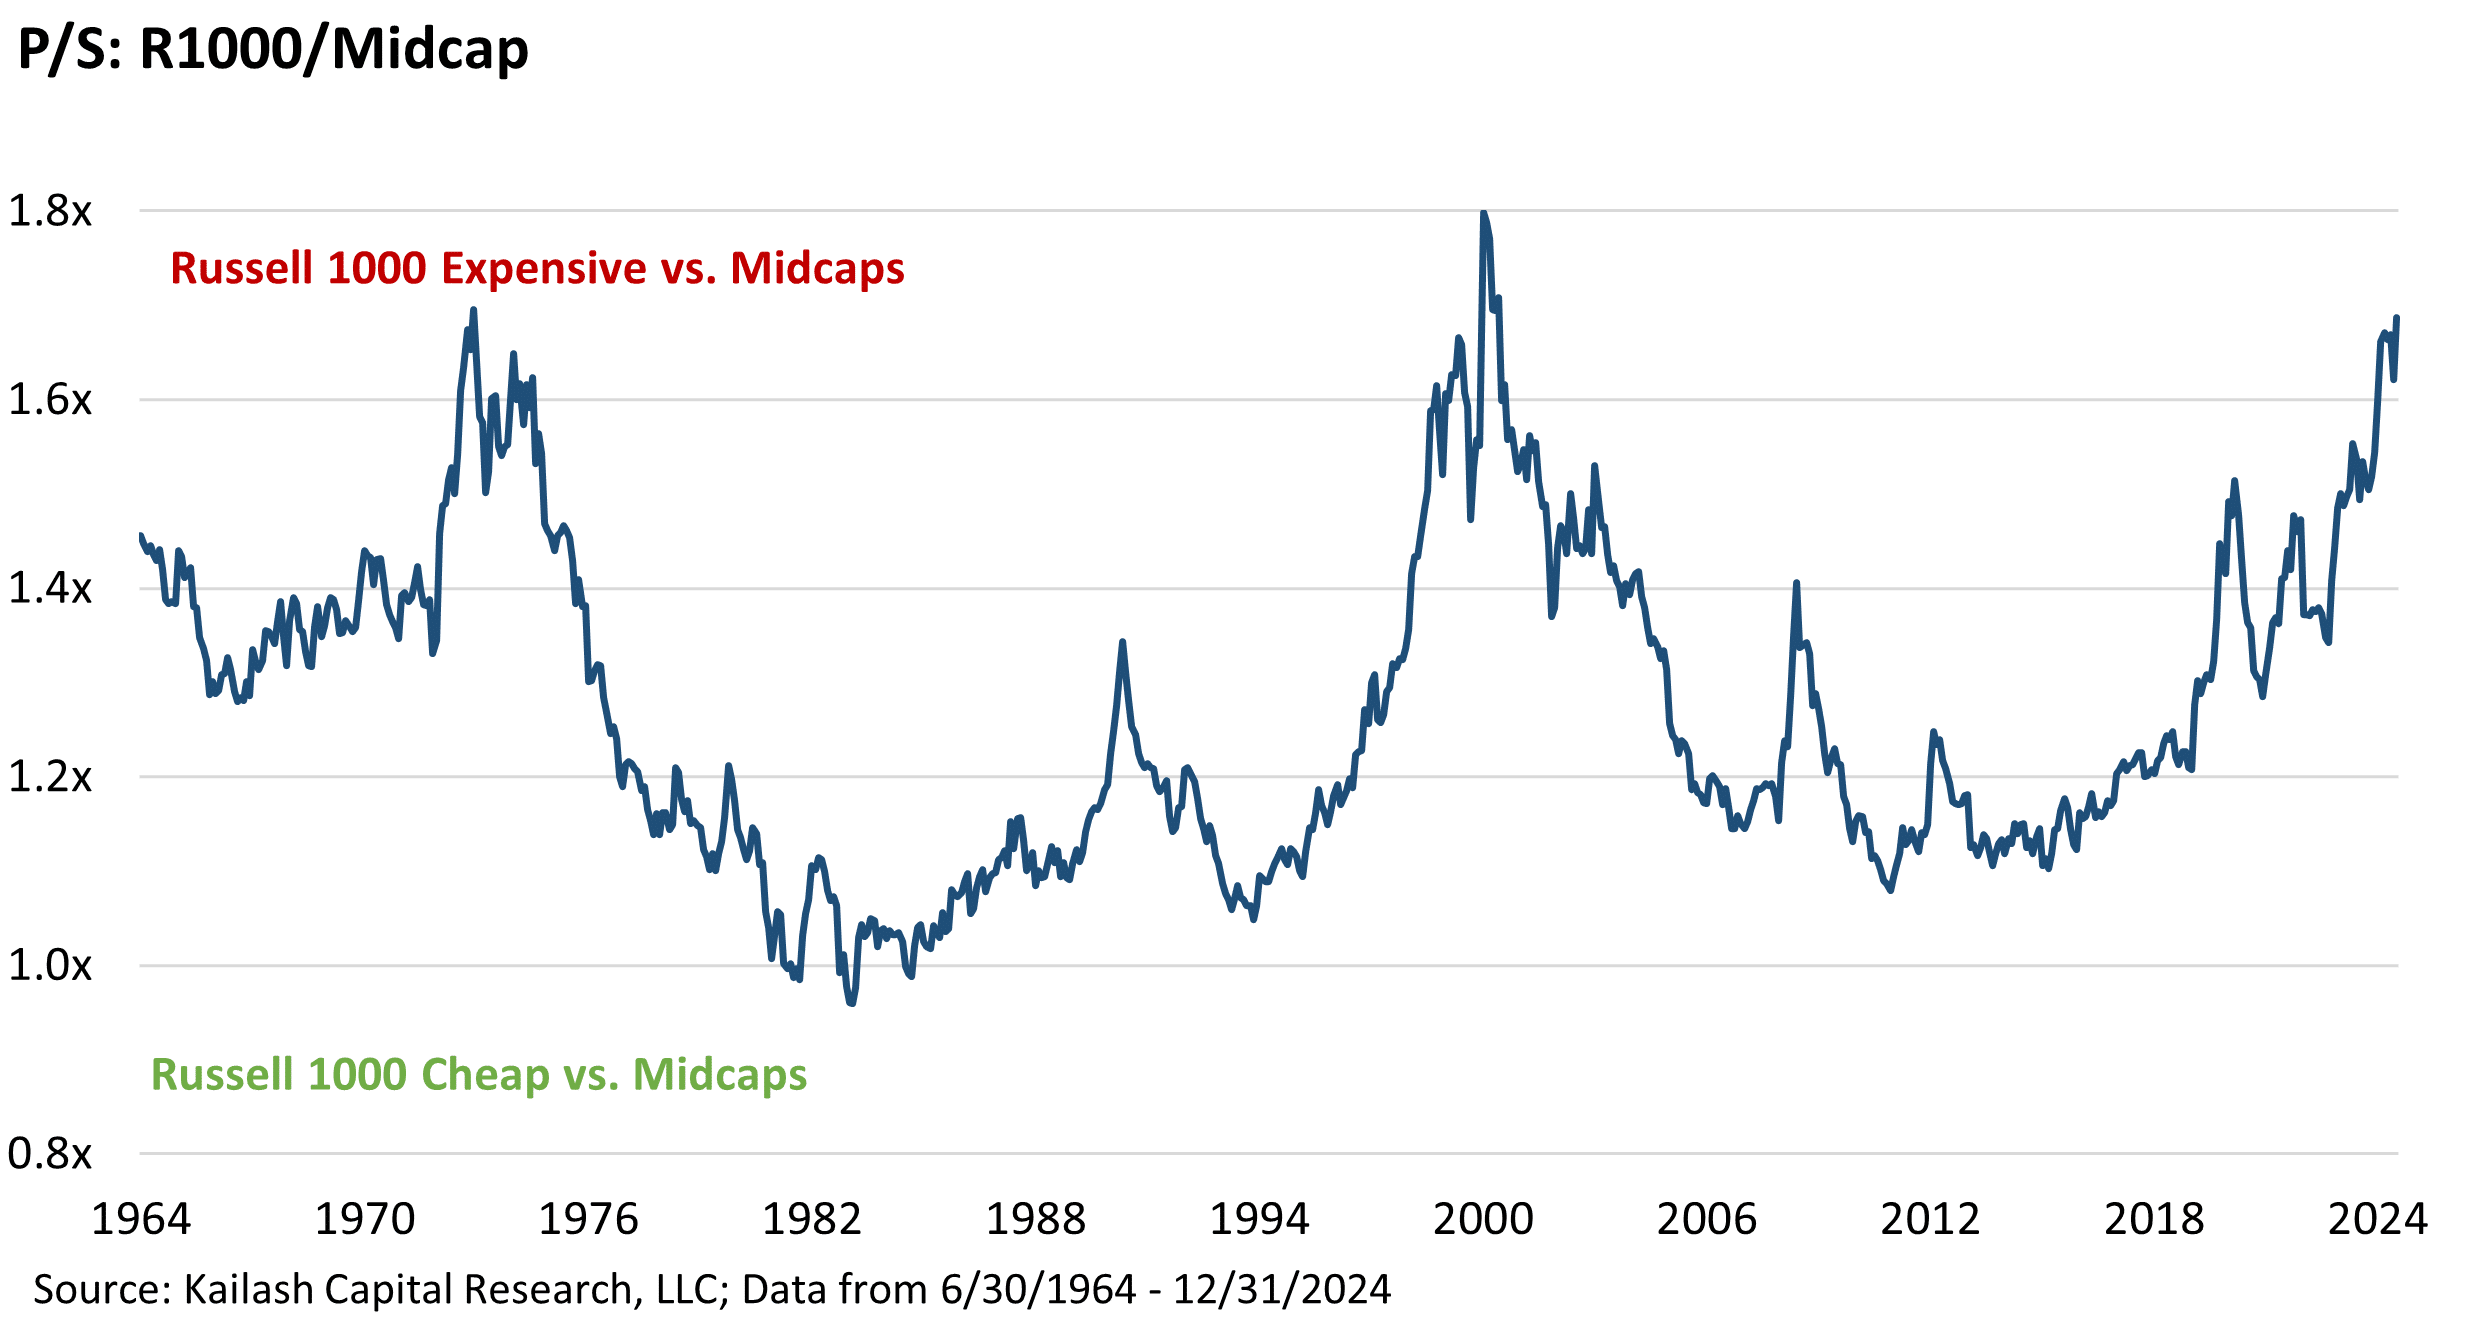
The chart below shows the price to sales ratio of the Russell 1000 and the Russell Midcap benchmarks. This isn’t complicated: the R1000 is more expensive than the peak of the dot.com bubble while midcaps are valued at nearly the same multiple as they were in 1999 – which marked a five-year stretch of massive outperformance.

We’ll move through the rest of these valuation exhibits quickly because the data is painfully compelling. The chart below simply divides the P/S ratio of the Russell 1000 by the P/S ratio of the Russell Midcap. The higher the line, the more overvalued large caps are relative to midcaps. Not complicated.
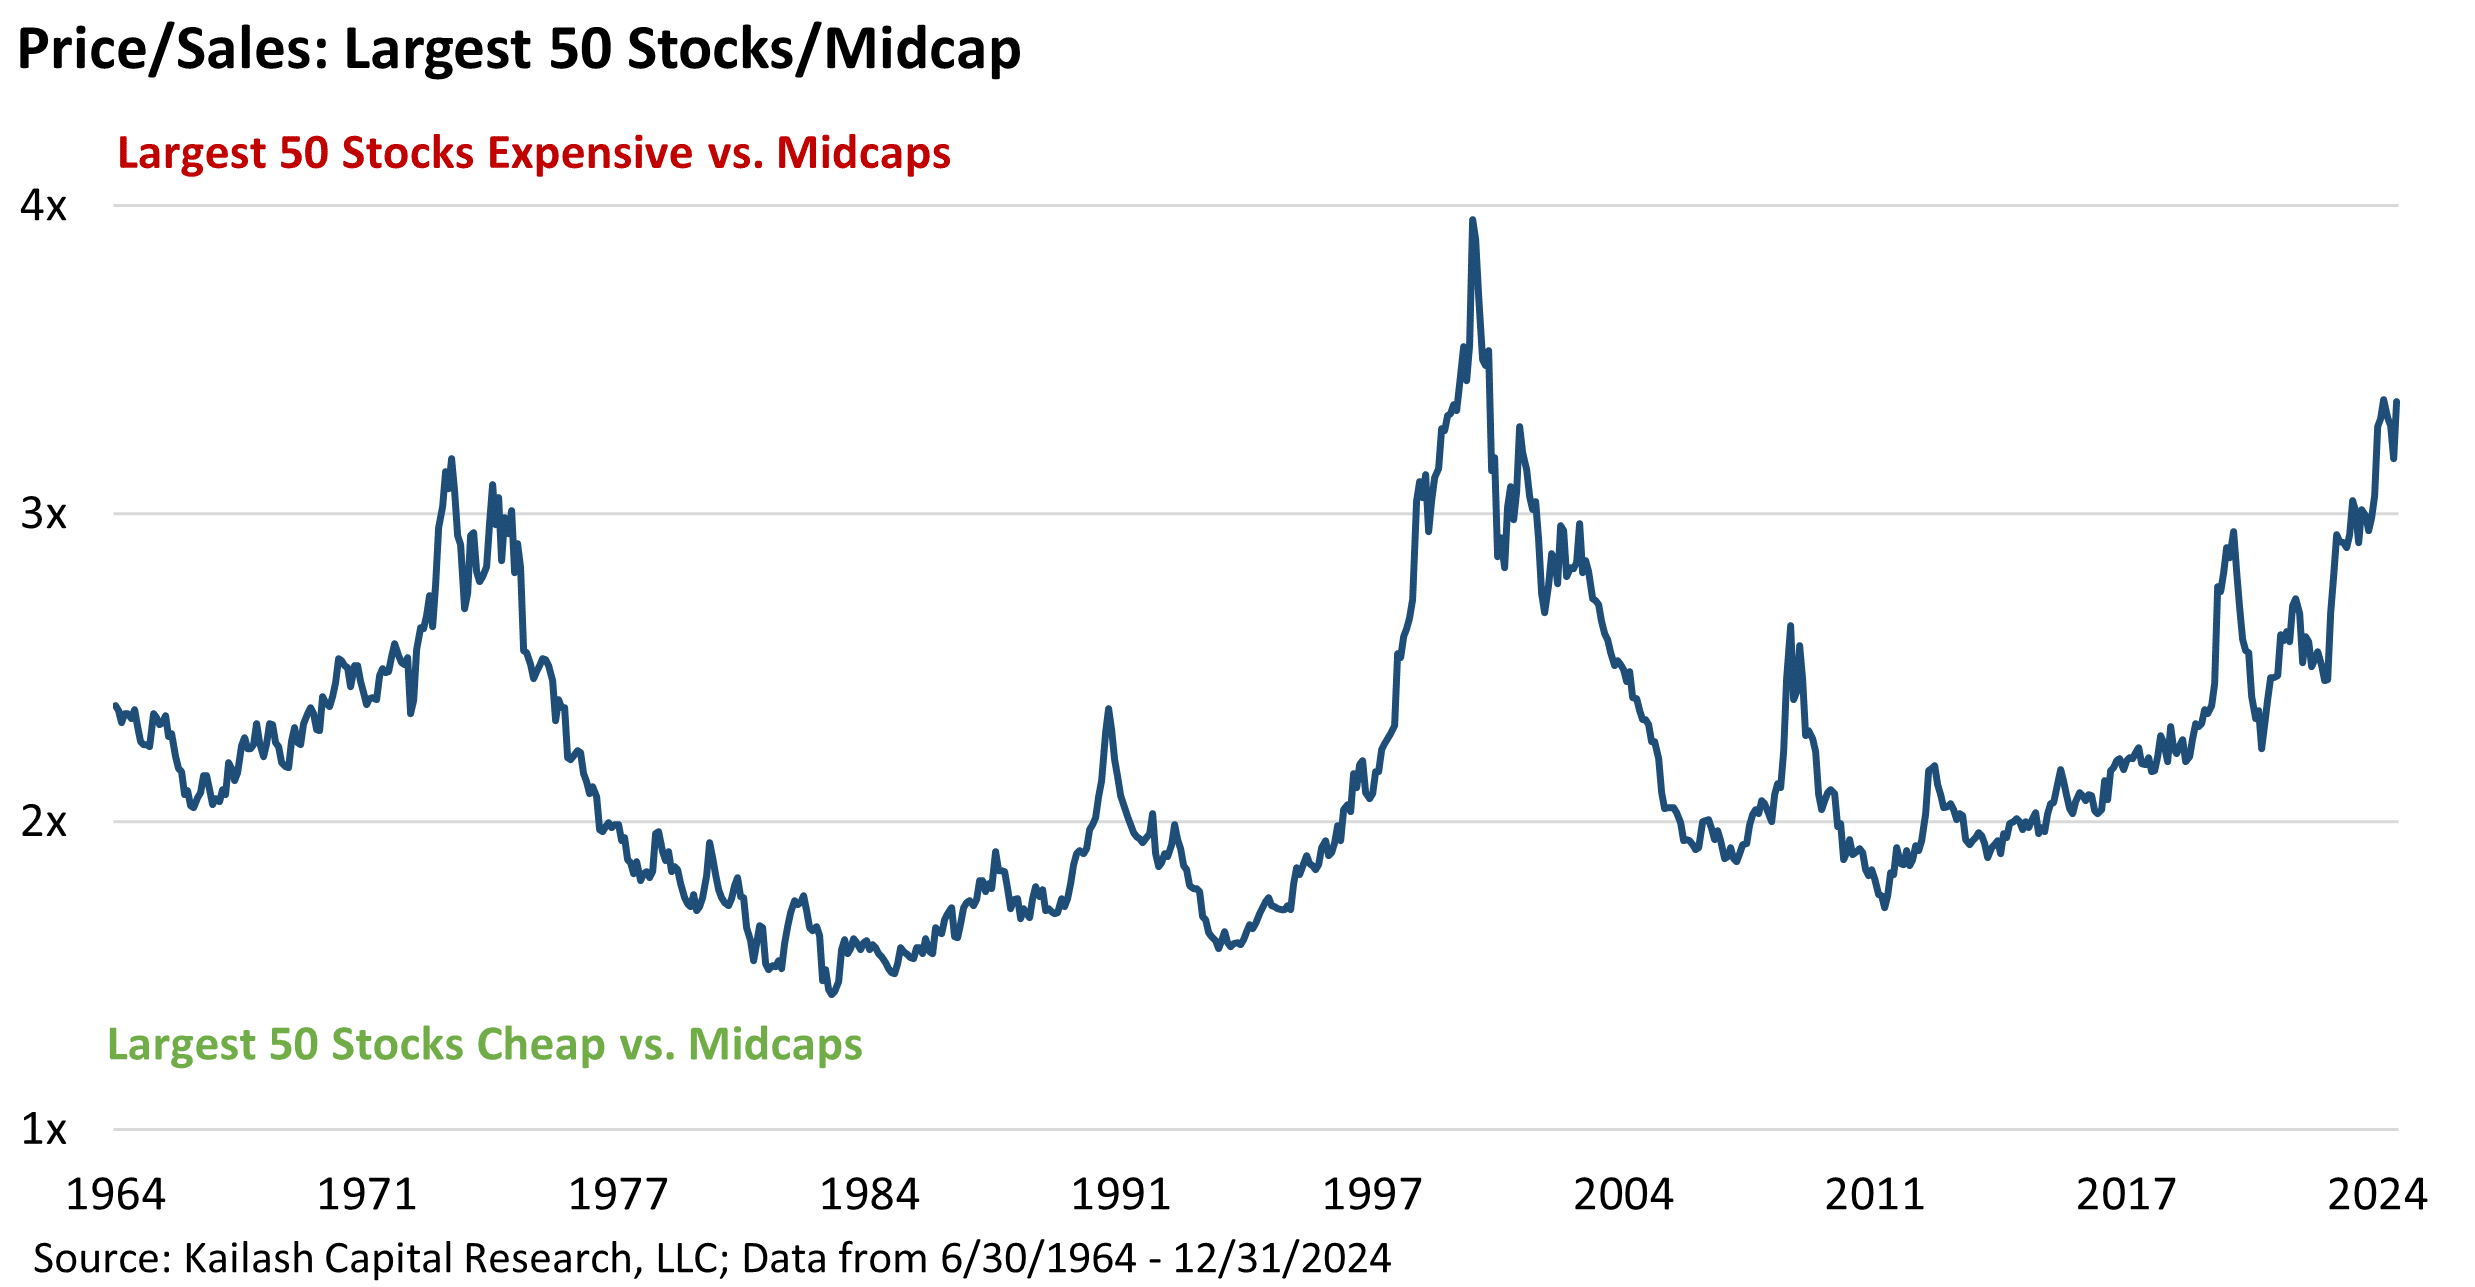
This next chart shows the P/S ratios of the largest 50 stocks have surged to nearly 5x, compared to Midcap’s ~1.5x multiple. This chart contrasts the extraordinary valuation risk of the market’s largest companies with the more moderate valuations offered by midcaps. Not complicated.

This chart divides the P/S ratio of the 50 largest stocks by the P/S ratio of the midcap index. The ratio of P/S for the largest 50 stocks has climbed to ~3x that of midcaps. A generational valuation disparity.
Why have we failed to learn the lessons of history? Many believe rapid earnings growth justifies these premiums. This is classic extrapolation bias. We recently used NVDA to show how dangerous this was.
The 50 largest listed companies in America have a market cap totaling $32.0 trillion dollars and produced a prodigious $937bn in earnings. Over the last three years they grew earnings by ~50%; a 14% annualized growth rate. The bars in the chart below show what would happen if the Top 50 continued to grow earnings at 14% per year for the next decade. Profits would soar to $3.5 trillion dollars.

The charts below show why extrapolating this 14% growth rate is ridiculous.
- Since 1947, U.S. Gross Domestic Product (GDP) has grown at an average of 2% annually. [1]
- For the sake of argument, let’s assume the hype around AI creates an economic windfall for the US…
- …and our economy grows at double its long-run historical average for the next decade. So, 6% a year.
The navy-blue bars (left hand axis) show that if the US grows at double its historical rate for a solid decade, by 2035 US GDP will hit ~$53 trillion. Anything is possible.

Now the light blue bars are where things get interesting. They take the profits of America’s 50 largest companies, growing at 14% a year and divide that profit number by our forecasted GDP number. They are scaled on the right-hand axis.
This shows you what percentage of total US GDP the profits of the 50 biggest stocks would represent. So, the left-most light blue bar takes the actual current profits of the 50 largest stocks – the $930billion from the chart on the prior page – and divides it by our last actual reading for US GDP of $29.6 trillion.
You can see that today; the profits of America’s 50 largest companies are equivalent to 3.1% of US GDP.
Now let’s jump to the last light blue bar on the chart above. That shows what would happen if the 50 largest companies grew their profits at 14% a year for a decade while US GDP expanded at a very optimistic 6% a year.
You can see that on those trajectories the profits of our 50 largest companies would sum to 6.6% of GDP. Seen in a pleasant chart like this, the concept hardly seems unreasonable right?
WRONG.
The chart below shows the percent of US GDP the 50 largest stocks in America have been able to book as profits going back to 1964. What do we see? At current levels, the profitability of the 50 largest US companies is just off an all-time record at 3.1%. The dashed red-line shows what those assumptions look like in historical context. For the sake of humanity, we had better hope this does not happen.
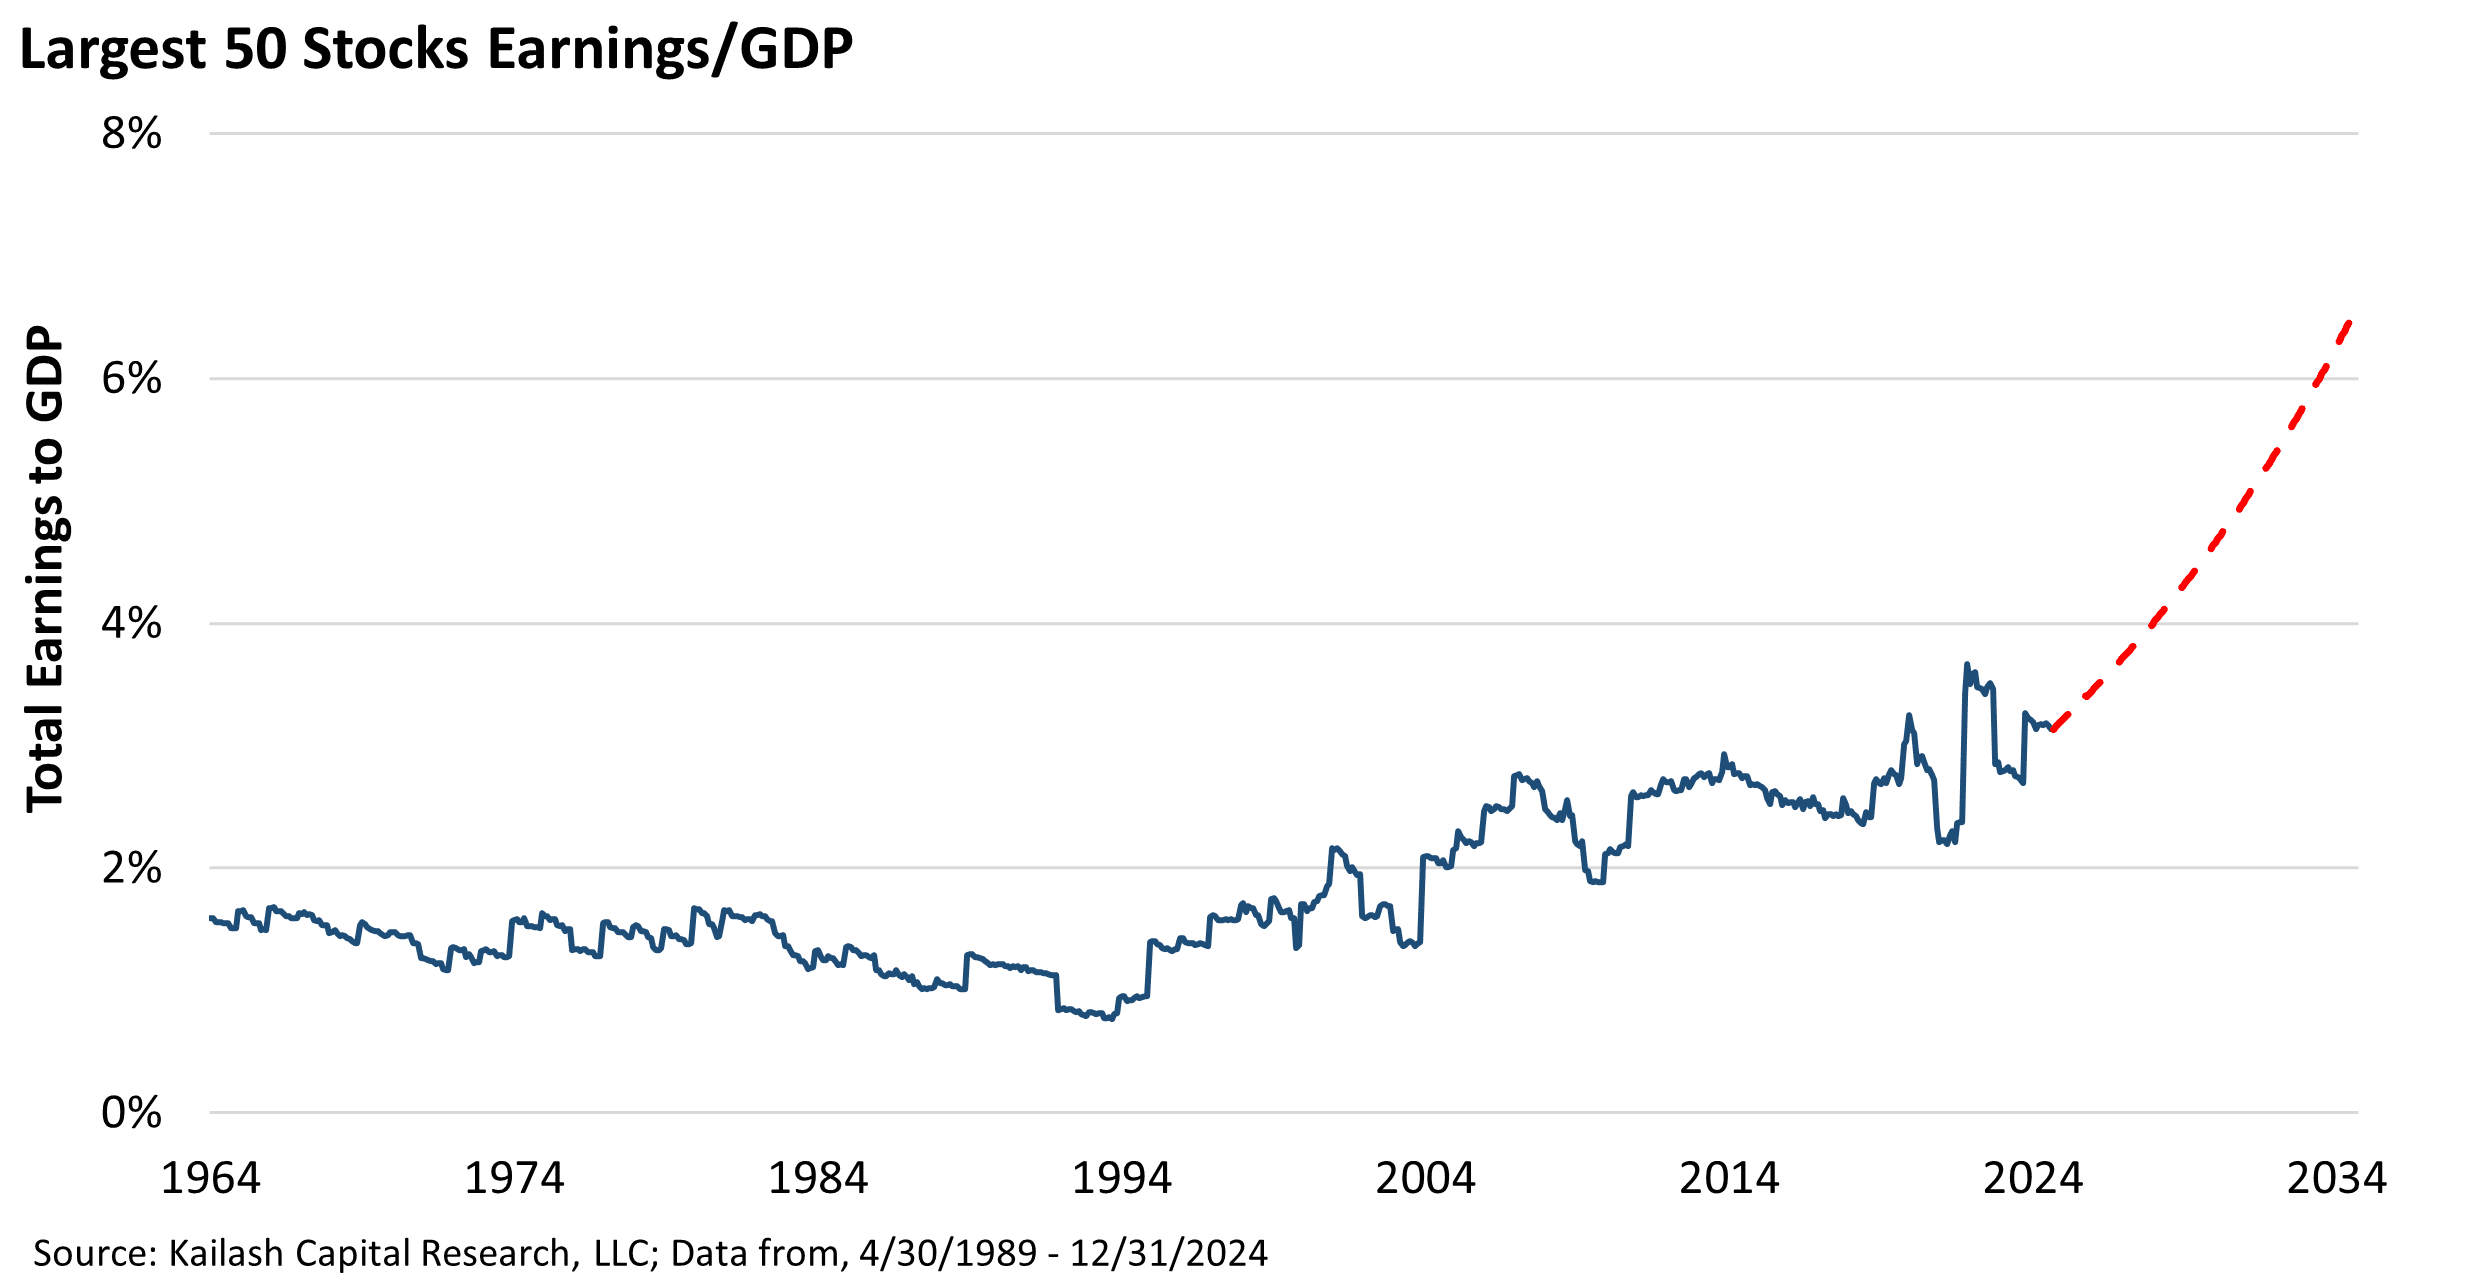
In our piece Economic Cycles & Mean Reversion we quoted heavily from Buffett’s explanation of why stock market valuations must be tethered to GDP and the real economy. In a rare moment where he indulged in forecasting, Buffett observed that “…you have to be wildly optimistic to believe that corporate profits as a percentage of GDP can, for any sustained period, hold much above 6%.” You can see we are well above that.
Buffett would go on to explain that the reason you would need to be wildly optimistic that margins could stay over 6% stemmed from the following primary forces:
- Competition: in a healthy competitive marketplace, abnormally high profit levels come under crushing pressure for new entrants or existing peers
- Public Policy: Buffett observed that if margins were to rise above 6% for any material period of time it would mean investors were eating an “…ever growing portion of the American economic pie…” requiring others to take less than they had in the past
- Should Abnormal Profits Happen for a Protracted Period: Buffett warned that if America morphed into an economy where profits were sustainably above 6% that this “…would justifiably raise political problems….”
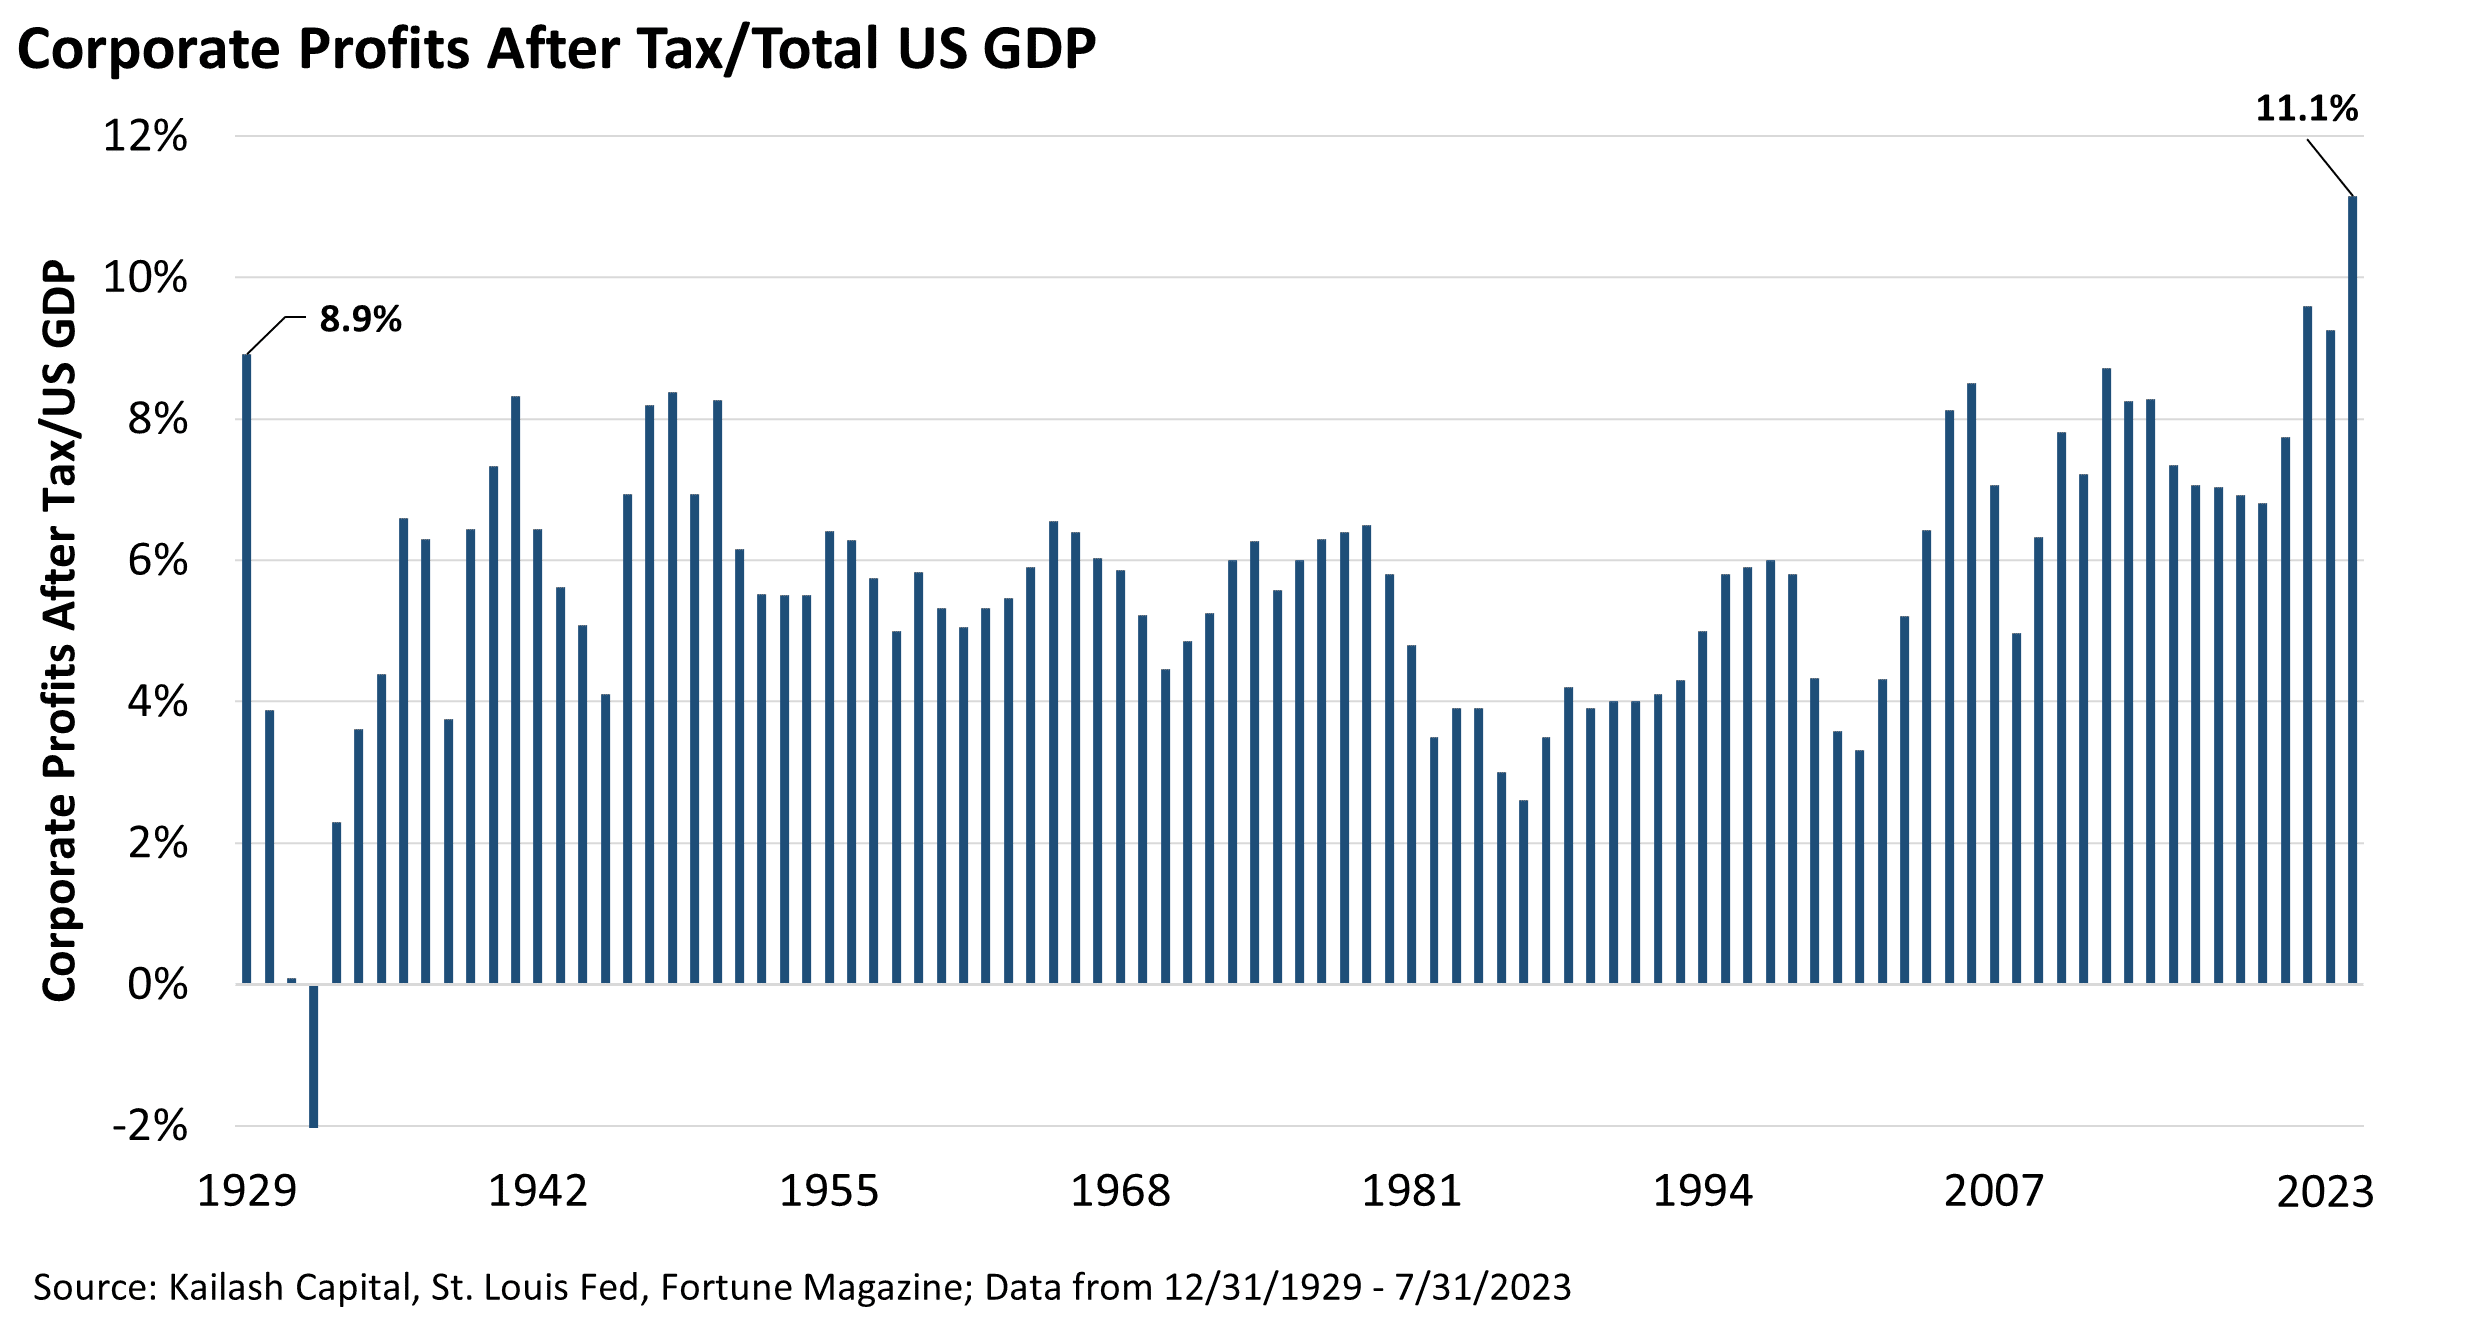
So, Buffett was wrong. Profits have held above the 6% mark ever since the GFC. Yet the KCR team would suggest he was very right about the costs.
We wrote it in 2022, and we’ll write it again here:
We believe that today is not different. There is precedent for this moment in history. The social cost of margins holding at 1929 levels seems high. Yet investors, holding equities at valuations last seen at the peak of the dot.com bubble, appear to be projecting into the future what they just saw “as that is their unshakeable habit.”
In our view, the most compelling evidence of this can be found in John Maynard Keynes’ legendary book The Economic Consequences of the Peace. See if the below resonates with you. If it does, we suggest you click through to our 10-year forward estimates calculator.
The inhabitant of London could order by telephone, sipping his morning tea in bed, the various products of the whole earth, in such quantity as he might see fit, and reasonably expect their early delivery upon his doorstep….But, most important of all, he regarded this state of affairs as normal, certain, and permanent, except in the direction of further improvement, and any deviation from it as aberrant, scandalous, and avoidable. The projects and politics of militarism and imperialism, of racial and cultural rivalries, of monopolies, restrictions, and exclusion, which were to play the serpent to this paradise, were little more than the amusements of his daily newspaper, and appeared to exercise almost no influence at all on the ordinary course of social and economic life, the internationalization of which was nearly complete in practice. –Keynes, 1919
Does it not sound like he is talking about Amazon Prime and today’s news headlines in general?
Please find below our most recent Top Ranked Midcap stocks.


Disclaimer
The information, data, analyses, and opinions presented herein (a) do not constitute investment advice, (b) are provided solely for informational purposes and therefore are not, individually or collectively, an offer to buy or sell a security, (c) are not warranted to be correct, complete or accurate, and (d) are subject to change without notice. Kailash Capital Research, LLC and its affiliates (collectively, “KCR”) shall not be responsible for any trading decisions, damages, or other losses resulting from, or related to, the information, data, analyses or opinions or their use. The information herein may not be reproduced or retransmitted in any manner without the prior written consent of KCR. In preparing the information, data, analyses, and opinions presented herein, KCR has obtained data, statistics, and information from sources it believes to be reliable. KCR, however, does not perform an audit or seek independent verification of any of the data, statistics, and information it receives. KCR and its affiliates do not provide tax, legal, or accounting advice. This material has been prepared for informational purposes only and is not intended to provide, and should not be relied on for tax, legal, or accounting advice. You should consult your tax, legal, and accounting advisors before engaging in any transaction.
Nothing herein shall limit or restrict the right of affiliates of KCR to perform investment management or advisory services for any other persons or entities. Furthermore, nothing herein shall limit or restrict affiliates of KCR from buying, selling, or trading securities or other investments for their own accounts or for the accounts of their clients. Affiliates of KCR may at any time have, acquire, increase, decrease, or dispose of the securities or other investments referenced in this publication. KCR shall have no obligation to recommend securities or investments in this publication as a result of its affiliates’ investment activities for their own accounts or for the accounts of their clients.
© 2023 Kailash Capital Research, LLC – All rights reserved.
February 7, 2025 |
| Authors: Matthew Malgari, Nathan Przybylo, Dr. Sanjeev Bhojraj and John Durkin
February 7, 2025
Authors: Matthew Malgari, Nathan Przybylo, Dr. Sanjeev Bhojraj and John Durkin