“Late Capitalism” [has] two paradigms [that] combine to swamp the efficient, free-market allocation of capital:
- Crony capitalism and corruption…choke[s] out the rule of law and reduce the extent to which markets are “free.”
- The transformation of markets from capital-allocation machines to casinos in which finance becomes just another form of gambling.
Get our insights direct to your inbox: SUBSCRIBE
Reasonable people can argue how far down the path we are… but I do not believe anyone would claim that we weren’t on the road.
In our view, the “nihilistic bullishness” we referenced in a prior piece, has now merged with more classical euphoric speculation. More colloquially: “if you can’t beat the grifters, join em!”
Retail investors, emboldened by falling interest rates and the siren song of AI, have rushed into stocks with astonishing speed. In July alone, they bought over $10 billion in equities — reversing a yearlong selling trend. [1] By early October, weekly purchases surged another 40%, reaching $7 billion per week — the fastest pace since the meme-stock boom in 2020-2021. [2] Total retail trading volume now sits at a record $6.6 trillion for the first half of 2025. [3] It’s as if every investor suddenly became their own hedge fund, chasing volatility like it’s a form of entertainment.
Much of this enthusiasm has detached from fundamentals. Citigroup’s retail favorites index — heavy with SoFi, Riot Platforms, and Meta — has jumped 30% since September, dwarfing the S&P 500’s modest 4% gain. [4] Meanwhile, speculative behavior is spreading: AI-related stocks such as AMD have notched 40% single-day surges on mere partnership announcements. [5] Retail investors have even turned to smaller, riskier “AI-adjacent” names like CoreWeave and Opendoor — trades driven by momentum, not earnings. JPMorgan’s analysts note that the market’s “FOMO and MOMO” cycle — fear of missing out and momentum chasing — has replaced valuation discipline. [6], [7]
At the same time, institutional caution and concentration risk deepen the sense of imbalance. According to Morgan Stanley, the “Magnificent 7” tech giants produced 26% earnings growth last quarter versus just 1% for the rest of the S&P 500, even as capital spending became dangerously concentrated in a few hyperscalers. [8] American households now have 45% of their financial assets in equities, surpassing the late-1990s peak before the dot-com crash. [9] Economists call that a “bright red flag.” Together, these data points paint a portrait of speculative excess — a market not merely climbing a wall of worry, but leaping from it with blind confidence, convinced that every dip is just another trampoline.
So, what is the clearest expression of this retail frenzy? Is it truly a sudden retail affinity for investing in solid companies with reasonable valuations with shareholder friendly policies? No. Instead, it is rank speculation in the small-cap world where we see this behavior having some of the largest impact.
Now on to the overwhelming and very simple evidence.
The first chart shows that low-quality stocks, defined as the bottom quintile of ROE, in the Russell 2000 family have significantly outperformed their indexes over the past year. Specifically:
- Russell 2000 Growth: Low-quality stocks gained 31.2%, more than double the index’s 13.6% return.
- Russell 2000 Core: Low-quality stocks rose 29.7%, versus 10.8% for the index.
- Russell 2000 Value: Low-quality firms returned 20.1%, compared to 7.9% for the index

Over the long term, low-quality small-cap stocks have underperformed their benchmarks across every style category. From 1989 through today, lower-quality firms lagged meaningfully in the Russell 2000 Growth, Core, and Value indexes. This pattern highlights that while low-quality rallies can sparkle in the short run, quality compounds better over time.

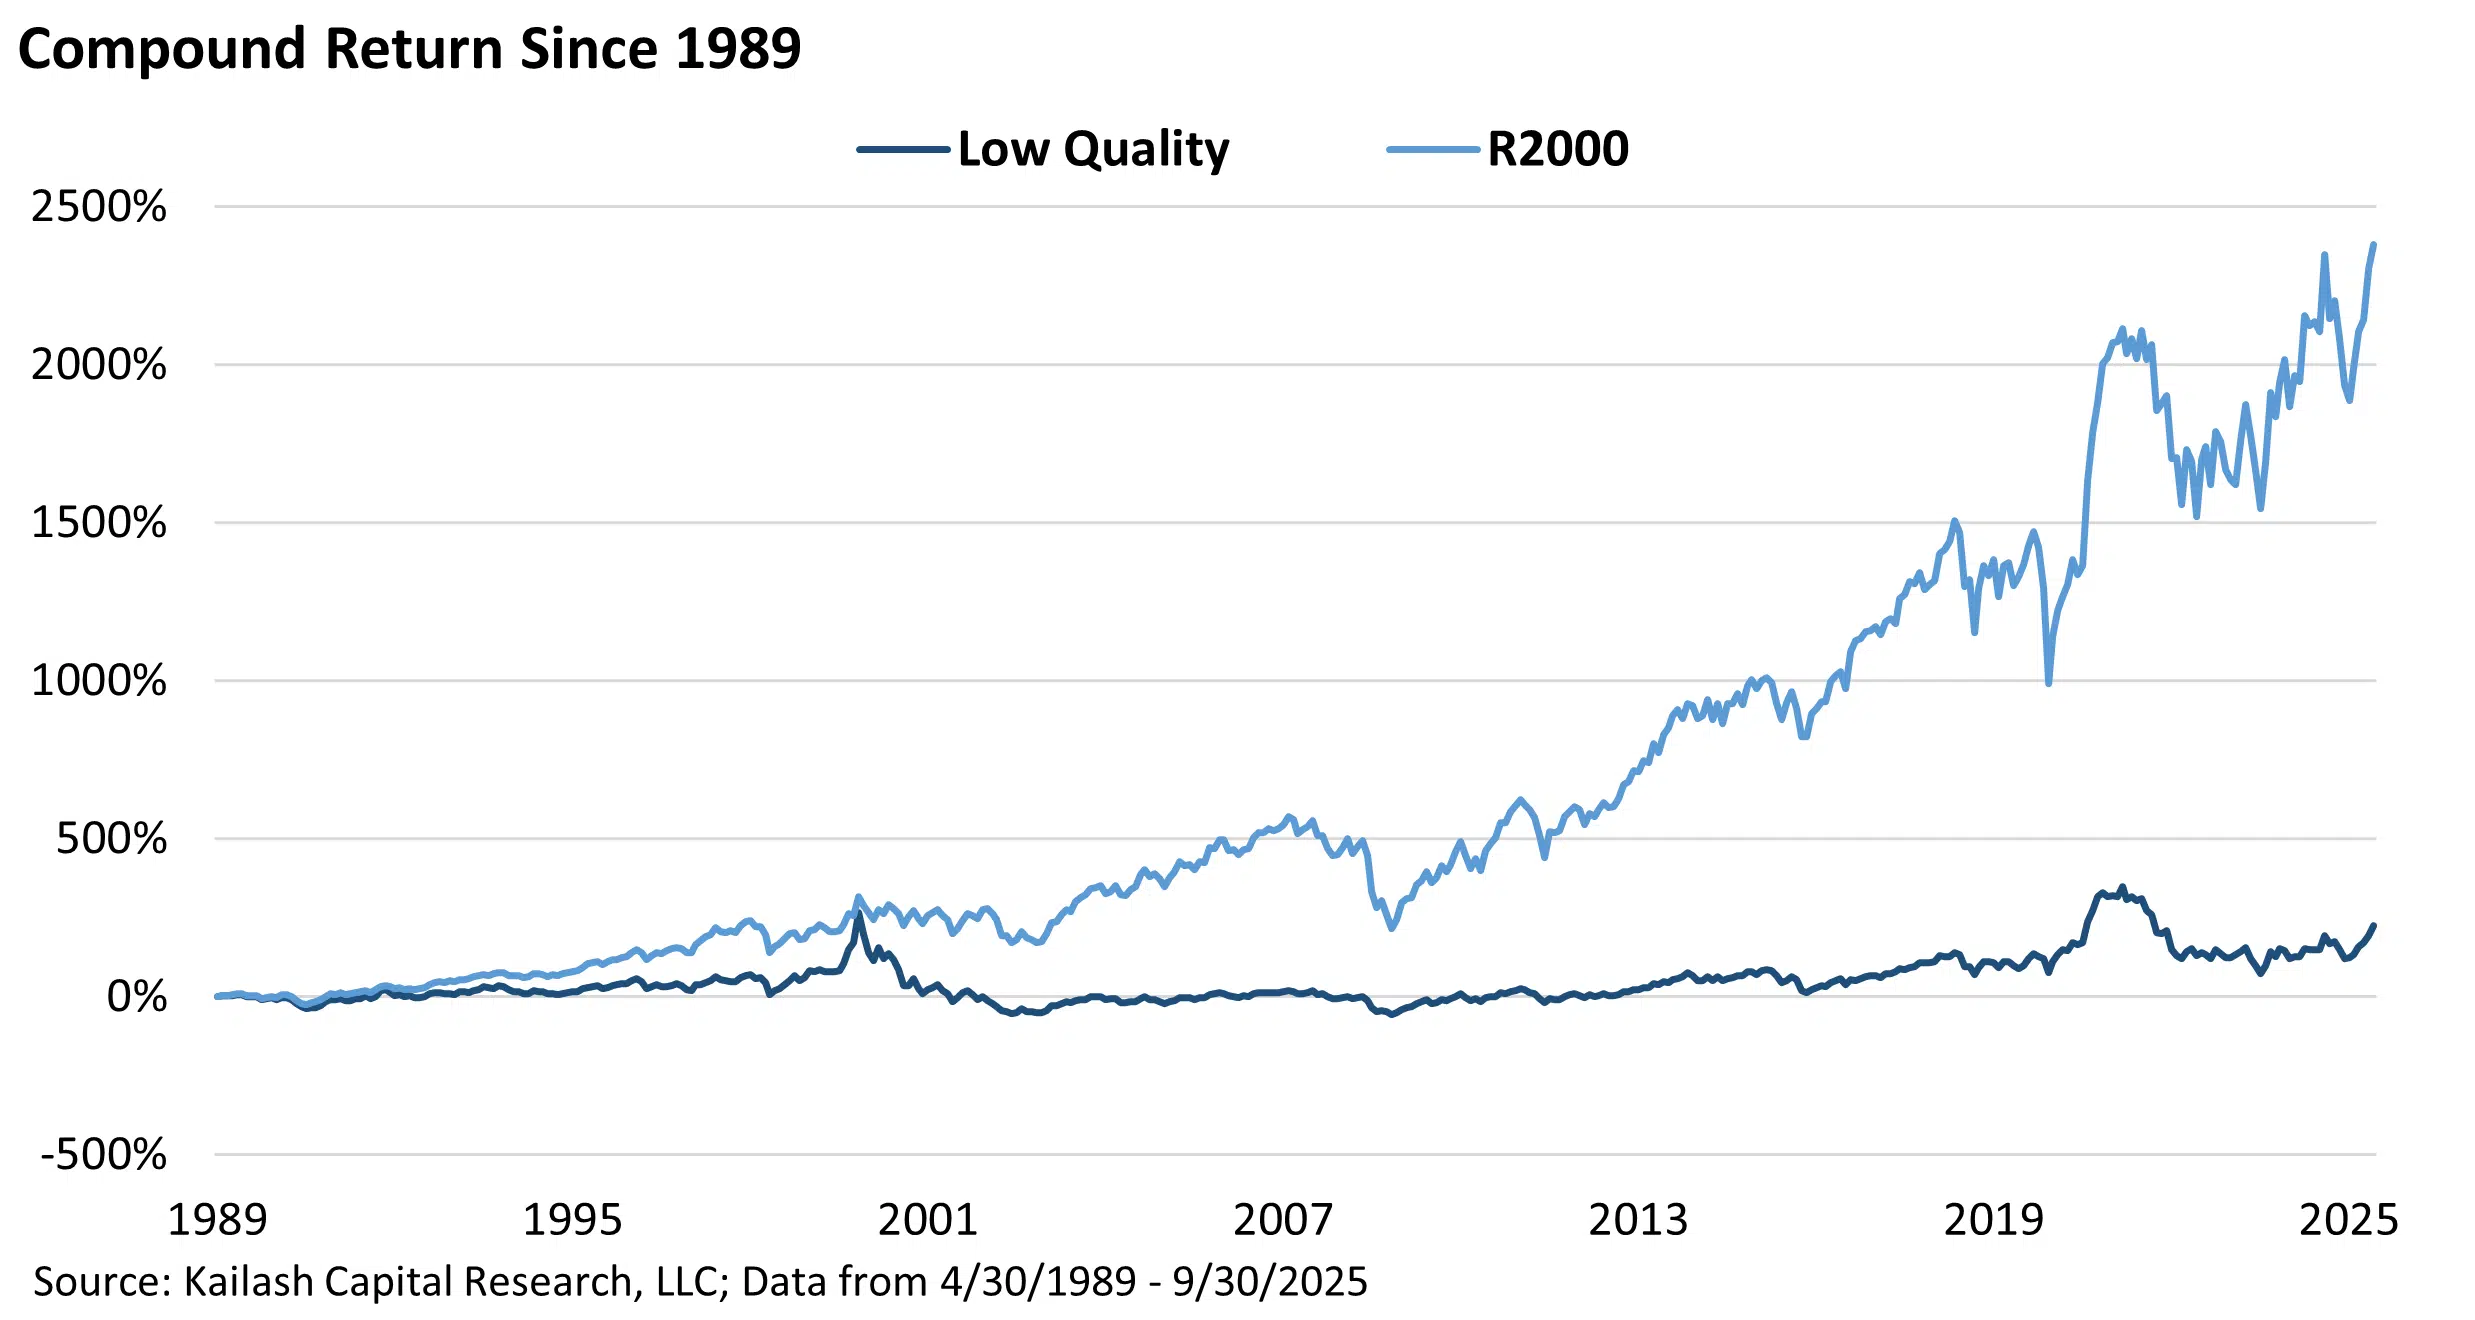
Since 1989, low-quality small-cap stocks have badly lagged the Russell 2000 Index’s total return. While the index compounded to over 2,000%, low-quality stocks barely grew, often treading water through multiple cycles. The chart reveals that chasing weak firms may deliver excitement, but not enduring wealth.
- The Russell 2000 Index surged roughly 20-fold since 1989, while low-quality stocks stayed near zero.
- Every major rally shows the index rising sharply while low-quality stocks flatten.
- Periods of brief “junk” rallies fade, leaving long-term investors with little compounding.
- The visual gap widens over time — a slow burn of underperformance.
- It’s a reminder that durability beats drama in small-cap investing.
We find substantially identical findings in the Russell 2000 Growth and Value Indexes respectively. Looking at the chart on the left – the Russell 2000 Growth Index vs. the low-quality stocks in the R2G – the impact is extraordinary. When investing in small cap growth, quality is a powerful sorting feature. Over ~35 years, low quality small cap growth stocks have compounded to nearly zero while the index rose 16x! While optically less pronounced in Small Cap Value, the spread between quality and low-quality is actually larger (chart on the right).

Conclusion:
Page 1: Speculators are driving financial markets via speculative betting consistent with late-stage capitalism
Page 2: Over the last 12 months low quality stocks have trounced the core benchmarks across all style boxes
Page 3: Over the long-run, high quality stocks compound at vastly higher rates than low quality
This paper has highlighted the performance of junk vs. the salient benchmarks. But the impact on disciplined investors who understand basic investing principles has been utterly devastating. Why?
The vast majority of existing active investment managers we know understand the simple concepts laid out above. As a result, they tend to have what factor models call a “quality loading” – meaning they tend to avoid the loss-making junk that has been ripping over the last year. While a simple and empirically sound decision, active managers who follow the evidence have paid a brutal price.
How costly? In the bars below we take the trailing 12 month returns of high-quality stocks – the quintile with the highest Returns On Equity (ROE) and subtract the returns from the low-quality stocks discussed above. The results have been devastating. As you can see below:
- Russell 2000 Growth: high quality stocks have underperformed low quality by -17.4%
- Russell 2000 Core: high quality stocks have underperformed low quality by -21.0%
- Russell 2000 Value: high quality stocks have underperformed low quality by -18.1%

The penalty for simply avoiding low-quality garbage has been absolutely brutal. Take all the narrative and noise away and just ask yourself: would I rather own a low-quality firm and hope something good happens or would I rather own a solid firm and hope it keeps doing what it is doing?
Not complicated. The data on the following page lays this out in blinding fashion….
The table below shows the basic fundamental features and valuations of High ROE (high quality – the stuff that has been losing), the benchmark, and Low ROE (low quality – the stuff that has been winning) in that order for each of the three style benchmarks.
For example, the top three rows show data that compares high quality stocks in the Russell 2000 Growth benchmark (top row) to the benchmark (middle row) and then shows the low quality (Low ROE) stocks in the Russell 2000 Growth benchmark. Look at the dispersion between them. We would not encourage anyone to do this, but we would strongly suggest a long-term growth investor could beat the benchmark handily by simply buying the 20% of the benchmark that makes up the high-quality top row in the exhibit.

The exercise is repeated in each subsequent block. The finding is as universal as it is simple: no matter which style box you are in, the spreads between high-quality, the benchmarks and low-quality is enormous.
We strongly encourage Financial Advisors to ignore the noise and just focus on the high-quality stocks vs. the benchmarks. What do you see? The benchmarks are drowning in garbage.
What you can do: Find a cost efficient and disciplined active manager and start diversifying away from index funds and speculative vehicles. We would guess you will have a lot more happy clients five years from now.
For our institutional readers we have provided the table below. The top row shows the fundamentals of our top ranked stocks that are also in the top quintile of quality within the Russell 2000 and compare them with the top quintile of quality and the benchmark.
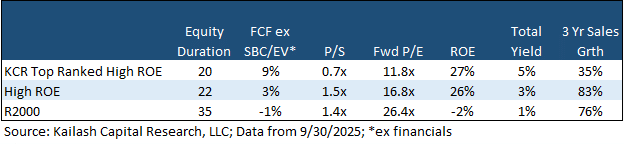
As we have been saying since 2023: what you should do has never been so obvious but difficult to do.
The exhibit below shows the stocks that make up that top-row. We wish you happy hunting!


Disclaimer
The information, data, analyses, and opinions presented herein (a) do not constitute investment advice, (b) are provided solely for informational purposes and therefore are not, individually or collectively, an offer to buy or sell a security, (c) are not warranted to be correct, complete or accurate, and (d) are subject to change without notice. Kailash Capital Research, LLC and its affiliates (collectively, “KCR”) shall not be responsible for any trading decisions, damages, or other losses resulting from, or related to, the information, data, analyses or opinions or their use. The information herein may not be reproduced or retransmitted in any manner without the prior written consent of KCR. In preparing the information, data, analyses, and opinions presented herein, KCR has obtained data, statistics, and information from sources it believes to be reliable. KCR, however, does not perform an audit or seek independent verification of any of the data, statistics, and information it receives. KCR and its affiliates do not provide tax, legal, or accounting advice. This material has been prepared for informational purposes only and is not intended to provide, and should not be relied on for tax, legal, or accounting advice. You should consult your tax, legal, and accounting advisors before engaging in any transaction.
Nothing herein shall limit or restrict the right of affiliates of KCR to perform investment management or advisory services for any other persons or entities. Furthermore, nothing herein shall limit or restrict affiliates of KCR from buying, selling, or trading securities or other investments for their own accounts or for the accounts of their clients. Affiliates of KCR may at any time have, acquire, increase, decrease, or dispose of the securities or other investments referenced in this publication. KCR shall have no obligation to recommend securities or investments in this publication as a result of its affiliates’ investment activities for their own accounts or for the accounts of their clients.
© 2025 Kailash Capital Research, LLC – All rights reserved.
October 17, 2025 |
| Authors: Matthew Malgari, Nathan Przybylo, Dr. Sanjeev Bhojraj and John Durkin
October 17, 2025
Authors: Matthew Malgari, Nathan Przybylo, Dr. Sanjeev Bhojraj and John Durkin