Every year since the launch of our website, we have posted a piece reviewing KCR’s work from the prior year. Today’s post continues that tradition and even includes some 2023 publications that are just as compelling today as they were when published. We would like to thank our rapidly growing list of readers for their support, engagement, and thoughtful kindness.
Get our insights direct to your inbox: SUBSCRIBE
KCR has updated all the charts below through December 31, 2024.
The below chart from our June 2023 piece, Mega Cap Stocks: Making Money in Large Cap Growth, shows the Index Weight of the 30 Largest Stocks in the R1000G. You can see the weighting of the 30 largest firms in the Russell 1000 Growth Index are now without historical precedent. When you buy a large cap growth index, nearly 80% of your money is going into just 30 names.
We’ve also modeled out a hypothetical path for our readers to contemplate. The “30 Stock Growth Index” line shows the progression in weights of the top 30 stocks if they outperform the rest of the index by 5% a year for the next six years.
As long time readers know, our sister firm helped design and sub-advises an all-cap index fund and we believe cheap beta plays an important role in portfolio construction. With that said, we have to ask: if ~80% of the index is now in just 30 stocks, is there really any point to having 100s of other stocks in the benchmark?

Honest questions:
- Wouldn’t investors be better off taking 80% of their “growth” money, just buying the 30 stocks in a SMA, and tax loss harvesting along the way?
- Maybe take the other 20% and allocate it to dedicated growth in Mid, Small and Microcaps that are cheaper, faster growing, and have huge room to run?
- We would love to hear your feedback and thoughts on this – please reach out to us here.
From our piece How to Value Tech Companies, we show that IT firms in the S&P500 are at 9x P/S. After a brief correction in 2022, the hype around AI has taken the multiples beyond dot.com, setting a 50 year record.

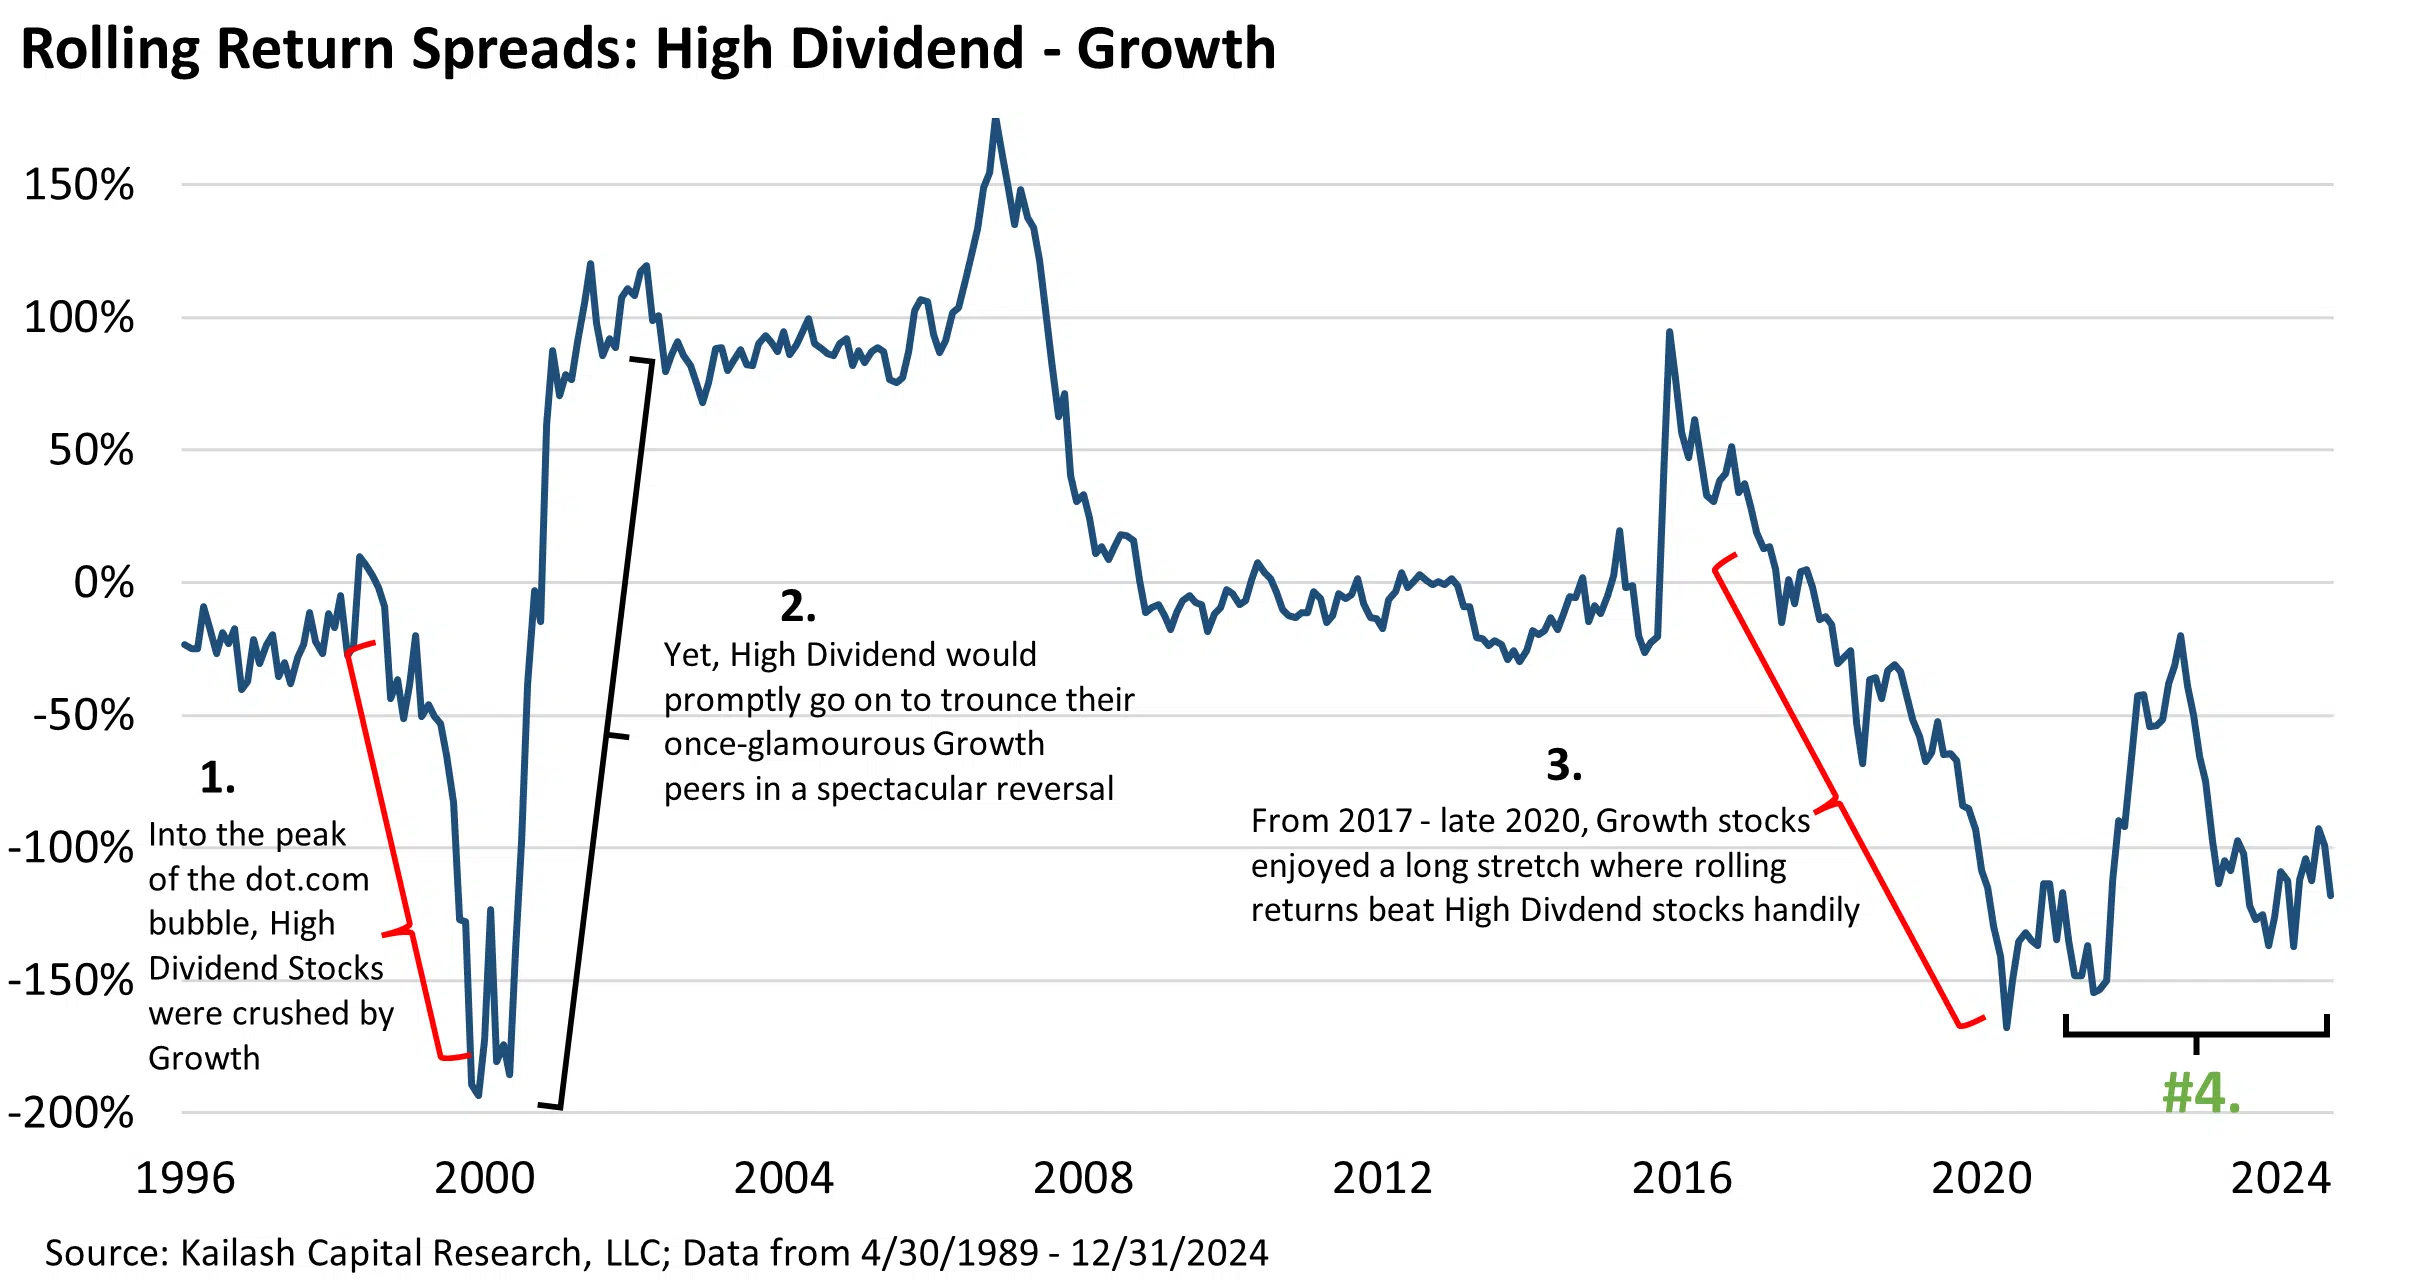
The chart below from our piece, The Great Growth Run & a Peek at Forsaken Dividend Stocks shows that quality dividend stocks have underperformed their high-flying growth peers as badly as they did in the dot.com bubble. Looking at #4 you can see that these blue-chip cash-flowing giants experienced a ripping stretch of outperformance in 2022 before falling behind again as the AI bubble took flight in 2023. We believe the case for quality dividiend payers has rarely looked more compelling than today.
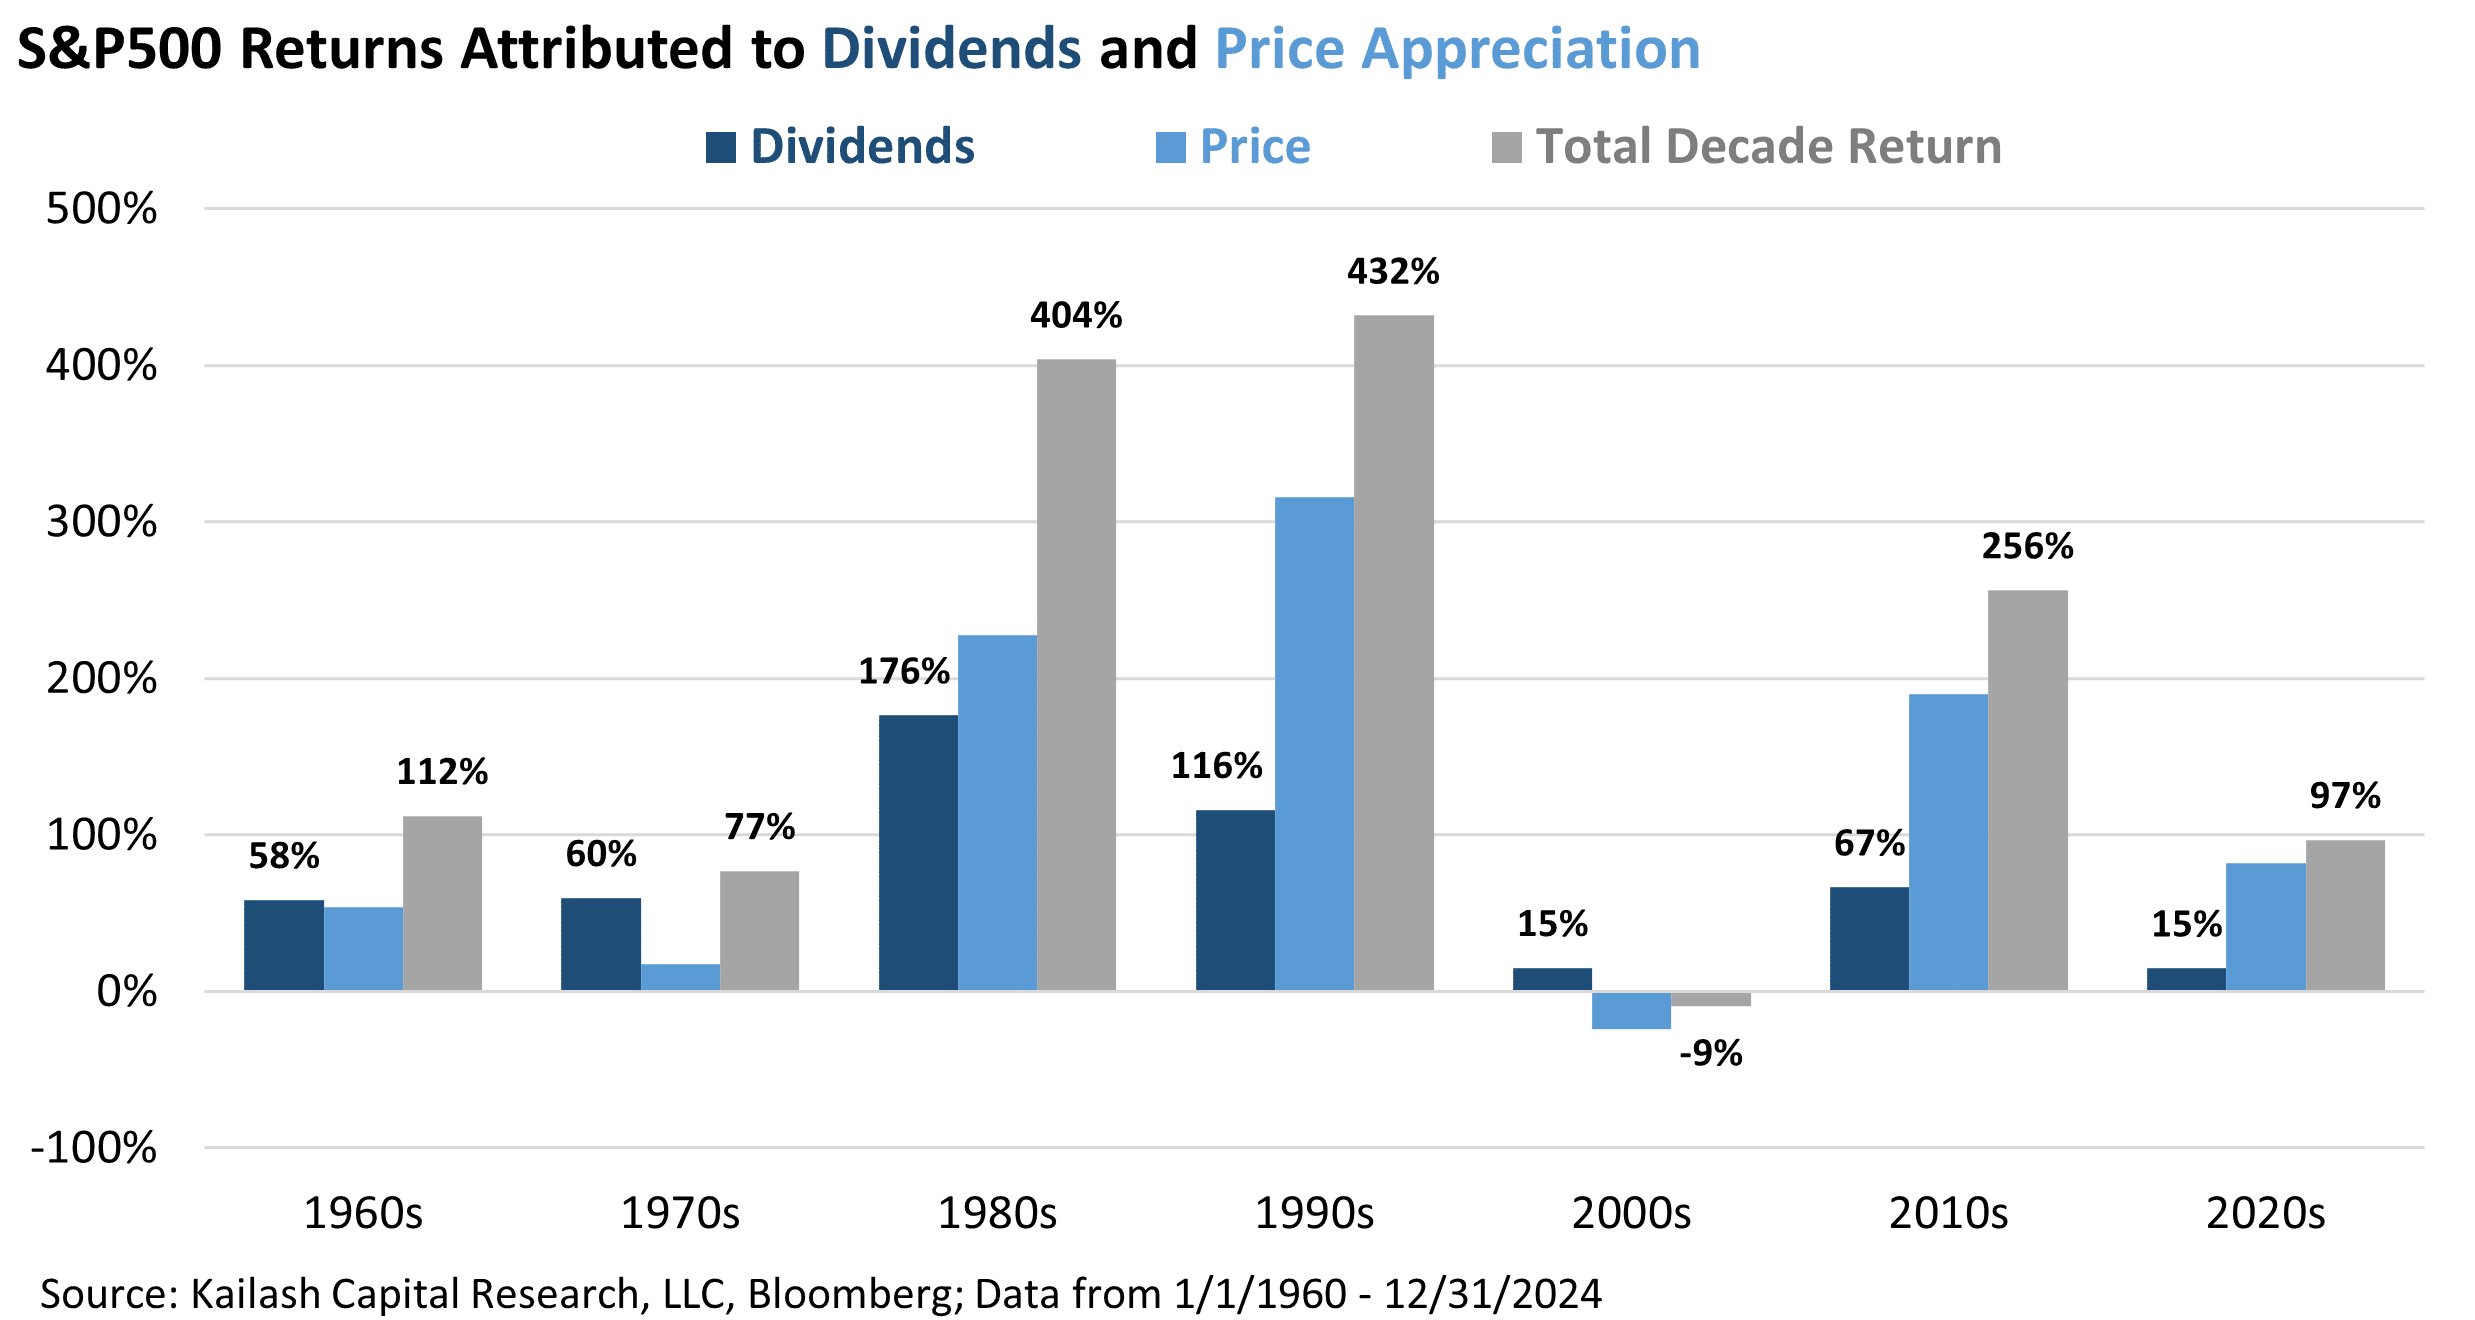
The chart below from our work Diversifying with Dividends shows you the return owners of the S&P 500 achieved by decade, starting in 1960. For each decade, we show the returns attributable to the change in stock prices vs. the returns from dividends. The mechanical benefits of compounding and dollar-cost-averaging via dividends has been critical, particularly during inflations (1970s) and corrections (2000s).
In A Quixotic Crusade for Common Sense, we explained that the core Russell 1000 benchmark had more exposure to expensive growth stocks than at the peak of the dot.com bubble. The chart shows that 26% of an investor’s money in an index fund goes to stocks valued at over 10x price to sales vs. only 19% in Dec 1999.

In Excessive Extrapolation, we showed that the 10 year cumulative issuance of stock-based compensation has exploded since 2014. We ask you to simply take in the magnitude of these payments. From 2004 to 2014 (first bar), employees were given a total sum of $700 billion in stock-based comp—a big number for sure. But in the most recent decade (last bar), the number has exploded to a staggering $1.9 trillion.

In June 2024, we highlighted the unique opportunity in the microcap stocks and re-introduced the KCR Micro Portfolio. The chart below shows the annualized returns of various styles since our Micro Model’s launch in January of 2011. Despite the recent valuation bubble we see in growth stocks, our Micro Model has held its own.

In How High ROIC Firms Could Cause the Next Crisis we presented the below chart. It shows the free cash flow to enterprise value (FCF/EV) of the top quintile, or 20% highest quality companies, in the large cap universe. The lower the number, the more expensive they are. At the depths of the GFC, quality was a “free lunch” trading at an incredible 11% FCF yield. Today, high quality stocks are valued at 2.7%, a post dot.com record.

In Staples Stocks: Could Boring Become Beautiful Once Again?, we made the case for investing in Staples. The line shows the percent of stocks in the S&P 500 that are more expensive than Consumer Staples. Summary: When the line is high, investors are not interested in the boring but reliable returns that Staples are known for. When the line is low, it means investors are fearful and Staples have become very expensive.

The below chart shows the price to sales multiples of every sector at 3 key points in time:
- Light blue Diamonds – 1984: when the equity-crushing headwinds of inflation finally broke
- Navy Blue Squares– December 2022: we chose this date as it was after the market fell -18.13% from the December 2021 high, which had shattered the valuation peak last seen in the dot.com bubble:
- Red Circles-Today: this helps us see where the outliers are and the message is simple – nowhere has there been more multiple expansion than in tech which now trades at 9x sales.

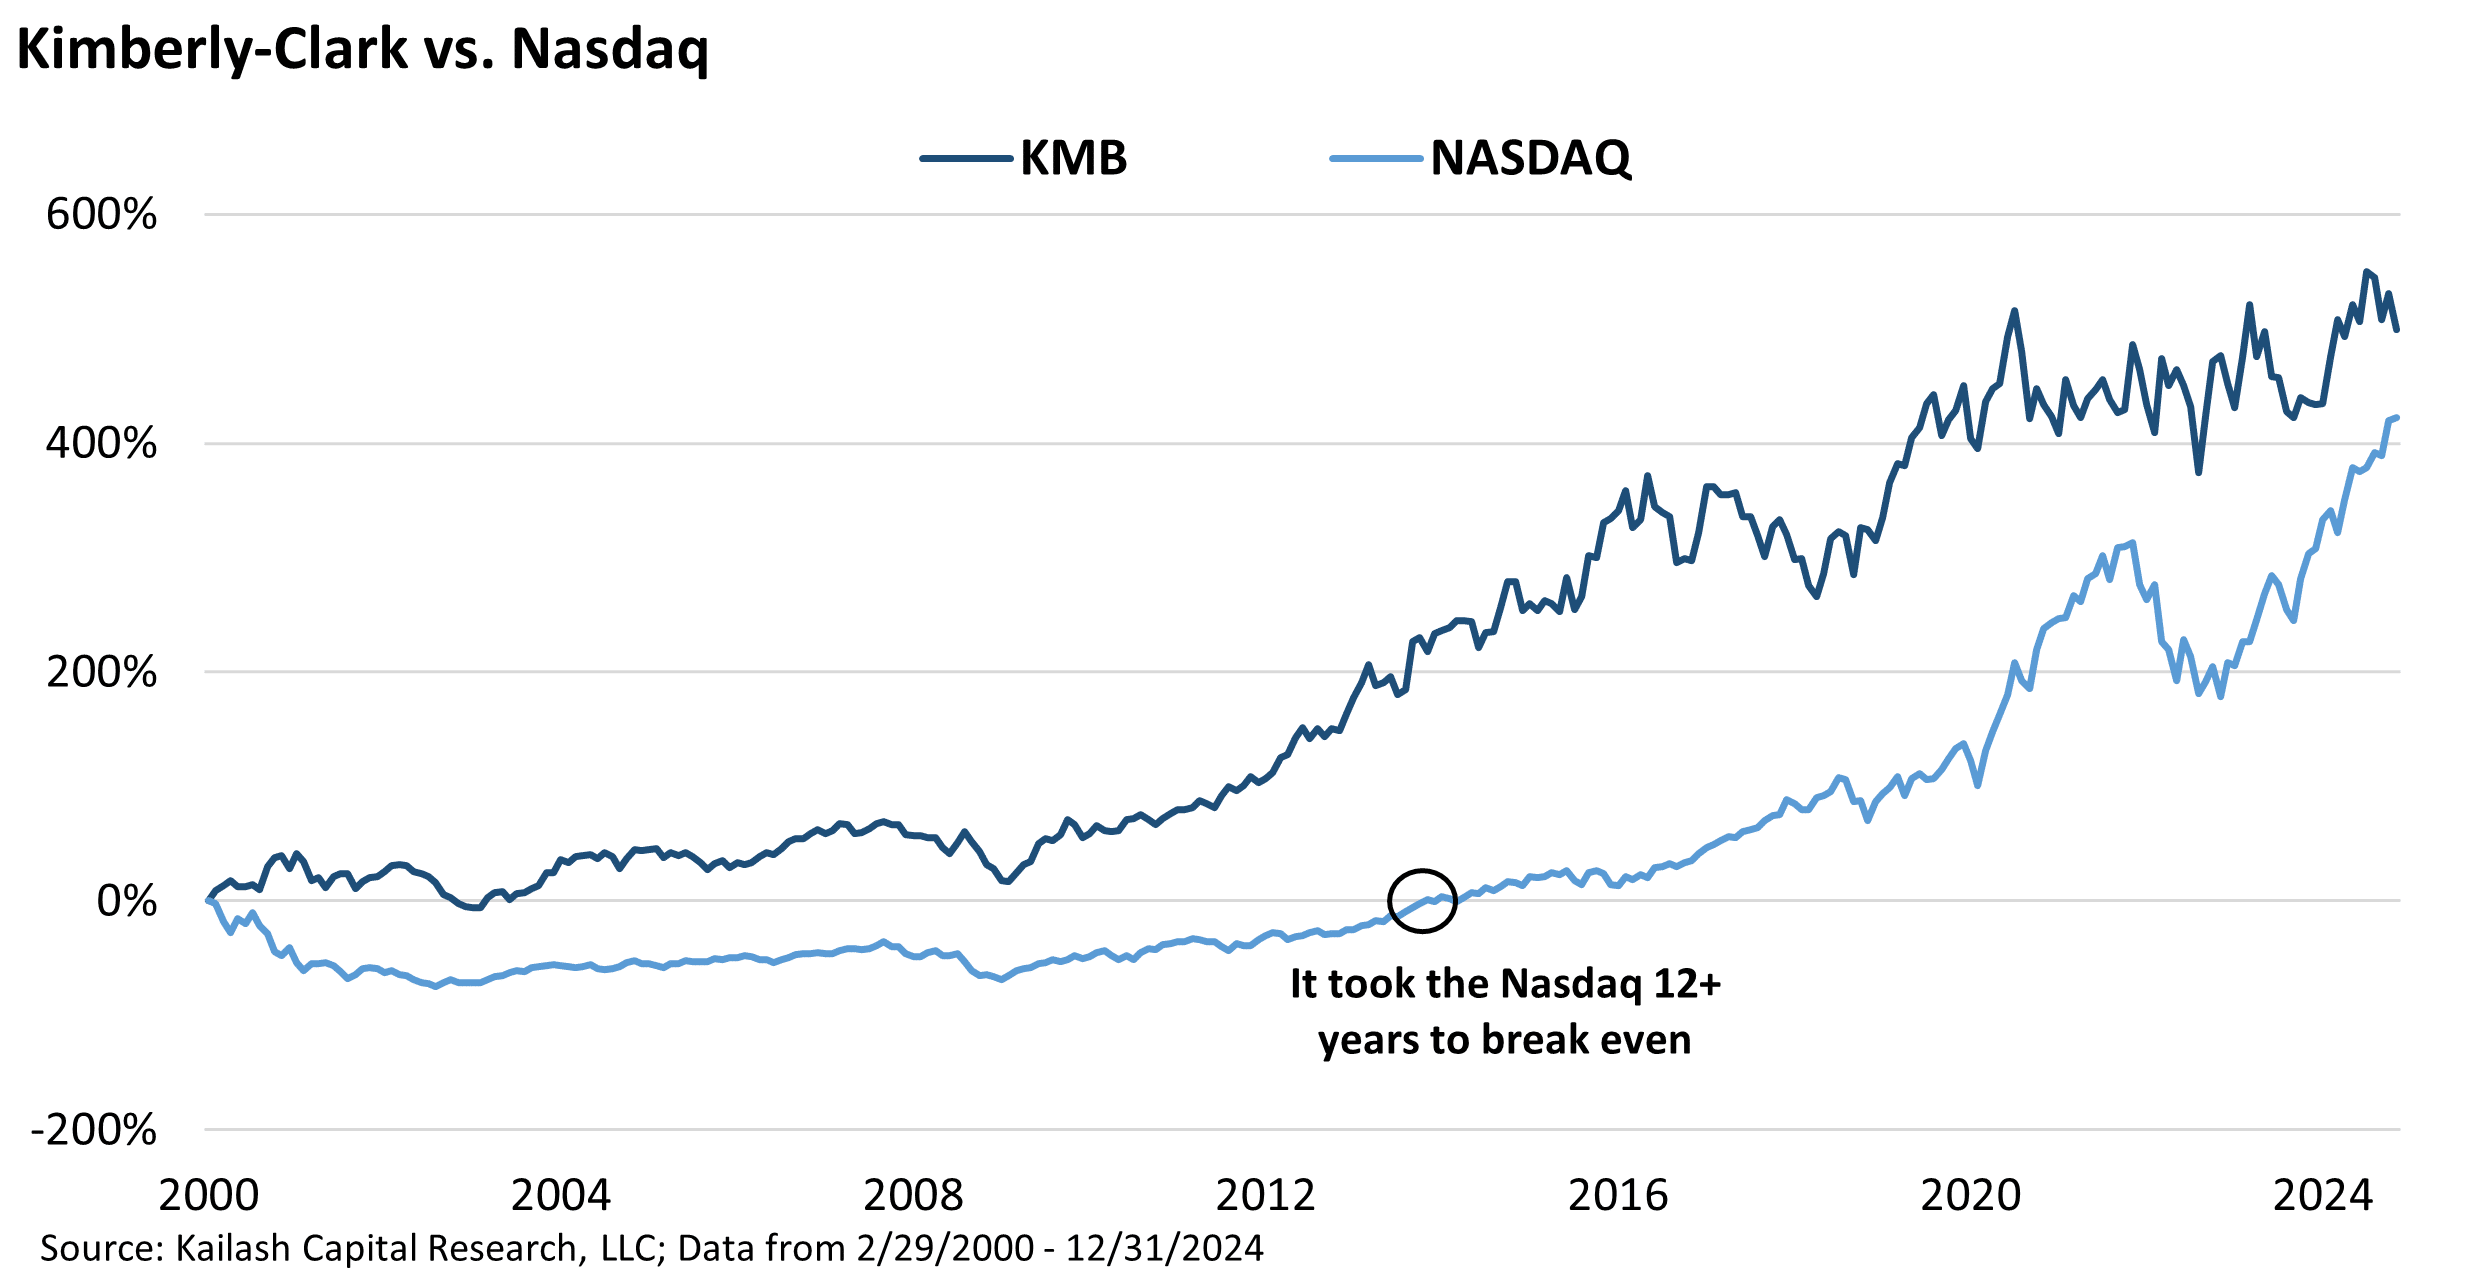
In Dot.com, AI and…Kimberly-Clark we did a deep dive explaining that the data suggests Kimberly-Clark (KMB) offers uncommon value today. The chart below shows that since the peak of the dot.com bubble, the tech rich Nasdaq still has not caught up to the venerable maker of toilet paper. New technologies can change the world. But changing the world does not necessarily make for good investing.
The chart below from The Merits of Midcaps Made Easy shows that an investor in the Russell 1000 Core benchmark has never had less exposure to midcaps as an asset class than today. The last time exposure was this low was at the peak of the dot.com bubble – a date that would set the stage for midcaps to double in value over the next decade while the R1000 was nearly flat. Will it be different this time? The data suggests not.

The chart below is also from our Merits of Midcaps paper. The message is as simple as it is intuitive: midcap stocks have reached a size where they are typically proven and stable yet small enough that they can continue to grow and compound much faster than their large-cap peers. They are the sweet spot of risk and return!

Our most recent piece, Market Cap to GDP & the Importance of Basic Arithmetic, shows the market cap to GDP of just the 50 largest stocks in the US. These 50 names are now valued at 110% of GDP. For context, that is higher than they were in 2021 and just over 400% higher than the trough in the last financial crisis of 2009.

KCR would like to thank our many subscribers again for their interest in our work.
To our readers who are Financial Advisors we think it is prime time to remind clients that life’s bills do not always come at market tops.™
What’s In Your Portfolio?™
In our excitement about the opportunities in Micro Cap, we have also published two deep-dives on a pair of overlooked and unloved companies with potentially potent catalysts to unlock value. You can find both of them on our website.
Disclaimer
The information, data, analyses, and opinions presented herein (a) do not constitute investment advice, (b) are provided solely for informational purposes and therefore are not, individually or collectively, an offer to buy or sell a security, (c) are not warranted to be correct, complete or accurate, and (d) are subject to change without notice. Kailash Capital Research, LLC and its affiliates (collectively, “KCR”) shall not be responsible for any trading decisions, damages, or other losses resulting from, or related to, the information, data, analyses or opinions or their use. The information herein may not be reproduced or retransmitted in any manner without the prior written consent of KCR. In preparing the information, data, analyses, and opinions presented herein, KCR has obtained data, statistics, and information from sources it believes to be reliable. KCR, however, does not perform an audit or seek independent verification of any of the data, statistics, and information it receives. KCR and its affiliates do not provide tax, legal, or accounting advice. This material has been prepared for informational purposes only and is not intended to provide, and should not be relied on for tax, legal, or accounting advice. You should consult your tax, legal, and accounting advisors before engaging in any transaction.
Nothing herein shall limit or restrict the right of affiliates of KCR to perform investment management or advisory services for any other persons or entities. Furthermore, nothing herein shall limit or restrict affiliates of KCR from buying, selling, or trading securities or other investments for their own accounts or for the accounts of their clients. Affiliates of KCR may at any time have, acquire, increase, decrease, or dispose of the securities or other investments referenced in this publication. KCR shall have no obligation to recommend securities or investments in this publication as a result of its affiliates’ investment activities for their own accounts or for the accounts of their clients.
© 2023 Kailash Capital Research, LLC – All rights reserved.
January 31, 2025 |
| Authors: Matthew Malgari, Nathan Przybylo, Dr. Sanjeev Bhojraj and John Durkin
January 31, 2025
Authors: Matthew Malgari, Nathan Przybylo, Dr. Sanjeev Bhojraj and John Durkin