KCR was founded in 2010. A couple money managers looking to do something different. Honest. Unconflicted. Our asset allocation models were clear: high quality US large-cap blue chip stocks had almost never been cheaper relative to developed and emerging markets. US stocks looked like a free lunch to us in 2010. Simple.
Get our insights direct to your inbox: SUBSCRIBE
Turns out being honest, unconflicted and evidence-based sounds great. But it can be a brutal job. Our earliest work emphasized big, mid and even small cap tech. In the early years, stocks like Microsoft, Nvidia, and Broadcom routinely ranked at the top of our large cap and SMID ranking tools. We thought the evidence overwhelming. The logic obvious. Some prospective readers of our research found our conclusions offensive. Microsoft was an ex-growth dump run by a bad CEO. The CEO of Nvidia, Jen-Hsun, was too much of an engineer oblivious to the needs of shareholders. Broadcom was the #1 ranked company, repeatedly, in our SMID ranking tool…and an early client fired us for it as they didn’t like the management.
As this paper explains: things today have ricocheted to the other extreme with high quality US blue chips crowding out virtually all other stocks in major indexes due to bloated valuations.
As oceans of evidence-based research have made clear, markets are inefficient. KCR believes the level of inefficiency is time-varying and can be seen in the data. Much more difficult is sticking to an evidence-based process that exploits these inefficiencies. The evidence suggests today looks much like 1999.
For those more interested in compounding their capital in a safer and more consistent fashion than in the returns of a cap-weighted index, we believe today is as good a time as the peak of the dot.com bubble to find yourself an active manager with an intellectually honest process and partake. Let’s take a look at the data.
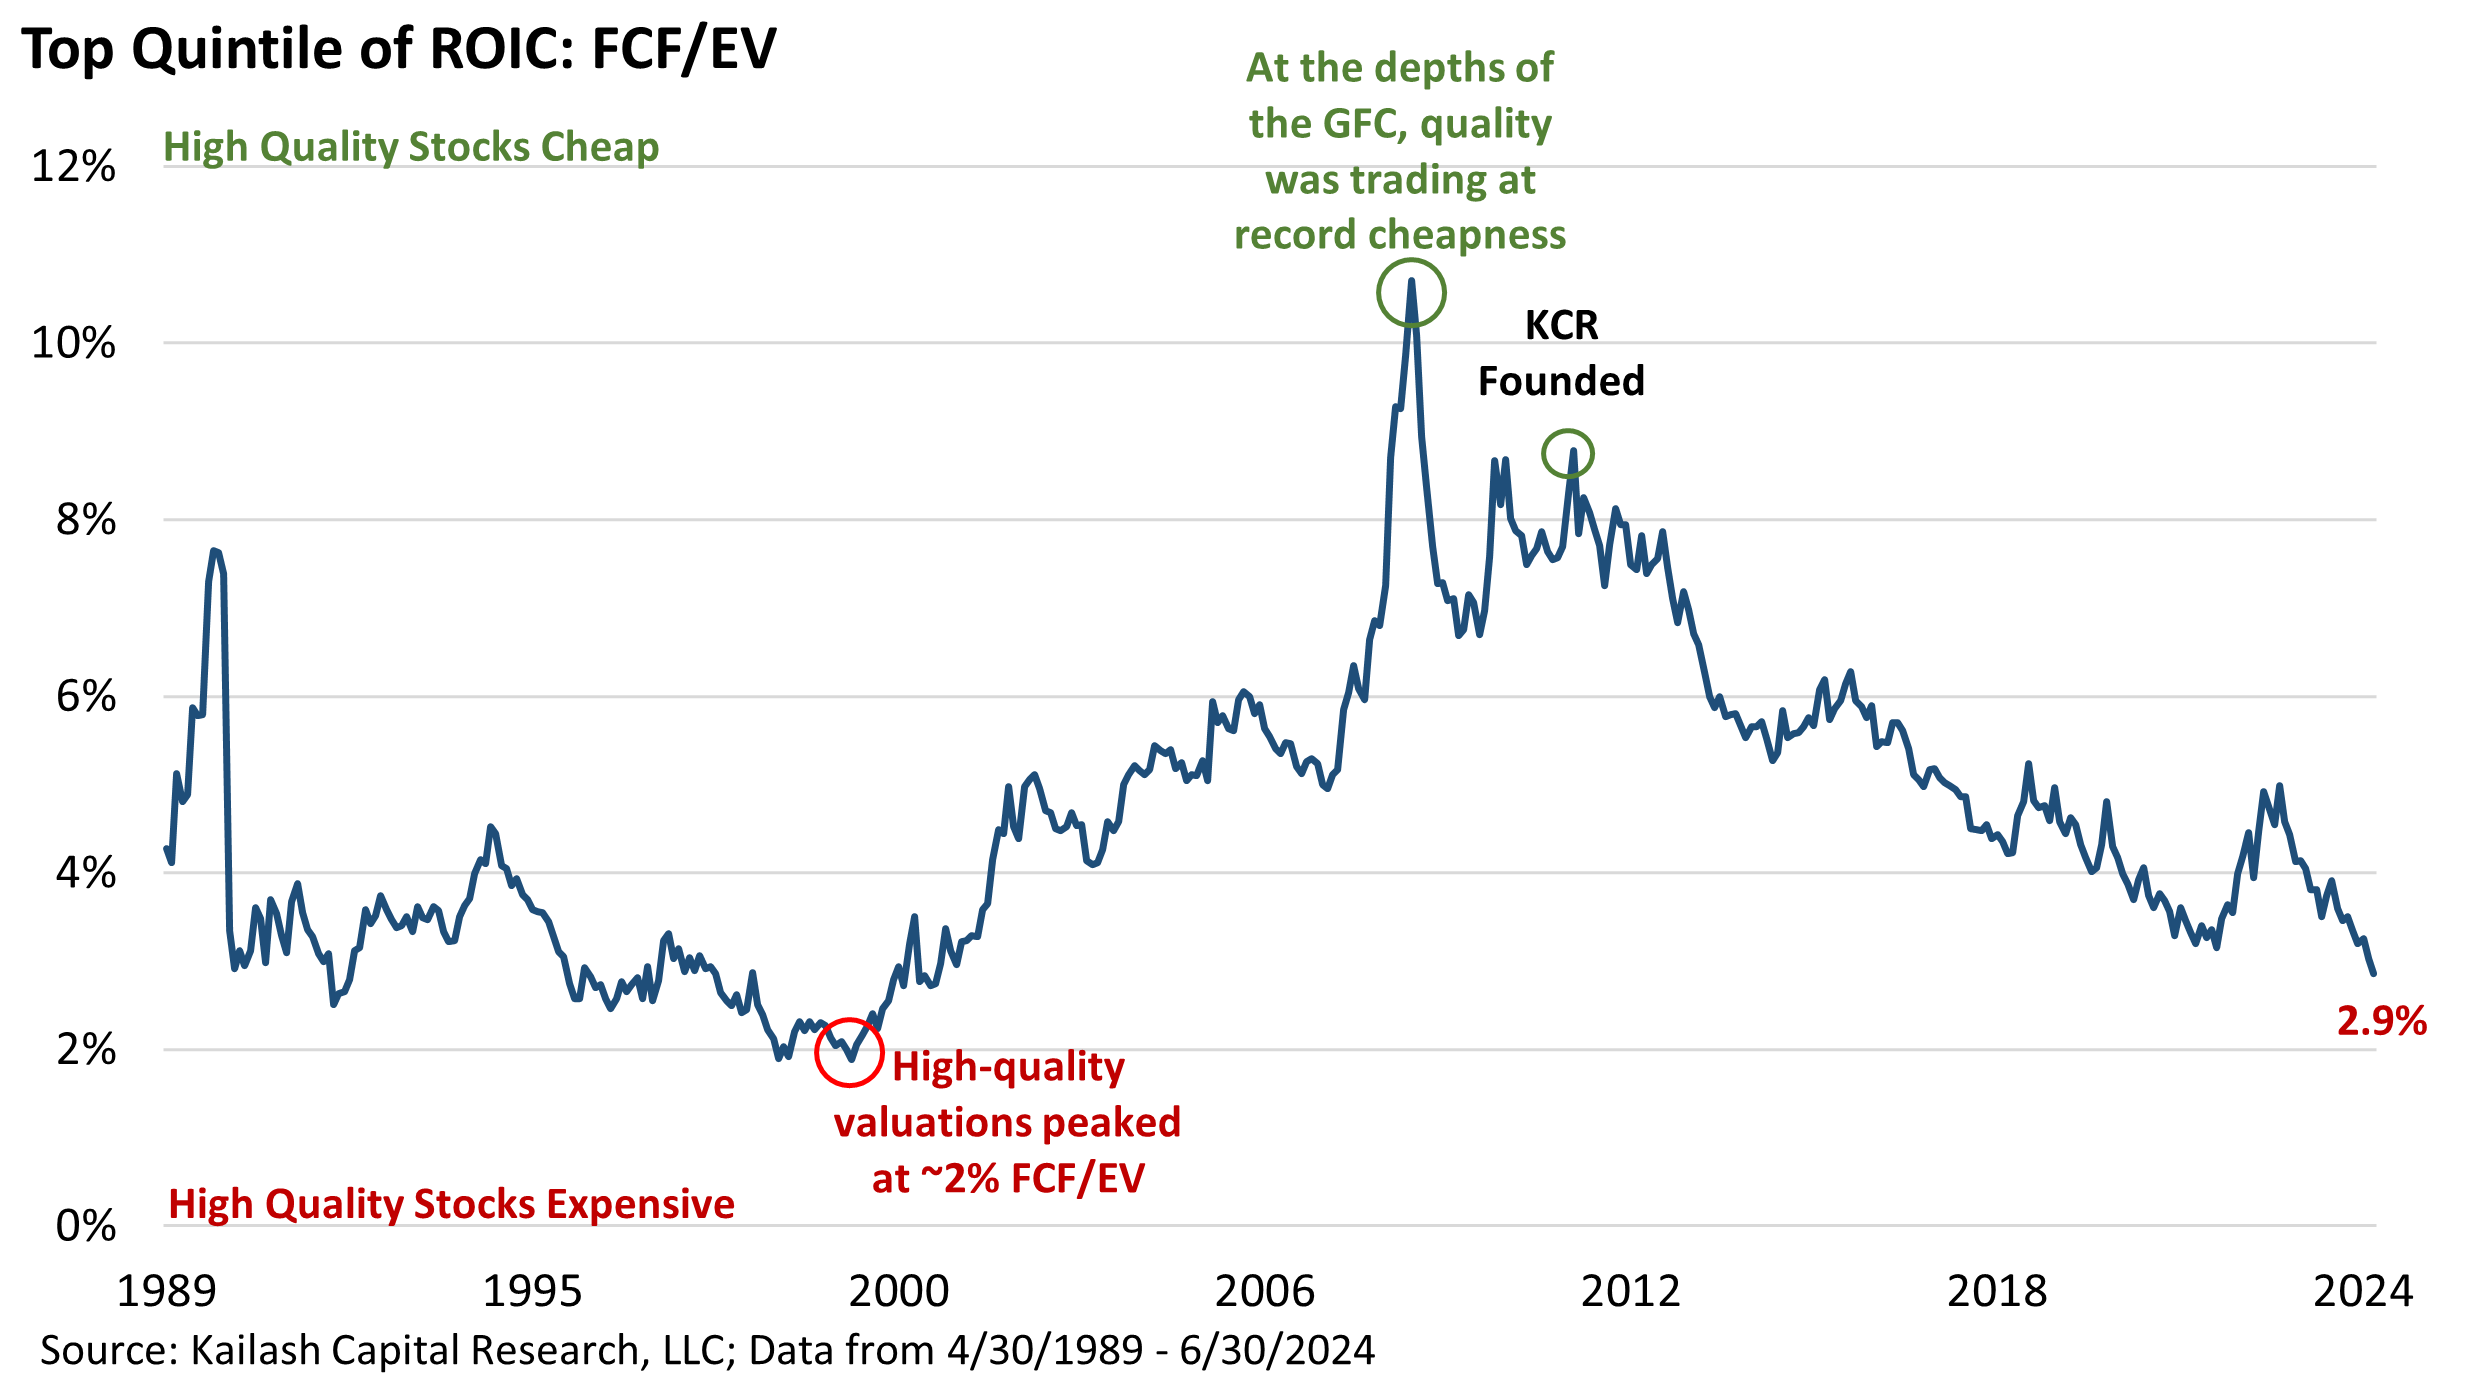
The chart below shows the free cash flow to enterprise value (FCF/EV) of the top quintile, or 20% highest quality companies, in the large cap universe. The lower the number, the more expensive they are. In 1999 these high quality stocks had a FCF yield of only 2%. A record. At the depths of the GFC, quality was a “free lunch” trading at an incredible 11% FCF yield. Today? High quality stocks are valued at 2.9%, a post dot.com record.
We see an identical outcome using price to sales (P/S) below. The only other times high-quality stocks were more expensive was 1999 and 2021. We’d note that after peaking at 5.6x in 1999, the highest quintile of quality stocks spent the next nine years watching their multiples collapse to just 1.3x at the trough of the GFC.

That trough in 2009 was a generational buying opportunity. 1999? Not so much. How about today?
Since we know what you pay matters, this does not auger well for future index fund returns. Here’s why:
We know that the last time high-quality stocks were priced like they are today, they underwent a nine-year period of derating that devastated investors. From 2000 to 2009 index investors lost -32.7%.
Nine years. Compound returns of -4.4% a year. Let that sink in.
The chart below shows the weighting of the top quintile of quality stocks in the Russell 1000 Index. KCR has written extensively about the soaring risks from excessive concentration in core and growth index funds. The chart below is merely another manifestation of this problem.
Today, these high-quality stocks are not just overvalued, but represent a staggering 43% of the index weight – a number higher than the 30% peak of the dot.com bubble.
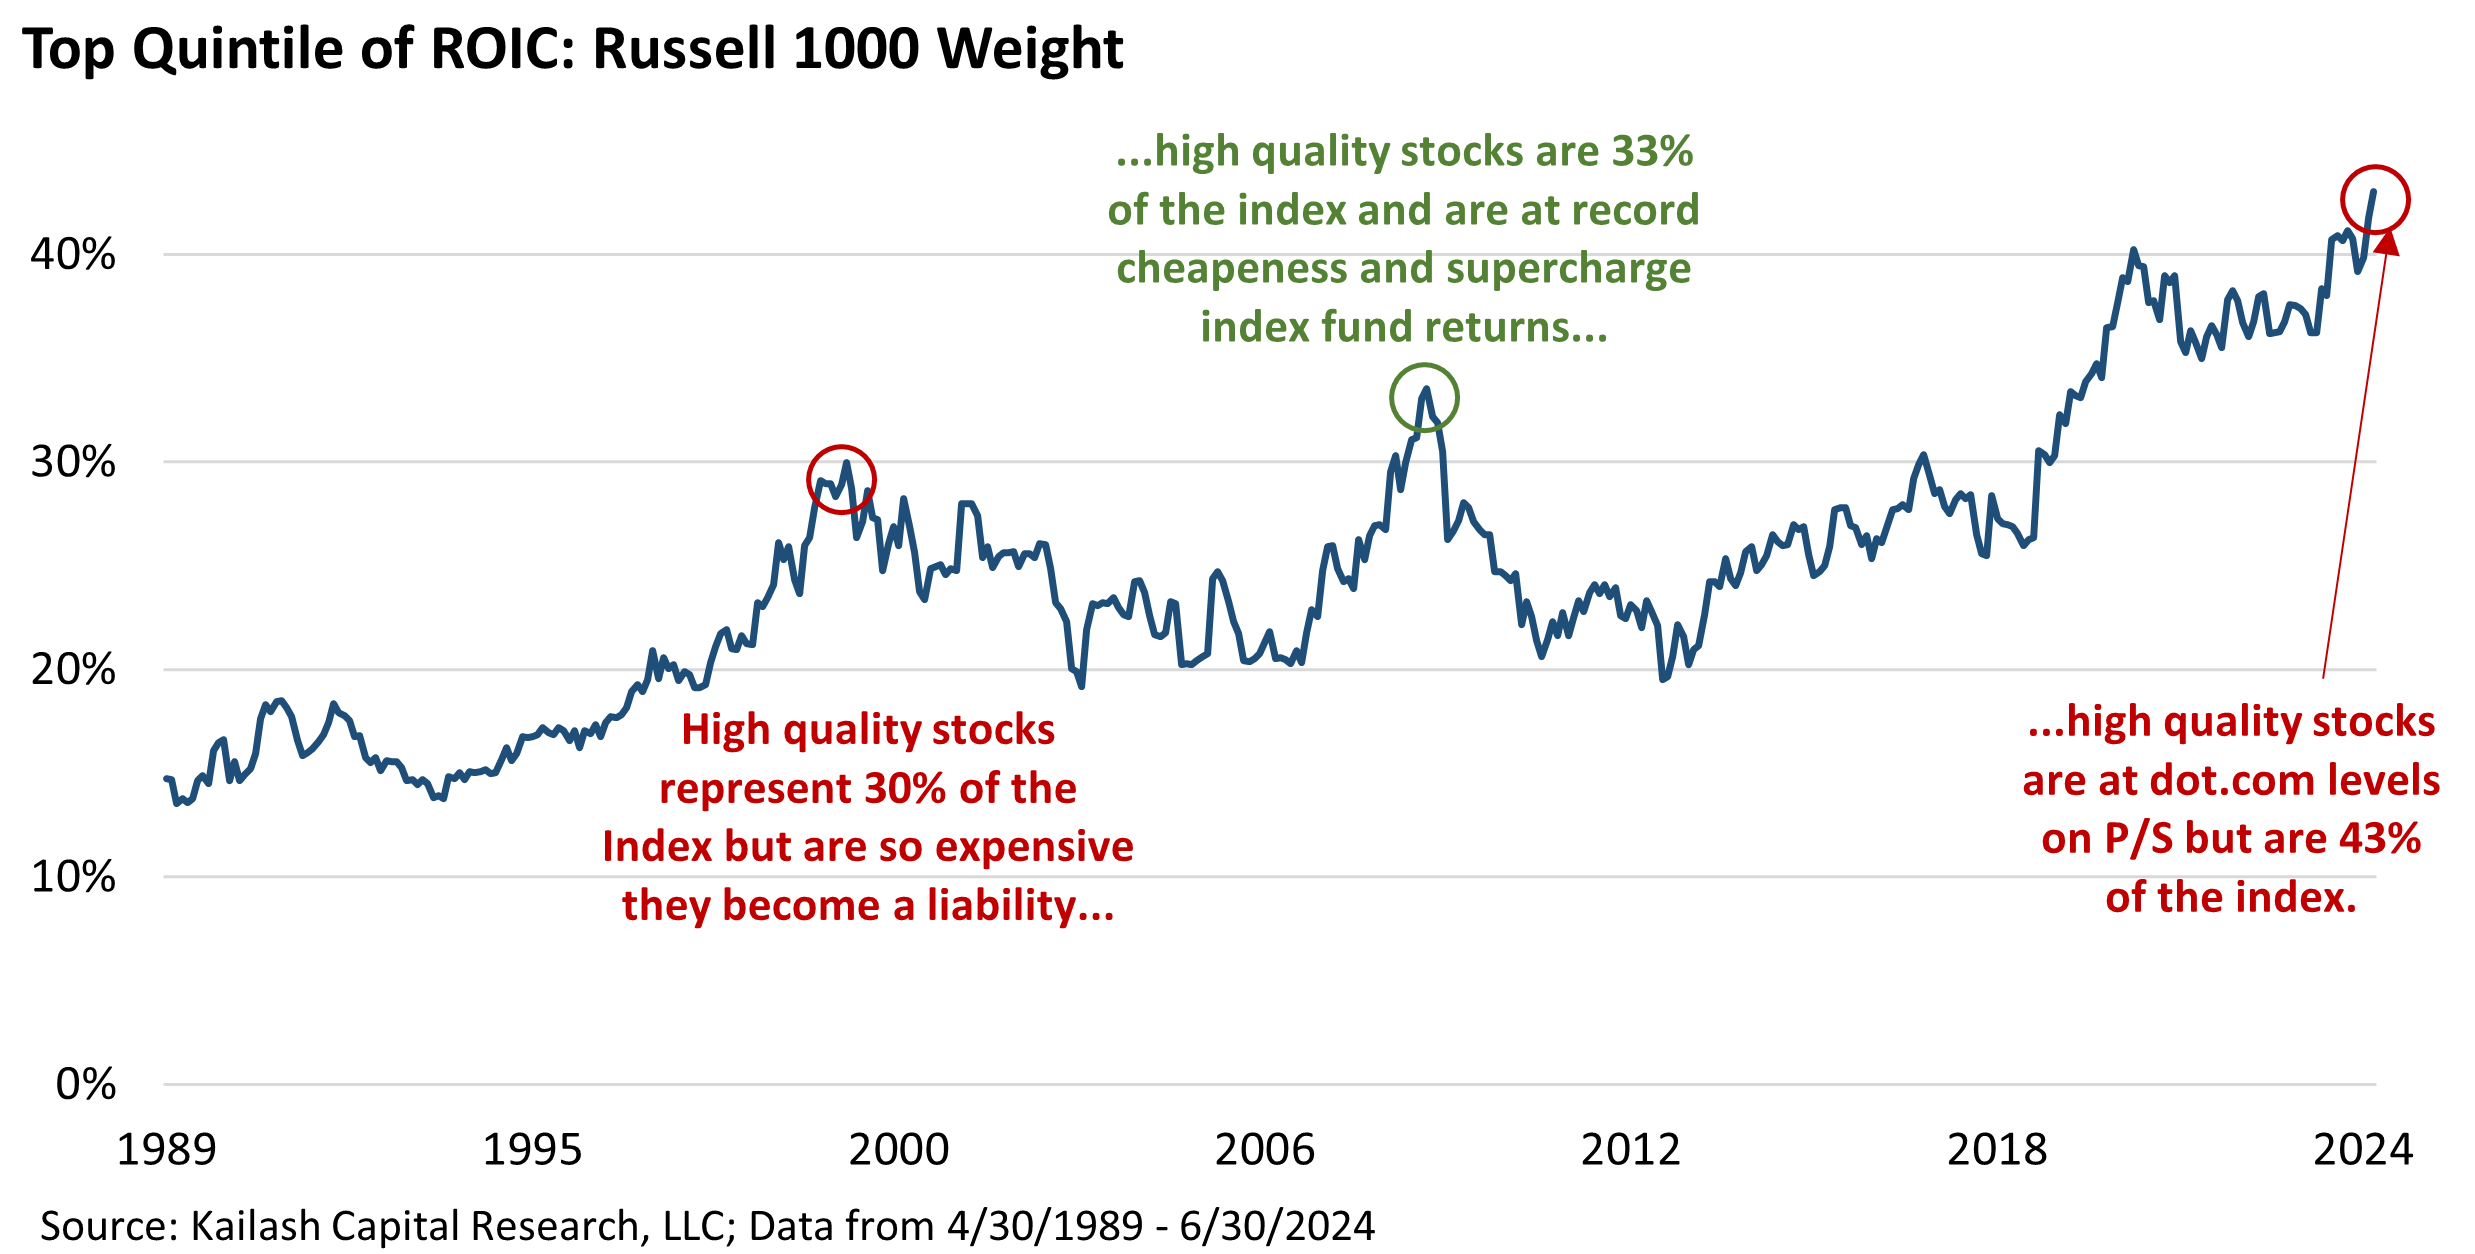
When high quality stocks become an overwhelming weighting in an index fund it can be a bad thing, like in 1999 when they were priced to perfection. It can also be a wonderful thing, like in 2009, when top quality blue-chips offered double-digit FCF yields. We just showed that high quality stocks today are almost as expensive as they were at the peak of the dot.com bubble. But the difference is today they make up 43% of the benchmark vs. only 30% at the dot.com peak.
For those who claim we are talking our own book because we run active strategies in our asset management business, we’d like to remind you: we have always taken the position that cheap beta is an essential investment tool and the portfolio managers who write this commentary happily sub-advise an index fund. The whole world need not be riven by all-or-nothing thinking!
The first row in the table below shows the characteristics of the highest quality (top quintile of ROIC) stocks discussed in this paper.

The second row shows the fundamentals of the top-quintile ROIC stocks favored by KCR’s model. Not complicated: KCR’s model has identified stocks in the top 20% of ROIC firms that are trading at discounts to the group and pay you more to own them.
Below, we provide a list of the top quintile ROIC stocks favored by KCR’s models.


Disclaimer
The information, data, analyses, and opinions presented herein (a) do not constitute investment advice, (b) are provided solely for informational purposes and therefore are not, individually or collectively, an offer to buy or sell a security, (c) are not warranted to be correct, complete or accurate, and (d) are subject to change without notice. Kailash Capital Research, LLC and its affiliates (collectively, “KCR”) shall not be responsible for any trading decisions, damages, or other losses resulting from, or related to, the information, data, analyses or opinions or their use. The information herein may not be reproduced or retransmitted in any manner without the prior written consent of KCR. In preparing the information, data, analyses, and opinions presented herein, KCR has obtained data, statistics, and information from sources it believes to be reliable. KCR, however, does not perform an audit or seek independent verification of any of the data, statistics, and information it receives. KCR and its affiliates do not provide tax, legal, or accounting advice. This material has been prepared for informational purposes only and is not intended to provide, and should not be relied on for tax, legal, or accounting advice. You should consult your tax, legal, and accounting advisors before engaging in any transaction.
Nothing herein shall limit or restrict the right of affiliates of KCR to perform investment management or advisory services for any other persons or entities. Furthermore, nothing herein shall limit or restrict affiliates of KCR from buying, selling, or trading securities or other investments for their own accounts or for the accounts of their clients. Affiliates of KCR may at any time have, acquire, increase, decrease, or dispose of the securities or other investments referenced in this publication. KCR shall have no obligation to recommend securities or investments in this publication as a result of its affiliates’ investment activities for their own accounts or for the accounts of their clients.
© 2023 Kailash Capital Research, LLC – All rights reserved.
August 7, 2024 |
| Authors: Matthew Malgari, Nathan Przybylo, Dr. Sanjeev Bhojraj and John Durkin
August 7, 2024
Authors: Matthew Malgari, Nathan Przybylo, Dr. Sanjeev Bhojraj and John Durkin