As early as 2014, the financial news media became obsessed with the idea that stock buybacks were being funded by debt and that a reprise of the Great Financial Crisis was looming. By 2016, politicians got involved with many in our political class claiming that stock buybacks were hurting the US economy by reducing capital expenditures and R&D. In both cases, the claims made by media and politicians alike were empirically wrong.
Get our insights direct to your inbox: SUBSCRIBE
We know because the KCR team published two pieces – one in 2014 and another in 2016 – putting forward the data to debunk the alarmist claims. Across both white papers, KCR defended stock buybacks as being:
- Financially stable: we highlighted that buybacks were not debt-funded like in 2007, instead they were fueled by strong free cash flow and falling leverage
- Operationally healthy: we explained that the stock buybacks being made were not only funded primarily by free cash flow, but they were happening at the same time as record investment in R&D and capex
- Economically rational: we explained in detailed analysis of the data that the bulk of repurchases being made in 2014 and 2016 were economically rational and rooted in strong capital discipline
For recent readers of KCR’s work it may be difficult to believe we were fighting the bearish crowd in 2014 and 2016. But it is true. We were open advocates for the record stock buybacks in those years. Just like we were bullish tech stocks in those years.
But the story has changed in a dramatic and dangerous way. The chart below shows the rolling 12 months dollar value of total repurchases made by all companies that were net buyers of their company’s stock, since 1989. You can see where we wrote our 2014 and 2016 papers advocating for continued stock buybacks in the green text. We were bullish then!

With net repurchasers buying over $1tn in stock like they did in 2021 our message has changed. On to the painful evidence at hand.
The chart below is the average price to sales ratio of all companies that are net repurchasers of their own stock. That line is the composite valuation of all the companies that are buying back stock. Omitted are stocks that are either net issuers or doing nothing. What do we see?

The group’s price/sales ratio has surged to all-time highs. Current valuation levels surpass even the 2021 peak, which immediately preceded a sharp market decline.
This alone should make us question the wisdom of allocating capital to stock buybacks. We’ve noted, again in green, where KCR advocated for stock buybacks.
When we wrote those papers saying that stock buybacks were not just rational but healthy, the entire cohort of net repurchasers traded at modest valuations of 1.7x and 1.6x sales in 2014 and 2016, respectively. Today the group’s aggregate valuation is 3.4x sales.
Said differently: the companies that are net repurchasers of their stocks are trading at over a 100% premium to the years where we endorsed the behavior. Now 3.4x sales is not, in and of itself, necessarily some alarming multiple. After all, what if the constituents that make up that line went from cyclicals to higher margin companies that deserve a higher multiple because for every dollar of sales they generated a lot more free cash flow?
That idea is entirely plausible and a fair one to ask.
So, as you might expect, KCR has provided the answer on the next page……
Turns out, that is not true. The chart below shows the free cash flow to enterprise value of all the net repurchasers. This metric tells us that the record $1 trillion+ in net repurchases made in the last 12 months were to buy stock trading at a ~2% free cash flow yield. Flip it around and that is 50x free cash flow.
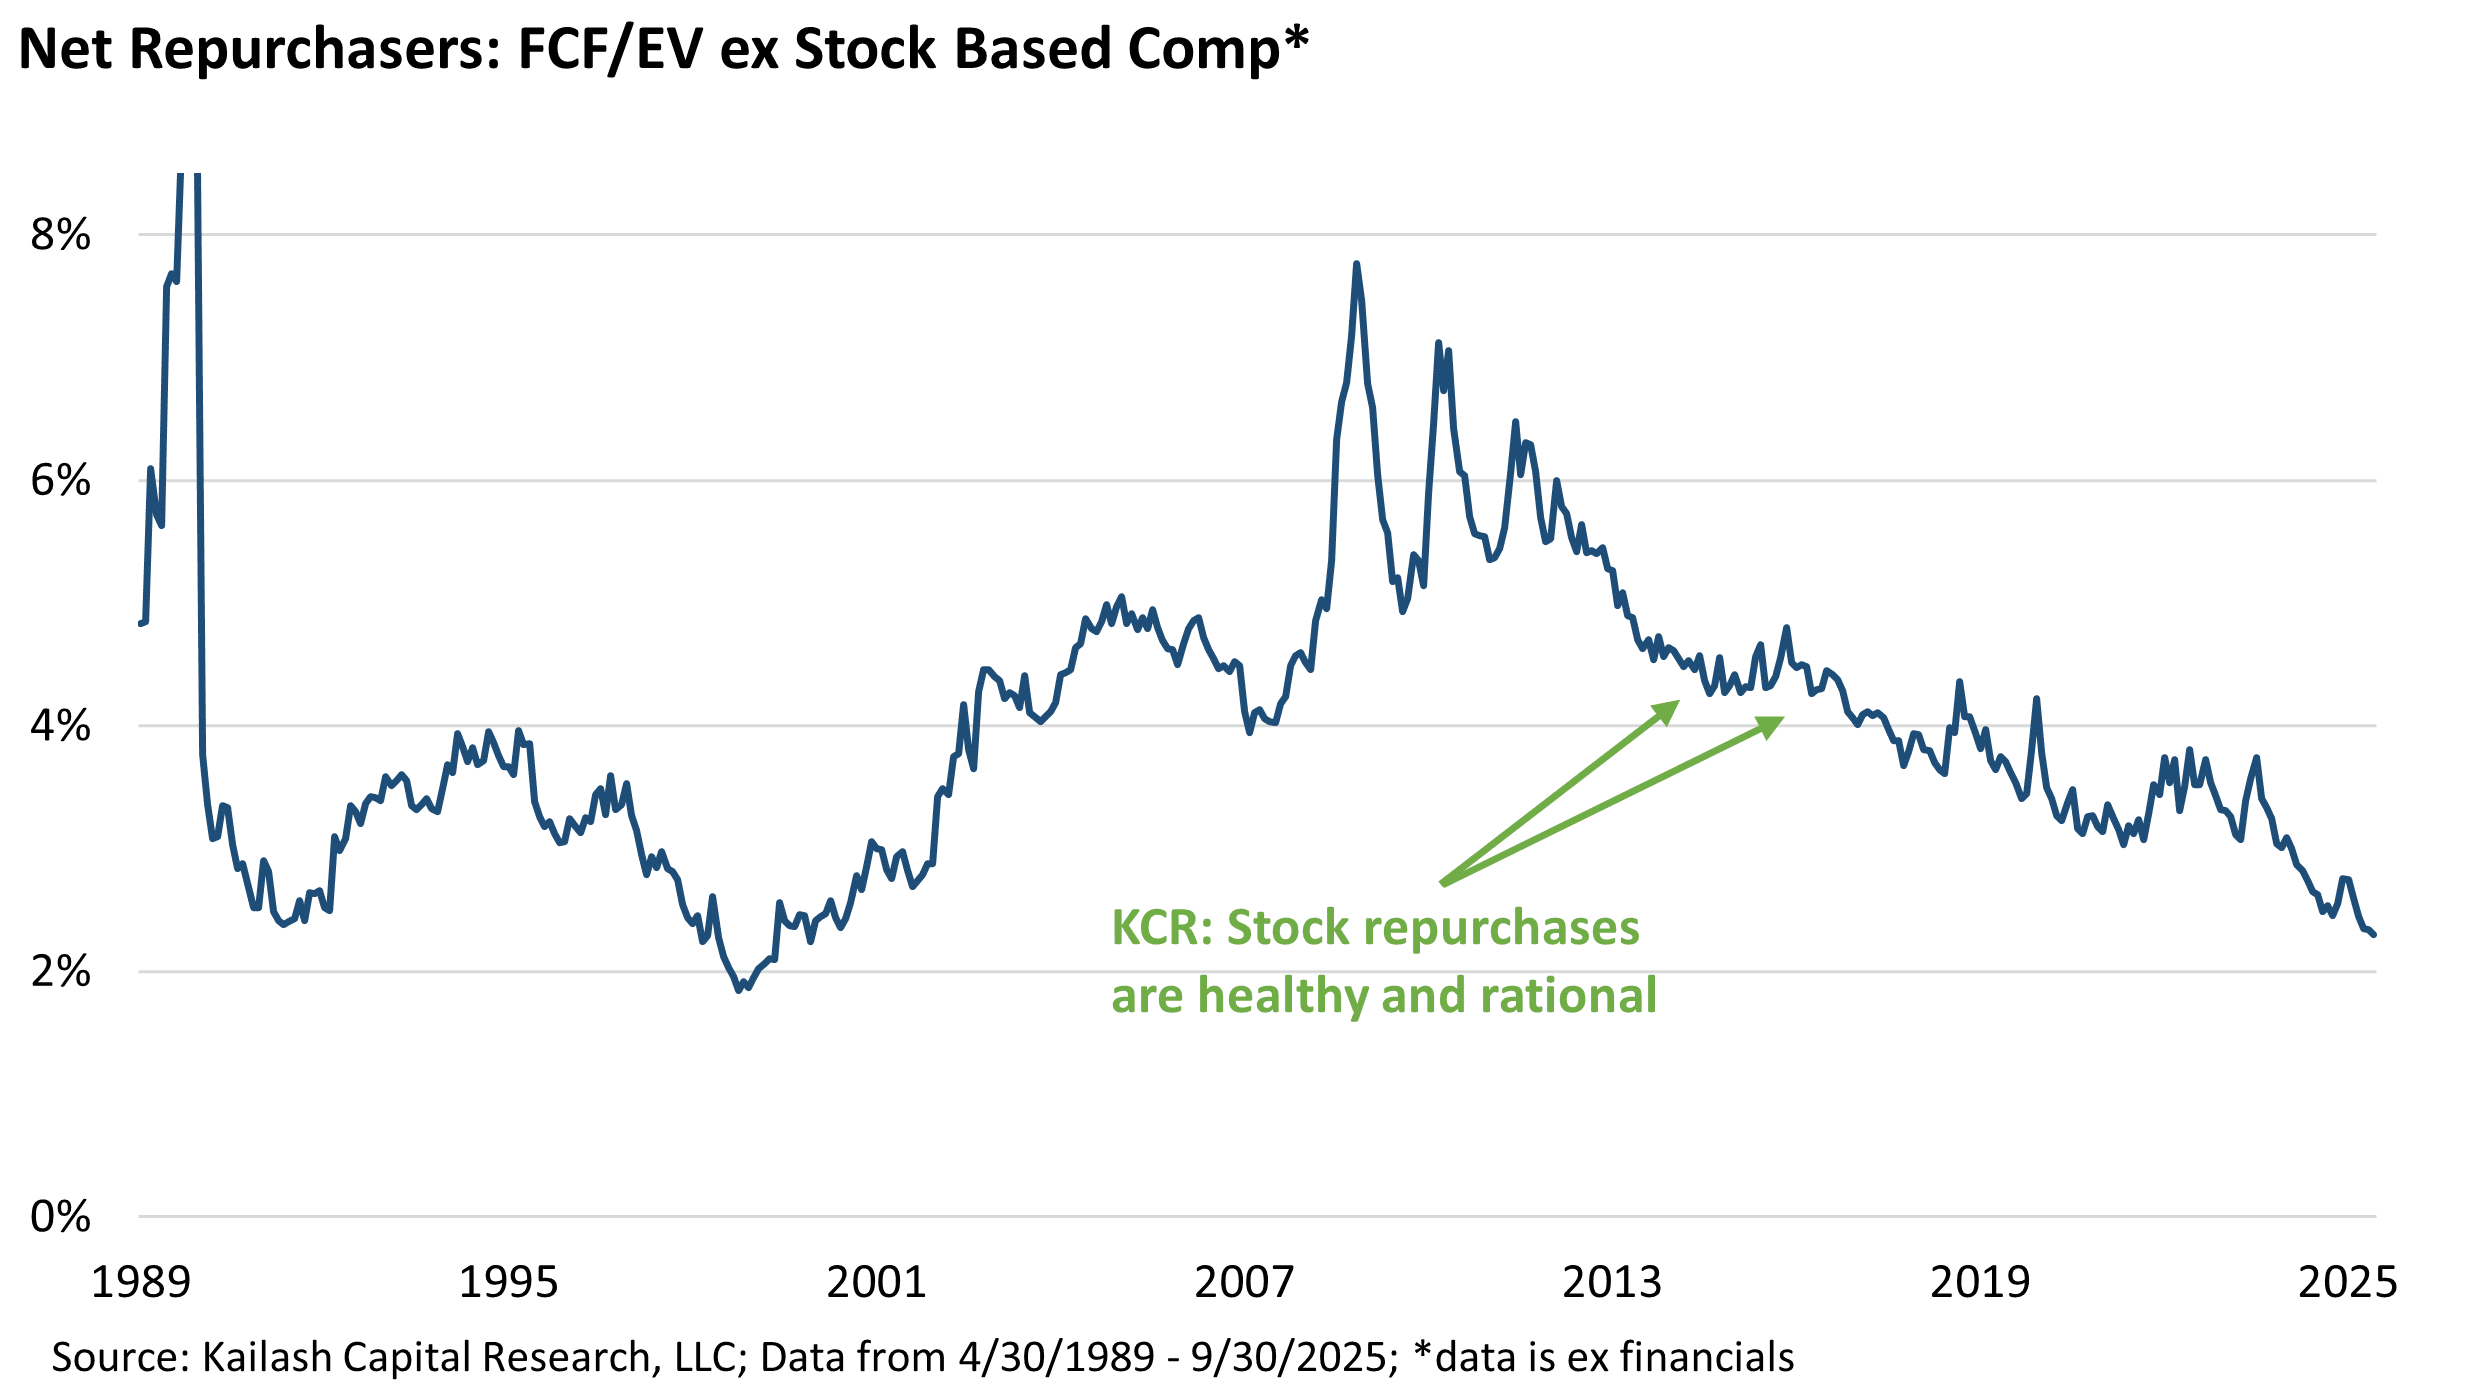
So companies that are more expensive than any time in history other than the very peak of the dot.com bubble, are buying back the largest amounts of their own stock in recorded history. Sheer. Madness.
What other characteristics might investors in such companies be interested in?
Well, if you look at our 2016 paper, we presented the data showing that the companies that were net repurchasers were not using leverage to buy their own stock back. In that paper, we showed they were actually buying back a lot of stock while reducing their leverage.
On to the next page to see how the facts have changed.
In our 2014 and 2016 missives which defended corporate buybacks as well-funded, one of our cornerstone arguments was that the repurchases were happening entirely from free cash flow after the companies had funded record R&D and capital expenditures. The repurchases in those periods were characterized by flat to falling levels of net debt.
That has changed in a meaningful manner. The line in the chart below shows the net debt of all the companies repurchasing stock. After pulling back to $2 trillion post covid, the net debt on corporate balance sheets has spiked to levels last seen immediately prior to the Great Financial Crisis.

We will be the first to admit that there has been significant dollar destruction via financial repression, that the economy is much bigger today than it was in 2007, and that this is, conceptually, a valid reason to ignore the data. But the bigger issue is simply that unlike 2014 and 2016, today’s repurchases are indeed requiring borrowing. How do we know?
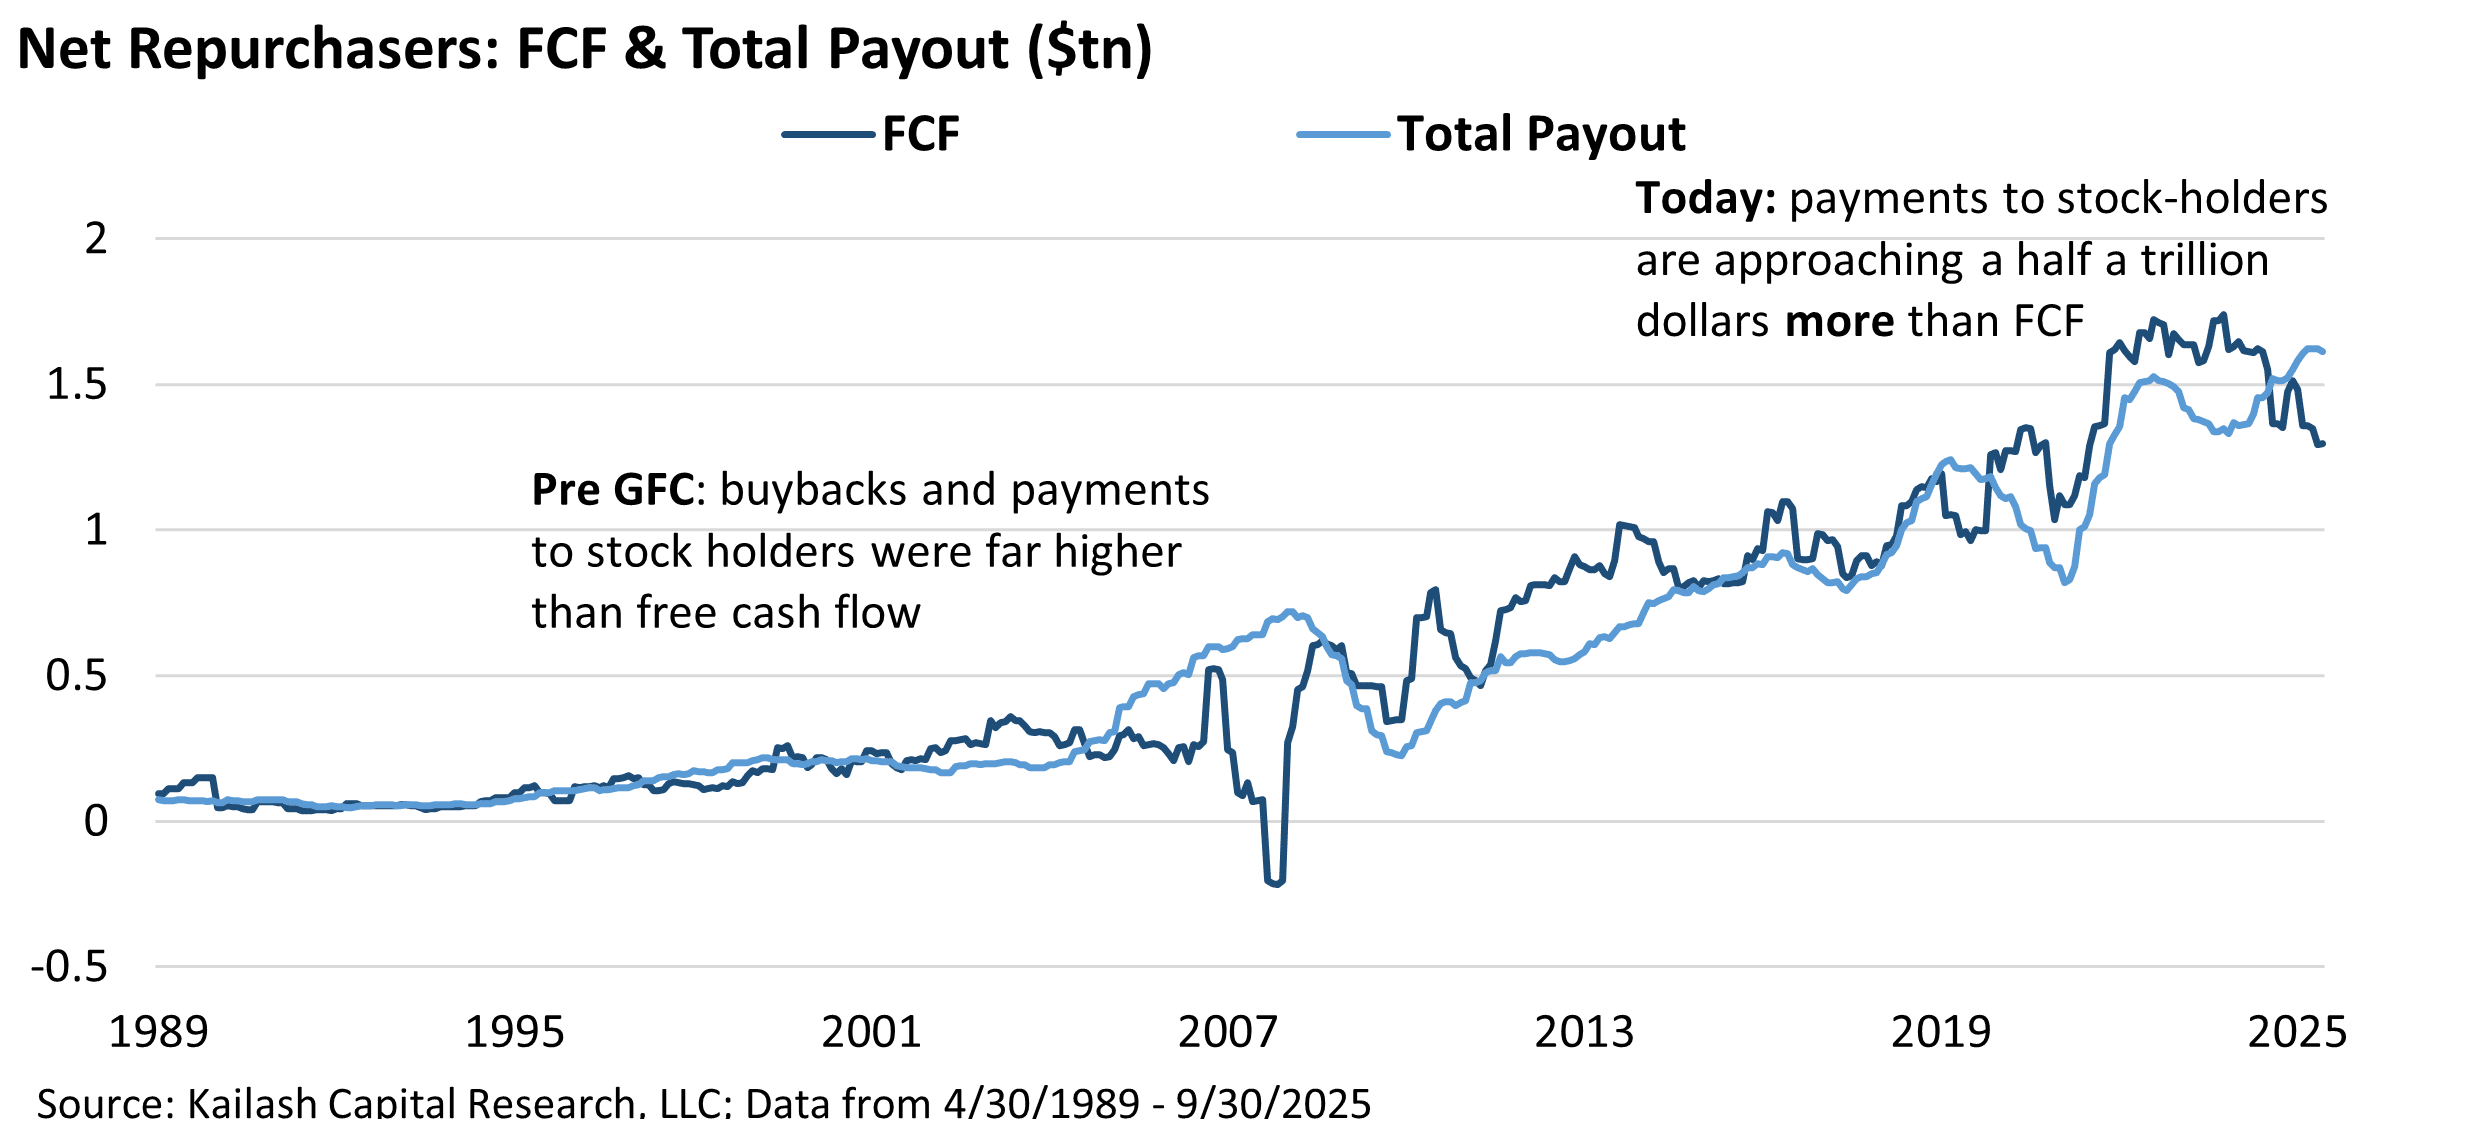
In the chart below the navy blue line shows the free cash flow of corporate repurchasers. The light blue line shows the total dollars being paid out to shareholders. When the navy blue line is below the light blue line, repurchasers have to borrow to make distributions.
We close with the following table which simply compares the fundamentals of the entire cohort of net repurchasers vs. the net repurchasers in the worst quintile of KCR’s ranking methodology. What we see is the following:
- Top Row – All Net Repurchasers: Company’s that are buying their stock back are paying an average of nearly 50x their free cash flow (2.3% FCF Yield) and trading at 28.4x GAAP earnings – not cheap
- Second Row – KCR’s Worst Ranked Repurchasers: Within the group above, the KCR team’s ranking methodology finds that the repurchasers we dislike are paying nearly 100x their free cash flow (1.1% FCF Yield), trade at 43.2x GAAP earnings, and have buyback yields of 2%, which is greater than their available free cash flow
Said simply: the companies buying back their own stock that are disliked by KCR’s ranking methodologies are borrowing money to buy stock back at absurd multiples and they are growing at only 17% vs. 71% for all net repurchasers (last column). Not complicated.

In the table below we show you the worst ranked net repurchasers that make up that second row. [1]
Our next piece will take the data above and add a new sorting feature to it. The goal in the upcoming piece is to help investors avoid the most financially precarious and fiscally reckless capital allocators within the broad group of repurchasers.


Disclaimer
The information, data, analyses, and opinions presented herein (a) do not constitute investment advice, (b) are provided solely for informational purposes and therefore are not, individually or collectively, an offer to buy or sell a security, (c) are not warranted to be correct, complete or accurate, and (d) are subject to change without notice. Kailash Capital Research, LLC and its affiliates (collectively, “KCR”) shall not be responsible for any trading decisions, damages, or other losses resulting from, or related to, the information, data, analyses or opinions or their use. The information herein may not be reproduced or retransmitted in any manner without the prior written consent of KCR. In preparing the information, data, analyses, and opinions presented herein, KCR has obtained data, statistics, and information from sources it believes to be reliable. KCR, however, does not perform an audit or seek independent verification of any of the data, statistics, and information it receives. KCR and its affiliates do not provide tax, legal, or accounting advice. This material has been prepared for informational purposes only and is not intended to provide, and should not be relied on for tax, legal, or accounting advice. You should consult your tax, legal, and accounting advisors before engaging in any transaction.
Nothing herein shall limit or restrict the right of affiliates of KCR to perform investment management or advisory services for any other persons or entities. Furthermore, nothing herein shall limit or restrict affiliates of KCR from buying, selling, or trading securities or other investments for their own accounts or for the accounts of their clients. Affiliates of KCR may at any time have, acquire, increase, decrease, or dispose of the securities or other investments referenced in this publication. KCR shall have no obligation to recommend securities or investments in this publication as a result of its affiliates’ investment activities for their own accounts or for the accounts of their clients.
© 2025 Kailash Capital Research, LLC – All rights reserved.
October 24, 2025 |
| Authors: Matthew Malgari, Nathan Przybylo, Dr. Sanjeev Bhojraj and John Durkin
October 24, 2025
Authors: Matthew Malgari, Nathan Przybylo, Dr. Sanjeev Bhojraj and John Durkin