Markets don’t usually give investors clean signals—but 2025 did, and they weren’t subtle. This year’s “Best Charts” update shows a market increasingly dominated by a handful of mega-caps characterized by extreme valuations. Several measures have climbed into the unfortunate “we’ve never been here before” territory.
We revisit the most important visuals from our 2025 work—from the midcap vs. mega-cap valuation gap, to index-driven concentration, to the swelling cohort of >20x sales stocks—and the trendlines have only grown more stretched. If you’re trying to understand what’s driving returns, where risks are quietly building, and where opportunity may be forming as conditions normalize, these charts are the place to start.
Similar to all prior years after the launch of the website, we have taken the most popular charts from papers we penned in 2025 and updated them through year end.
Get our insights direct to your inbox: SUBSCRIBE
Last year we showed midcap stocks were deeply undervalued vs. large caps. At the time, price-to-sales ratios for the 50 largest companies had surpassed even the 2000 market peak. Below, we revisit two key charts to see how this valuation gap has evolved.
Chart 1: 50 Largest Stocks vs. Russell Midcap
The largest 50 U.S. stocks reached an all-time high price-to-sales ratio, diverging from stable midcap valuations.
- Mega-cap P/S surged to 6x by end-2025, setting a new record.
- Midcap P/S remained near 1.5x, its historical average.
- The valuation gap now exceeds levels seen during the dot-com bubble.
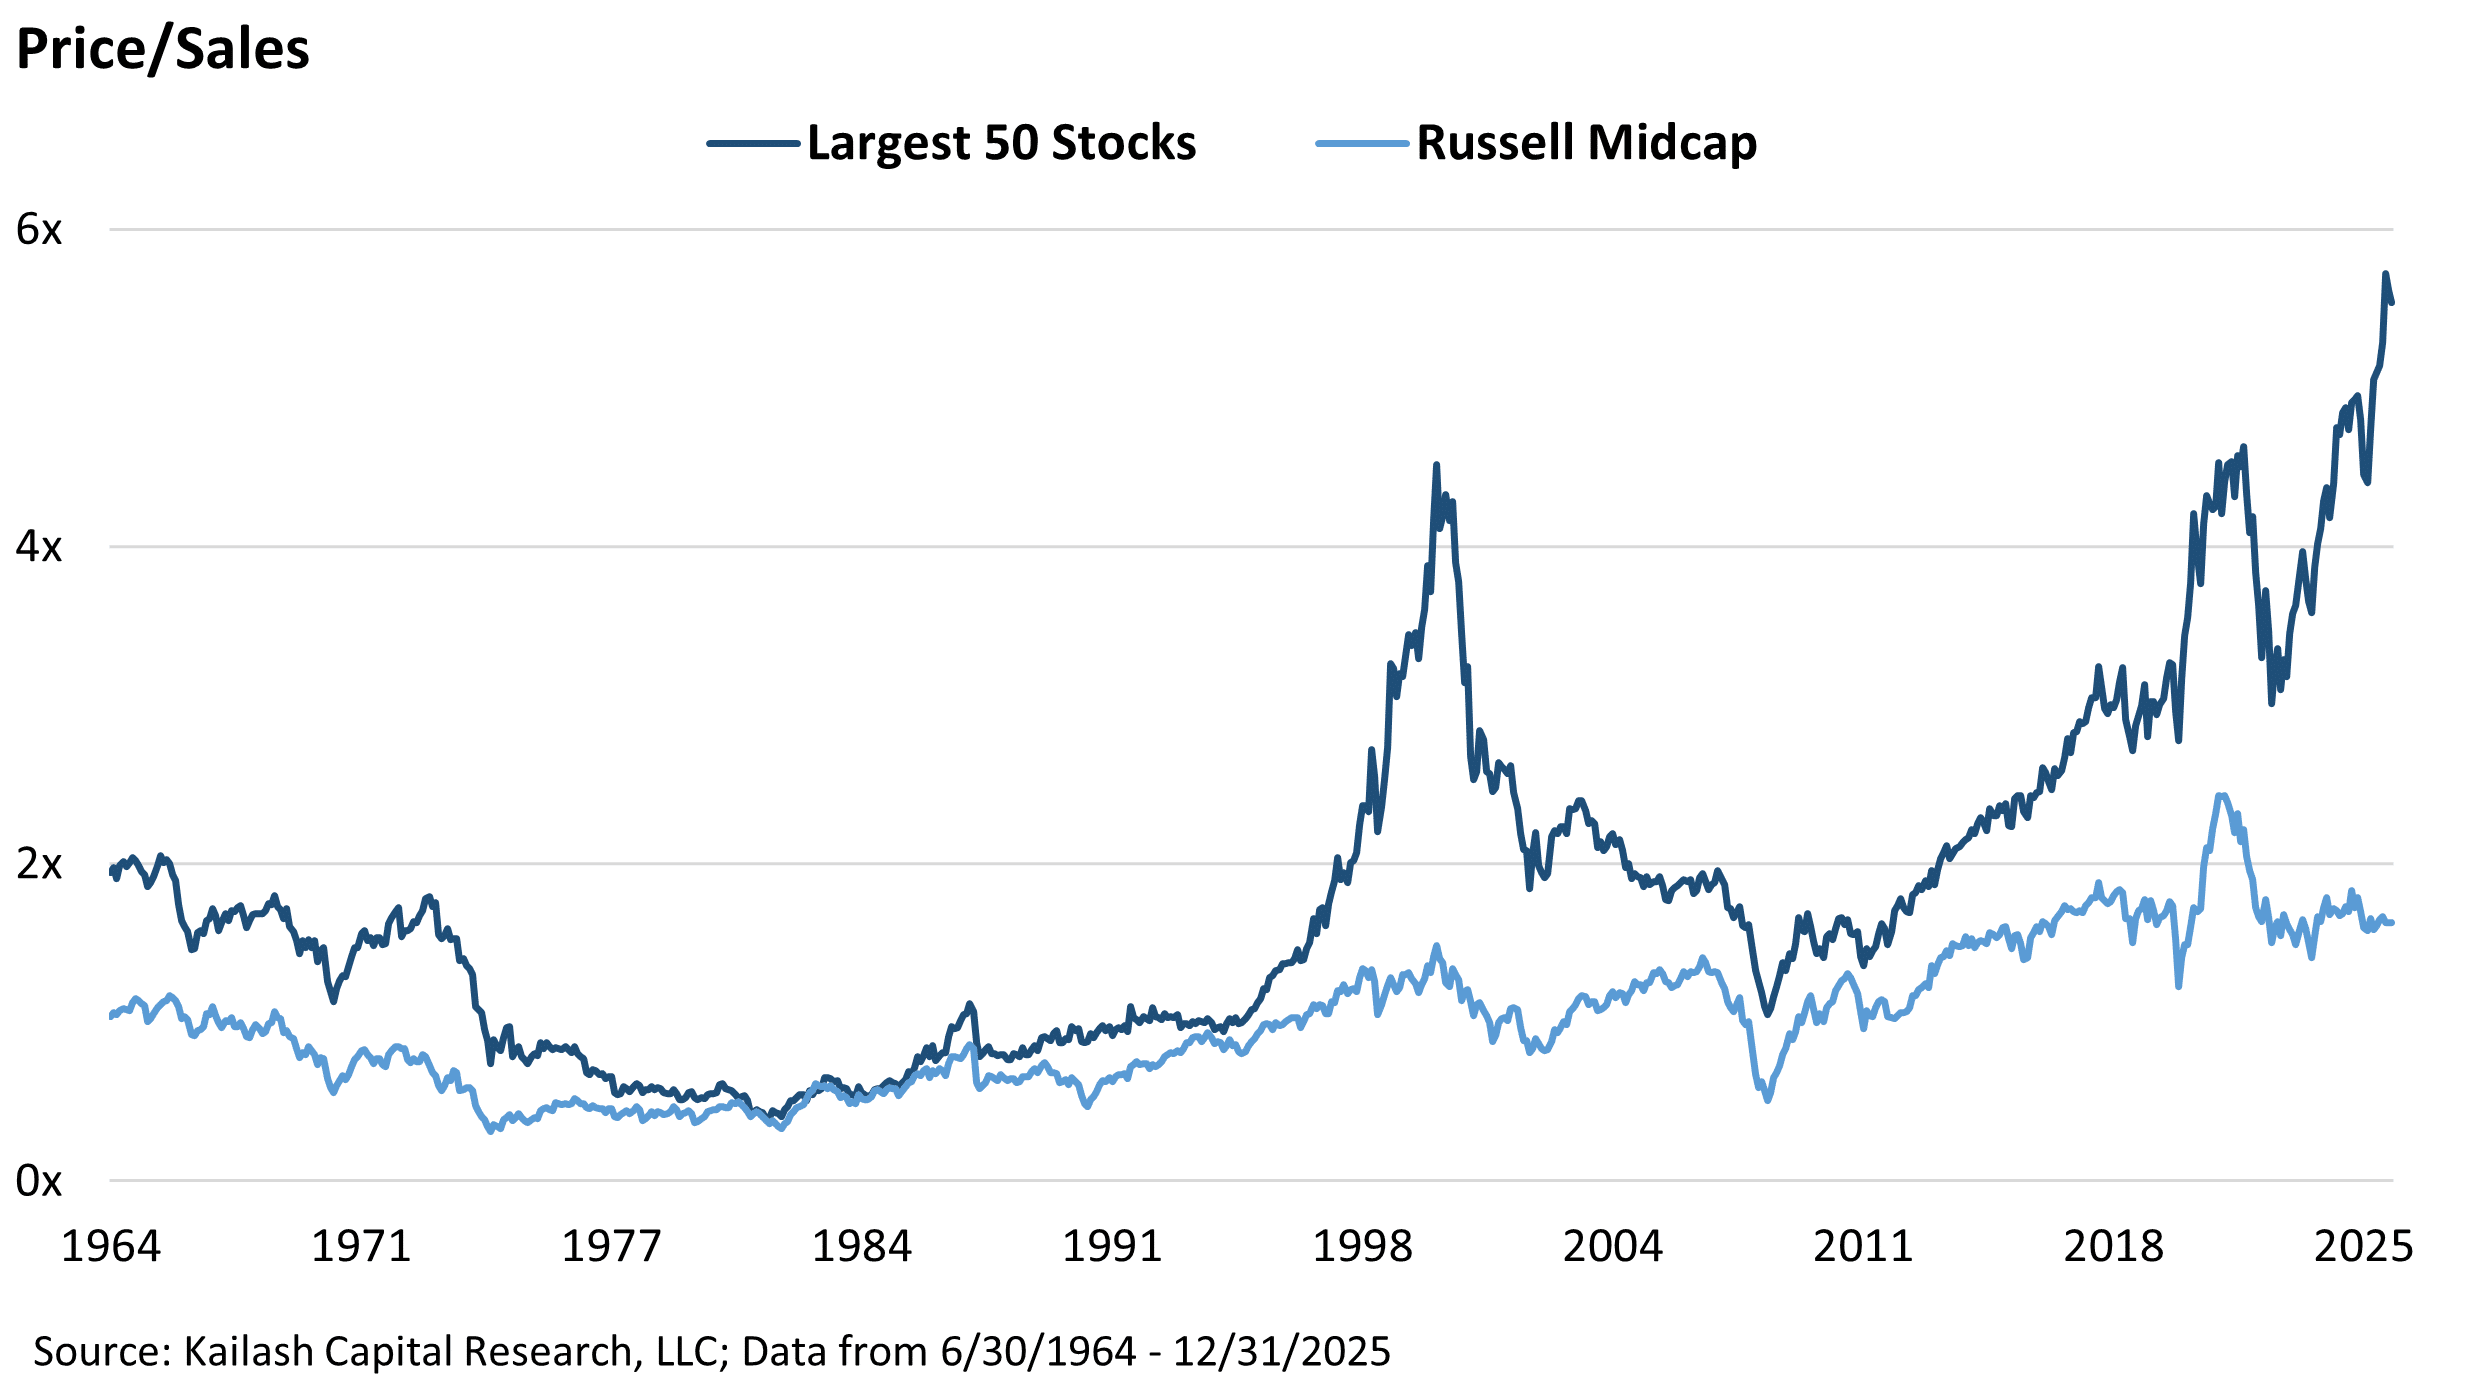
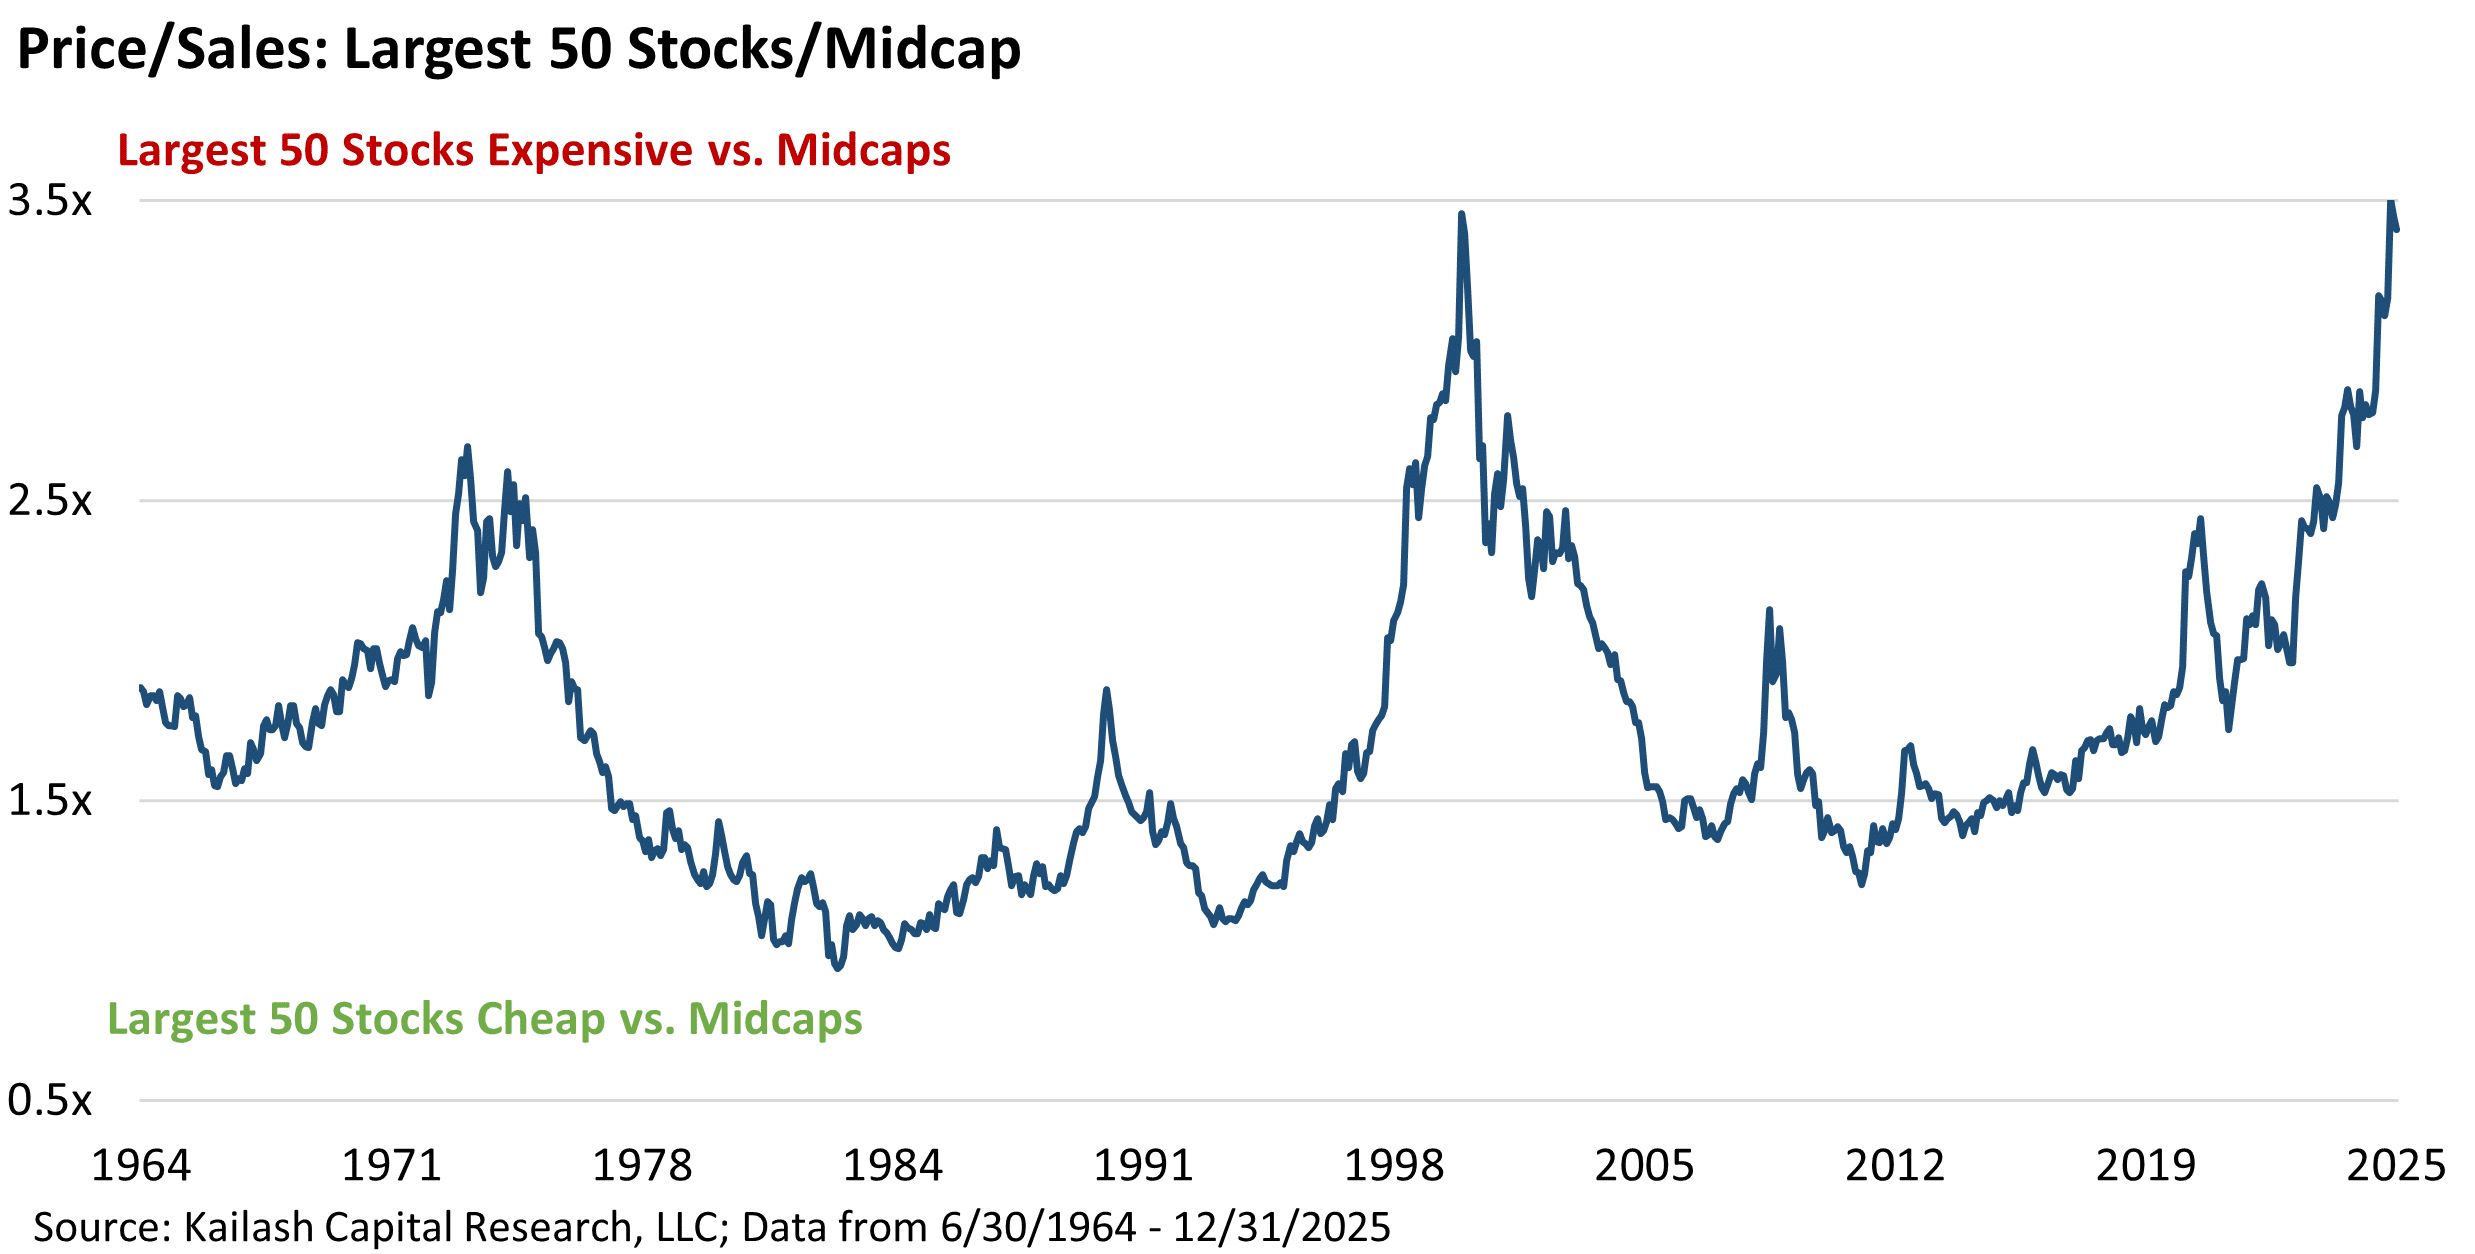
Chart 2: P/S Ratio – Largest 50 Stocks divided by the P/S Ratio of the Midcap Index
The relative valuation of the largest 50 stocks to midcaps has reached a historic high of 3.4x.
- Ratio now surpasses peaks from both the 1970s and 2000 bubbles.
- Post-2020 slope reflects an accelerating premium for mega-caps.
- Such extremes have historically preceded sharp reversals.
Last year we asked whether capitalism is in crisis, pointing to extreme market concentration and index-driven distortions in capital allocation. We’ve updated three key charts from that piece, shown below. What looked historically stretched in March 2025 has since become an outlier with no historical precedent. The largest stock in America is now over 2,000x larger than the median American company.
Chart 3: Max vs. Median Market Cap (Russell 3000)
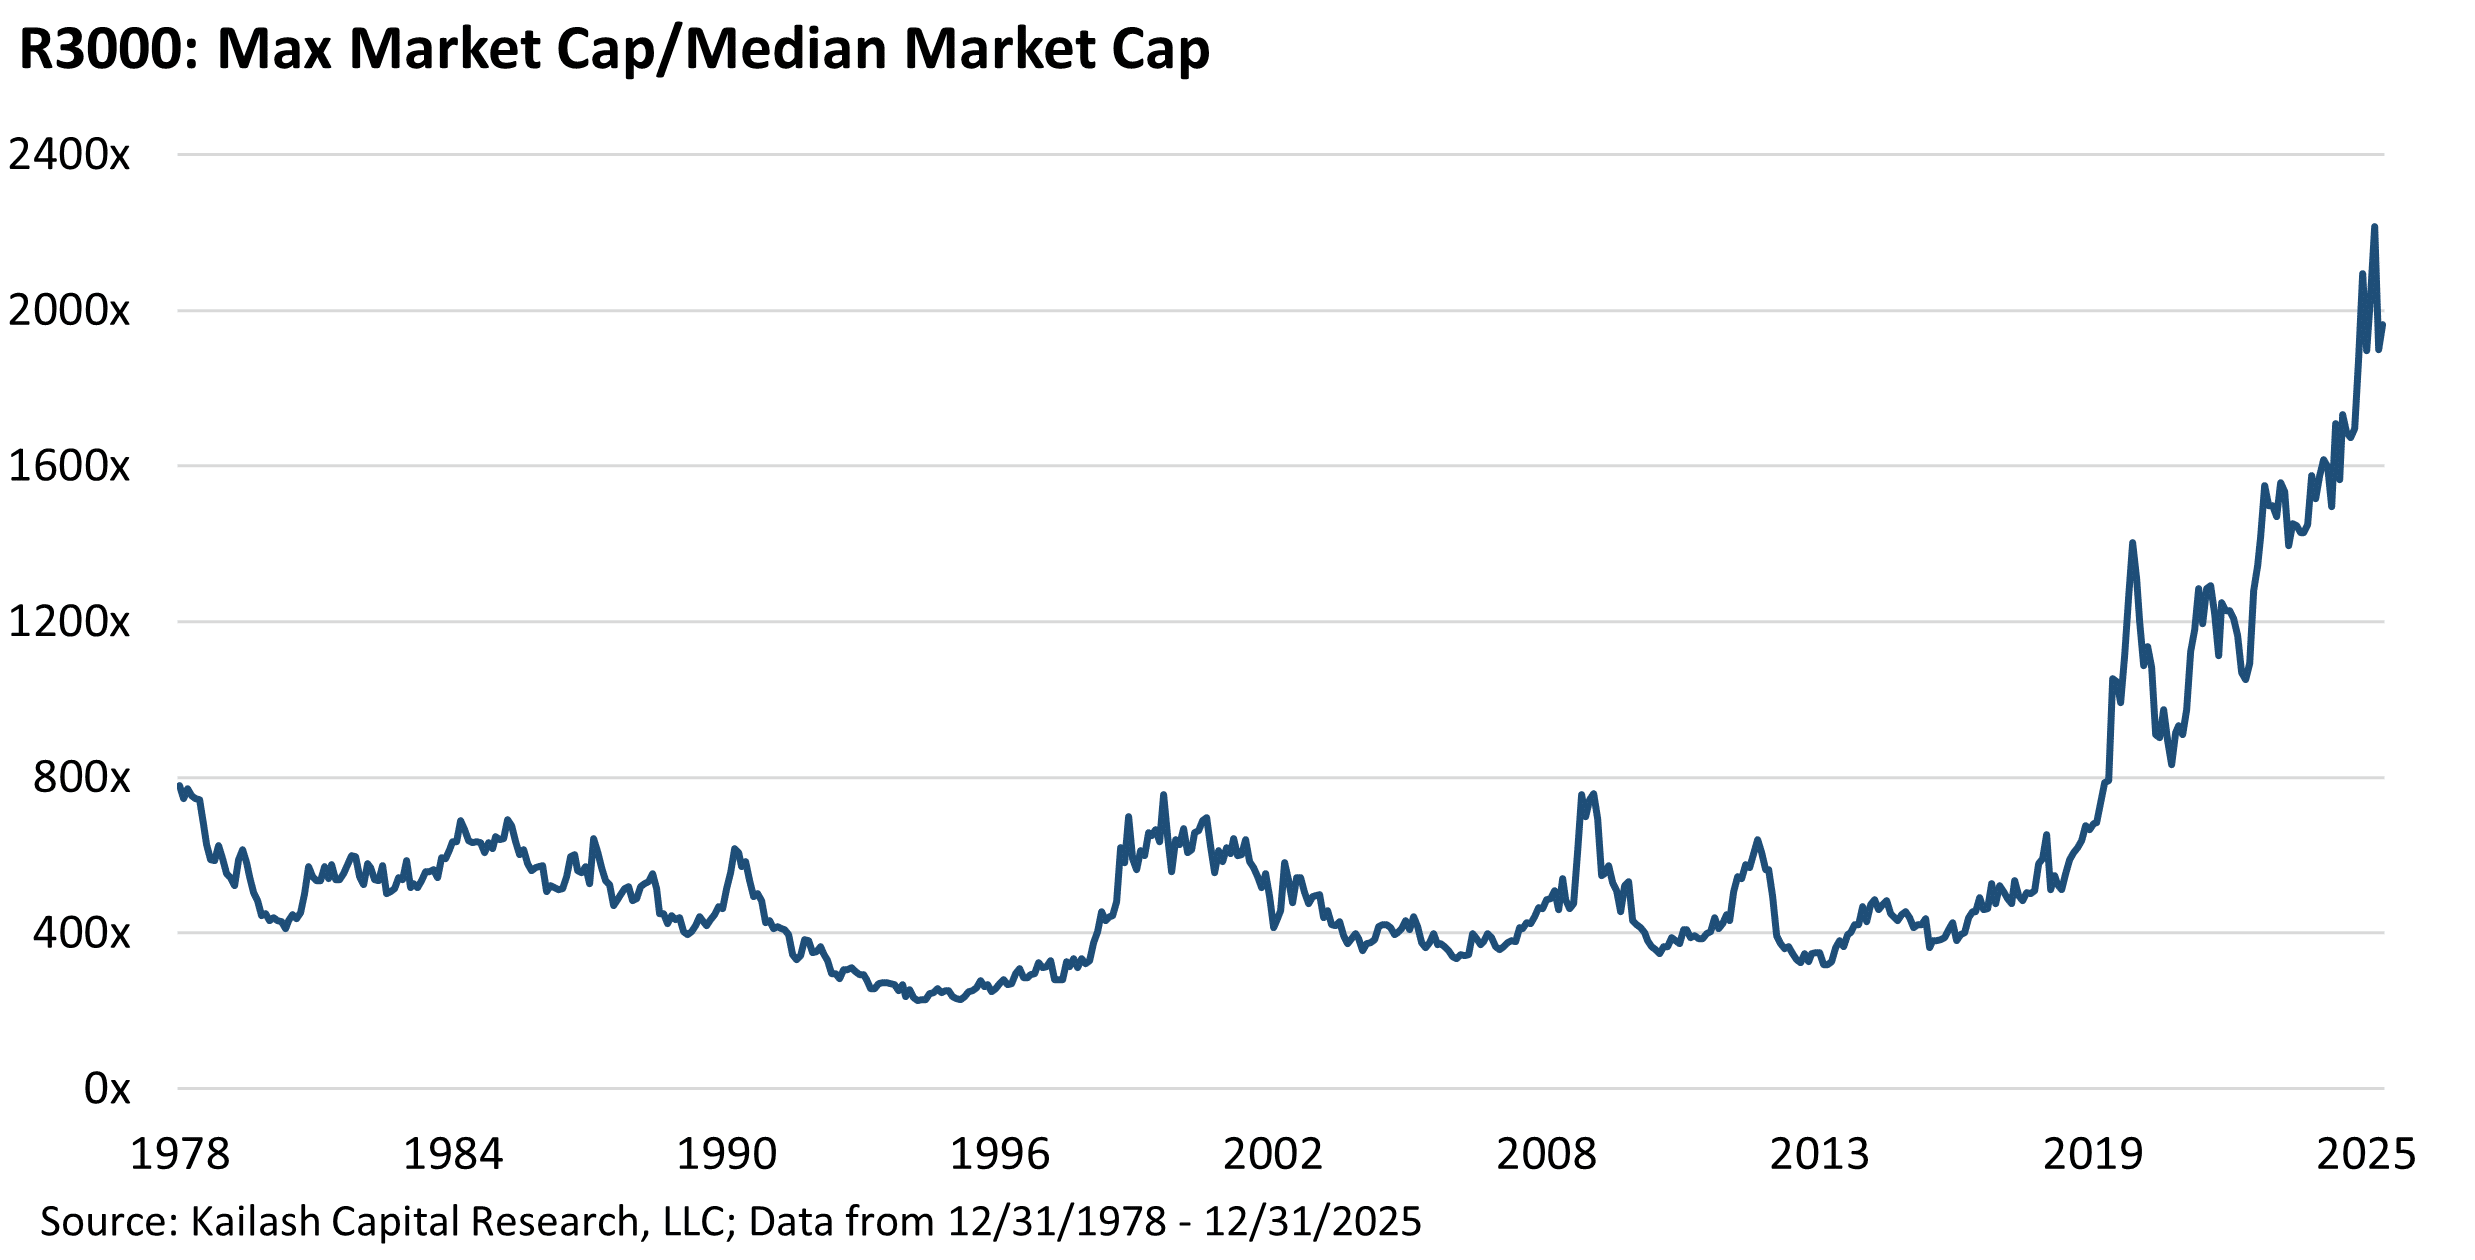
Chart 4: Number of Firms by Market Cap
- ~75% of R3000 companies are under $10B in market cap.
- Only 214 firms exceed $50B.
- Just 16 firms surpass $500B, yet those stocks overwhelmingly drive index returns.
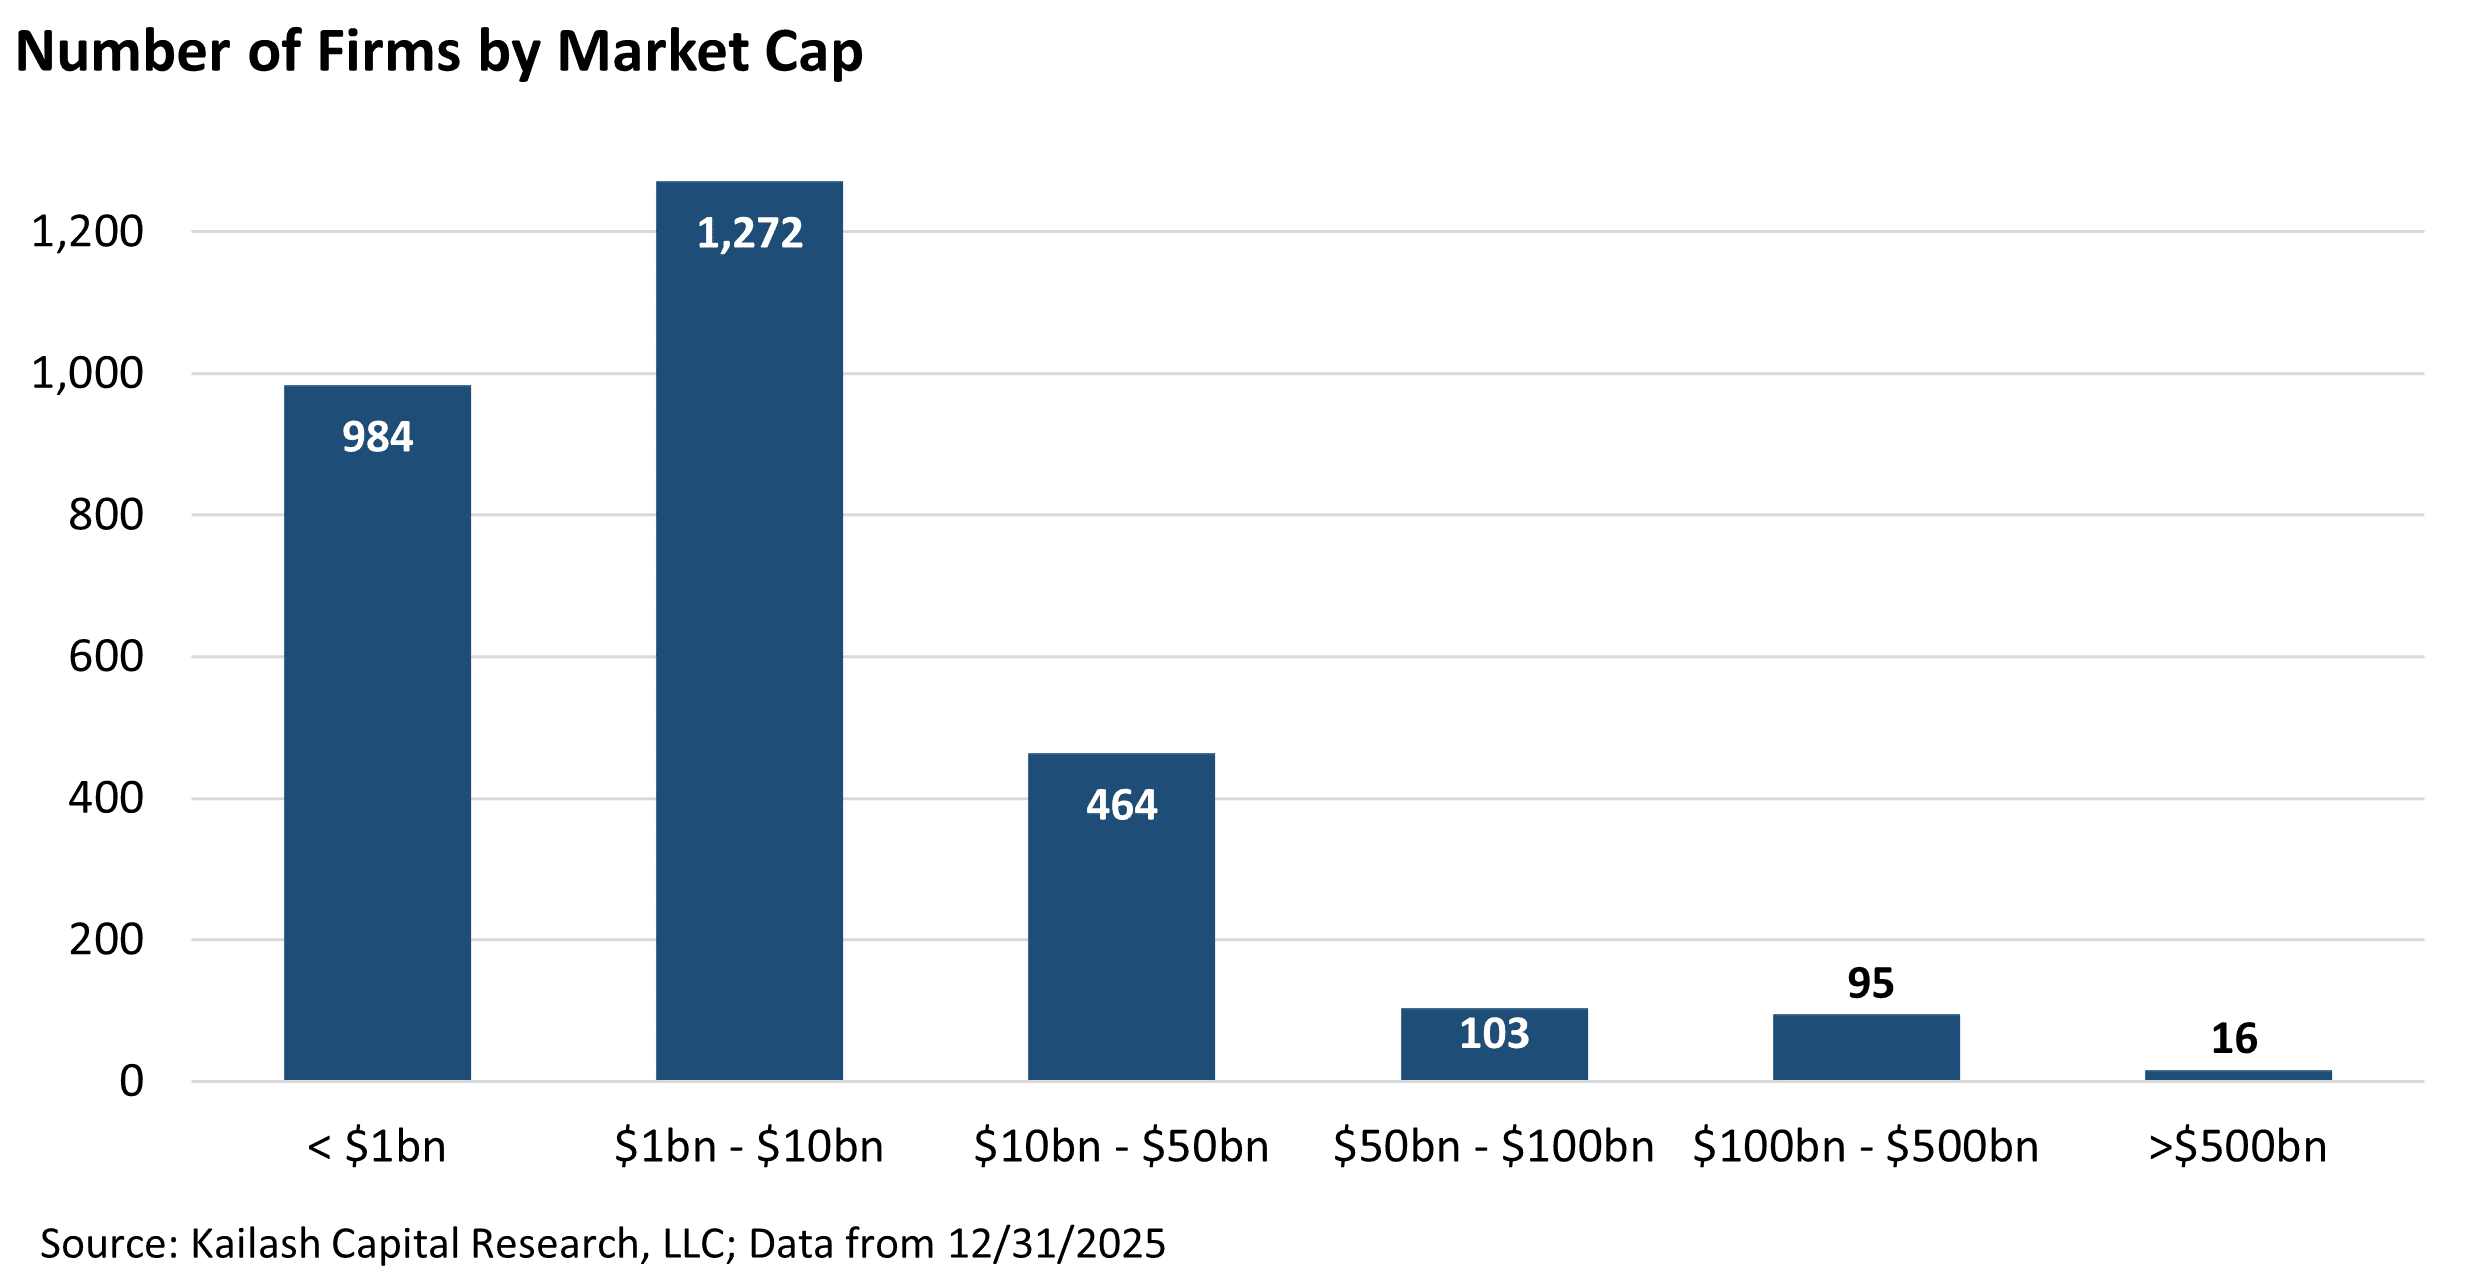
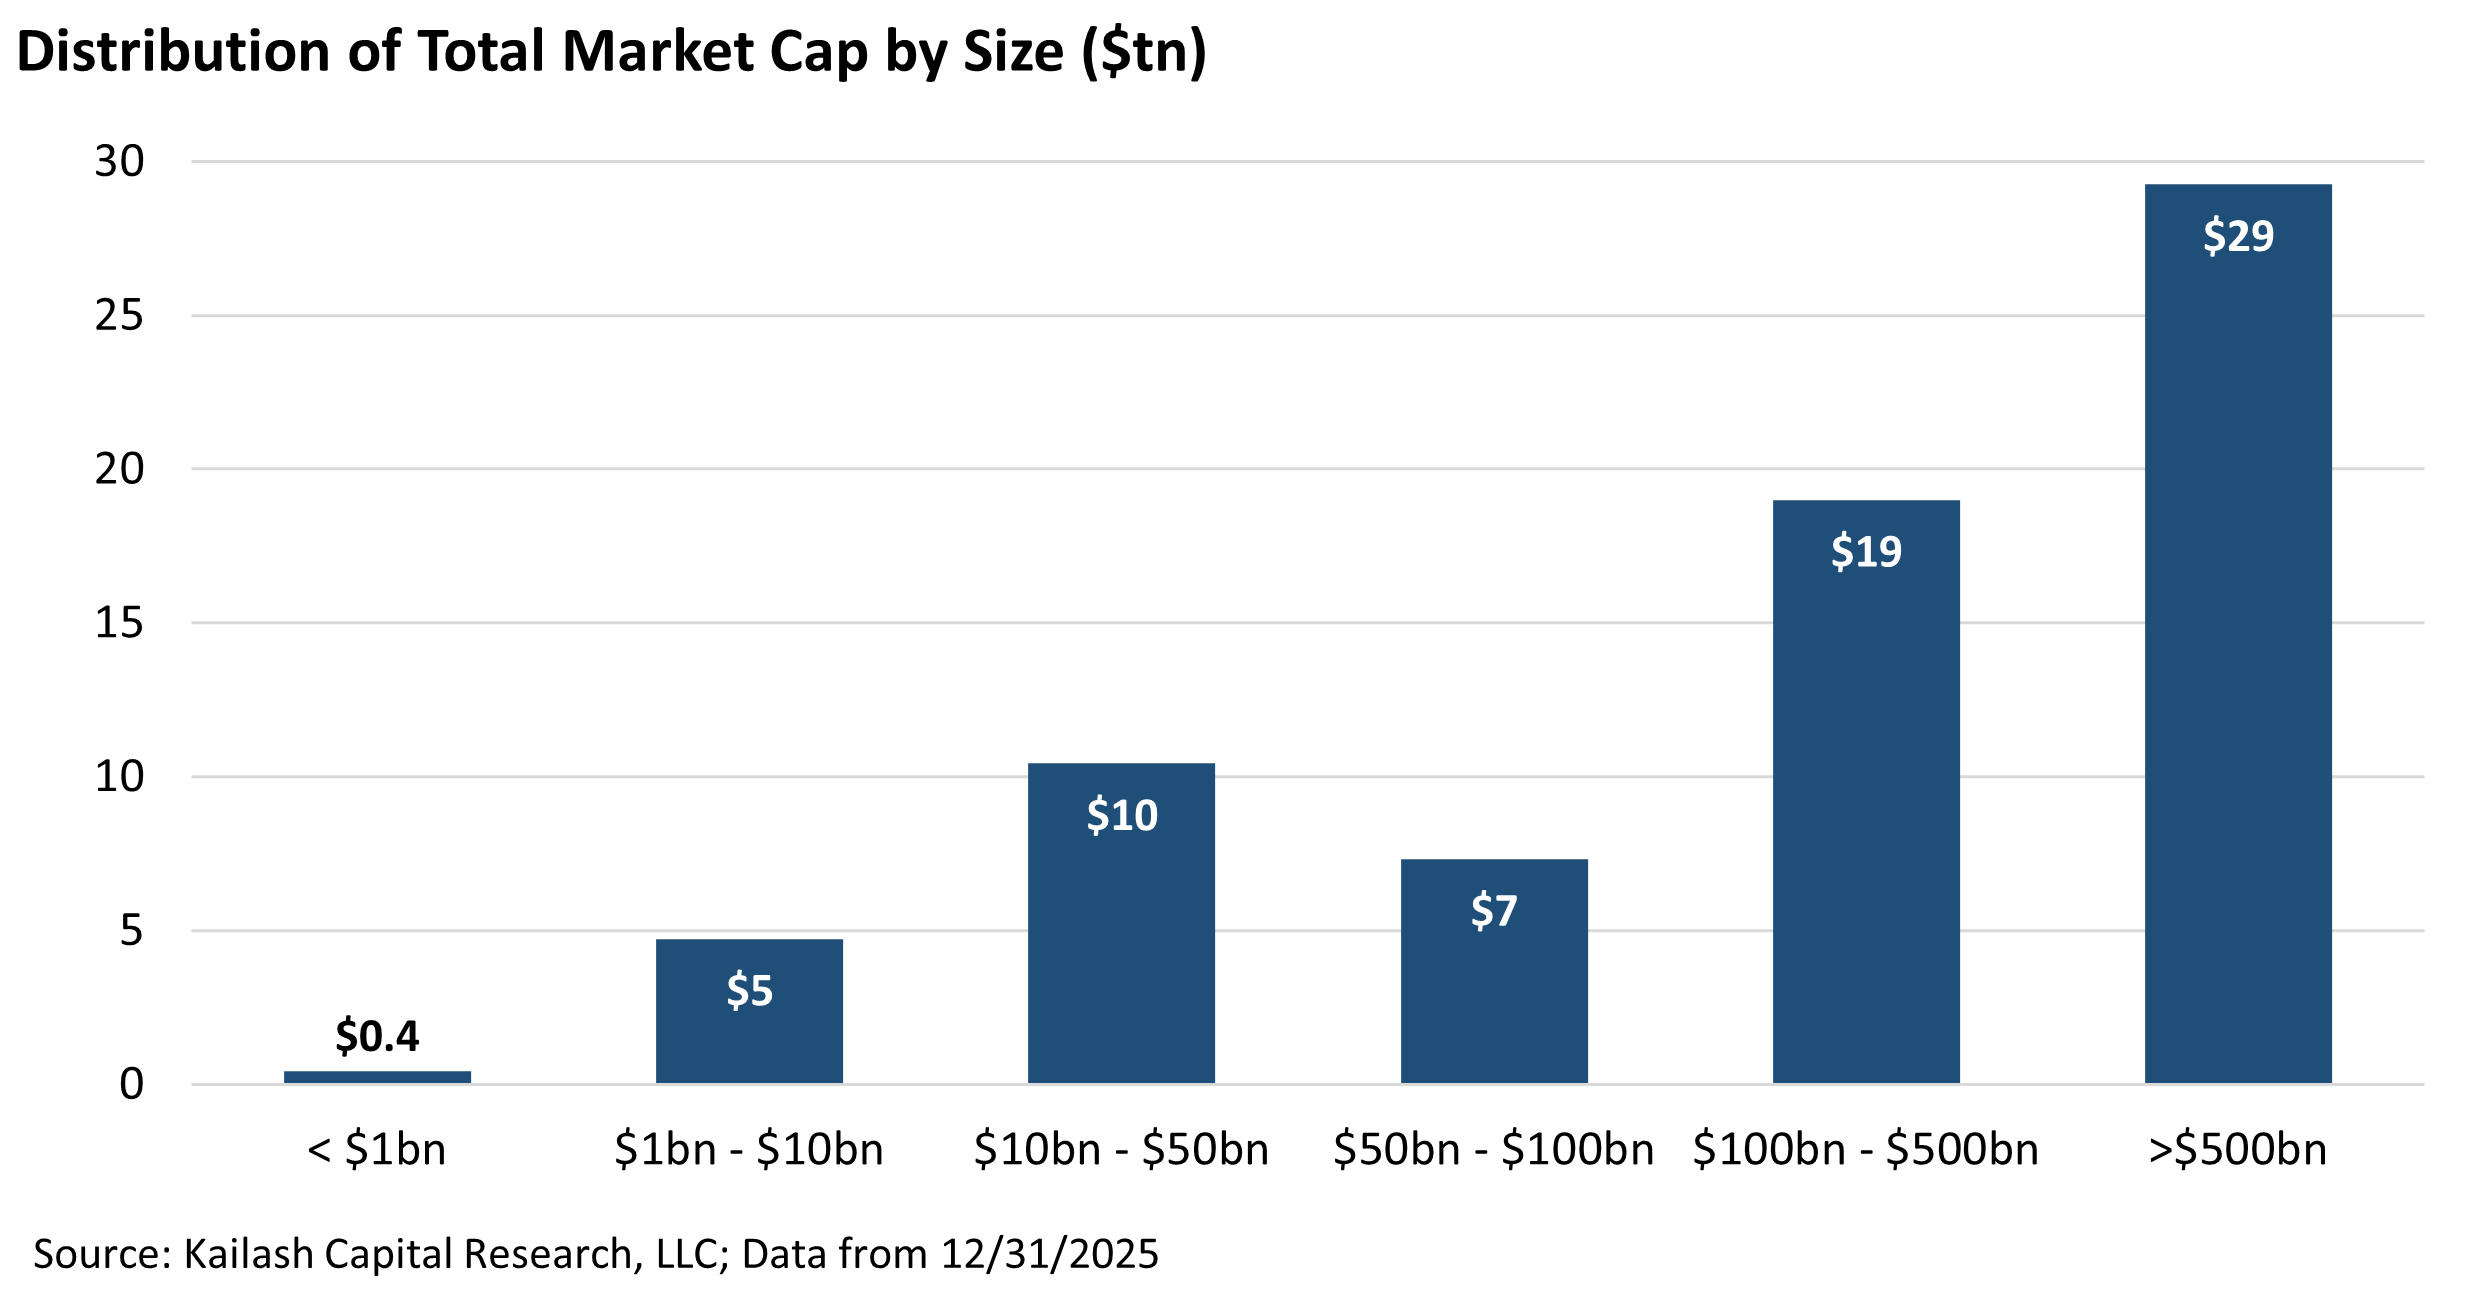
Chart 5: Distribution of Market Cap
- Despite being few in number, the largest firms hold the majority of U.S. market capitalization.
- Companies >$500B represent ~$29T in market value.
- Firms <$10B total only ~$5.4T combined.
- The top two cohorts dominate aggregate capitalization.
Another paper we wrote last year updated an article we had published back in 2021, highlighting that stocks trading above 20x price-to-sales represent an extreme speculative cohort with historically poor outcomes. We emphasized that as of March 2025, the market had reflated into what we termed the first ever “double-bubble.”
- Since the 2021 publication, “>20x sales” stocks have exhibited a highly skewed payoff profile: 14% winners versus 86% losers with severe average relative drawdowns.
- Our point then was that there is no historical precedent for successful long-term investing at >20x sales.
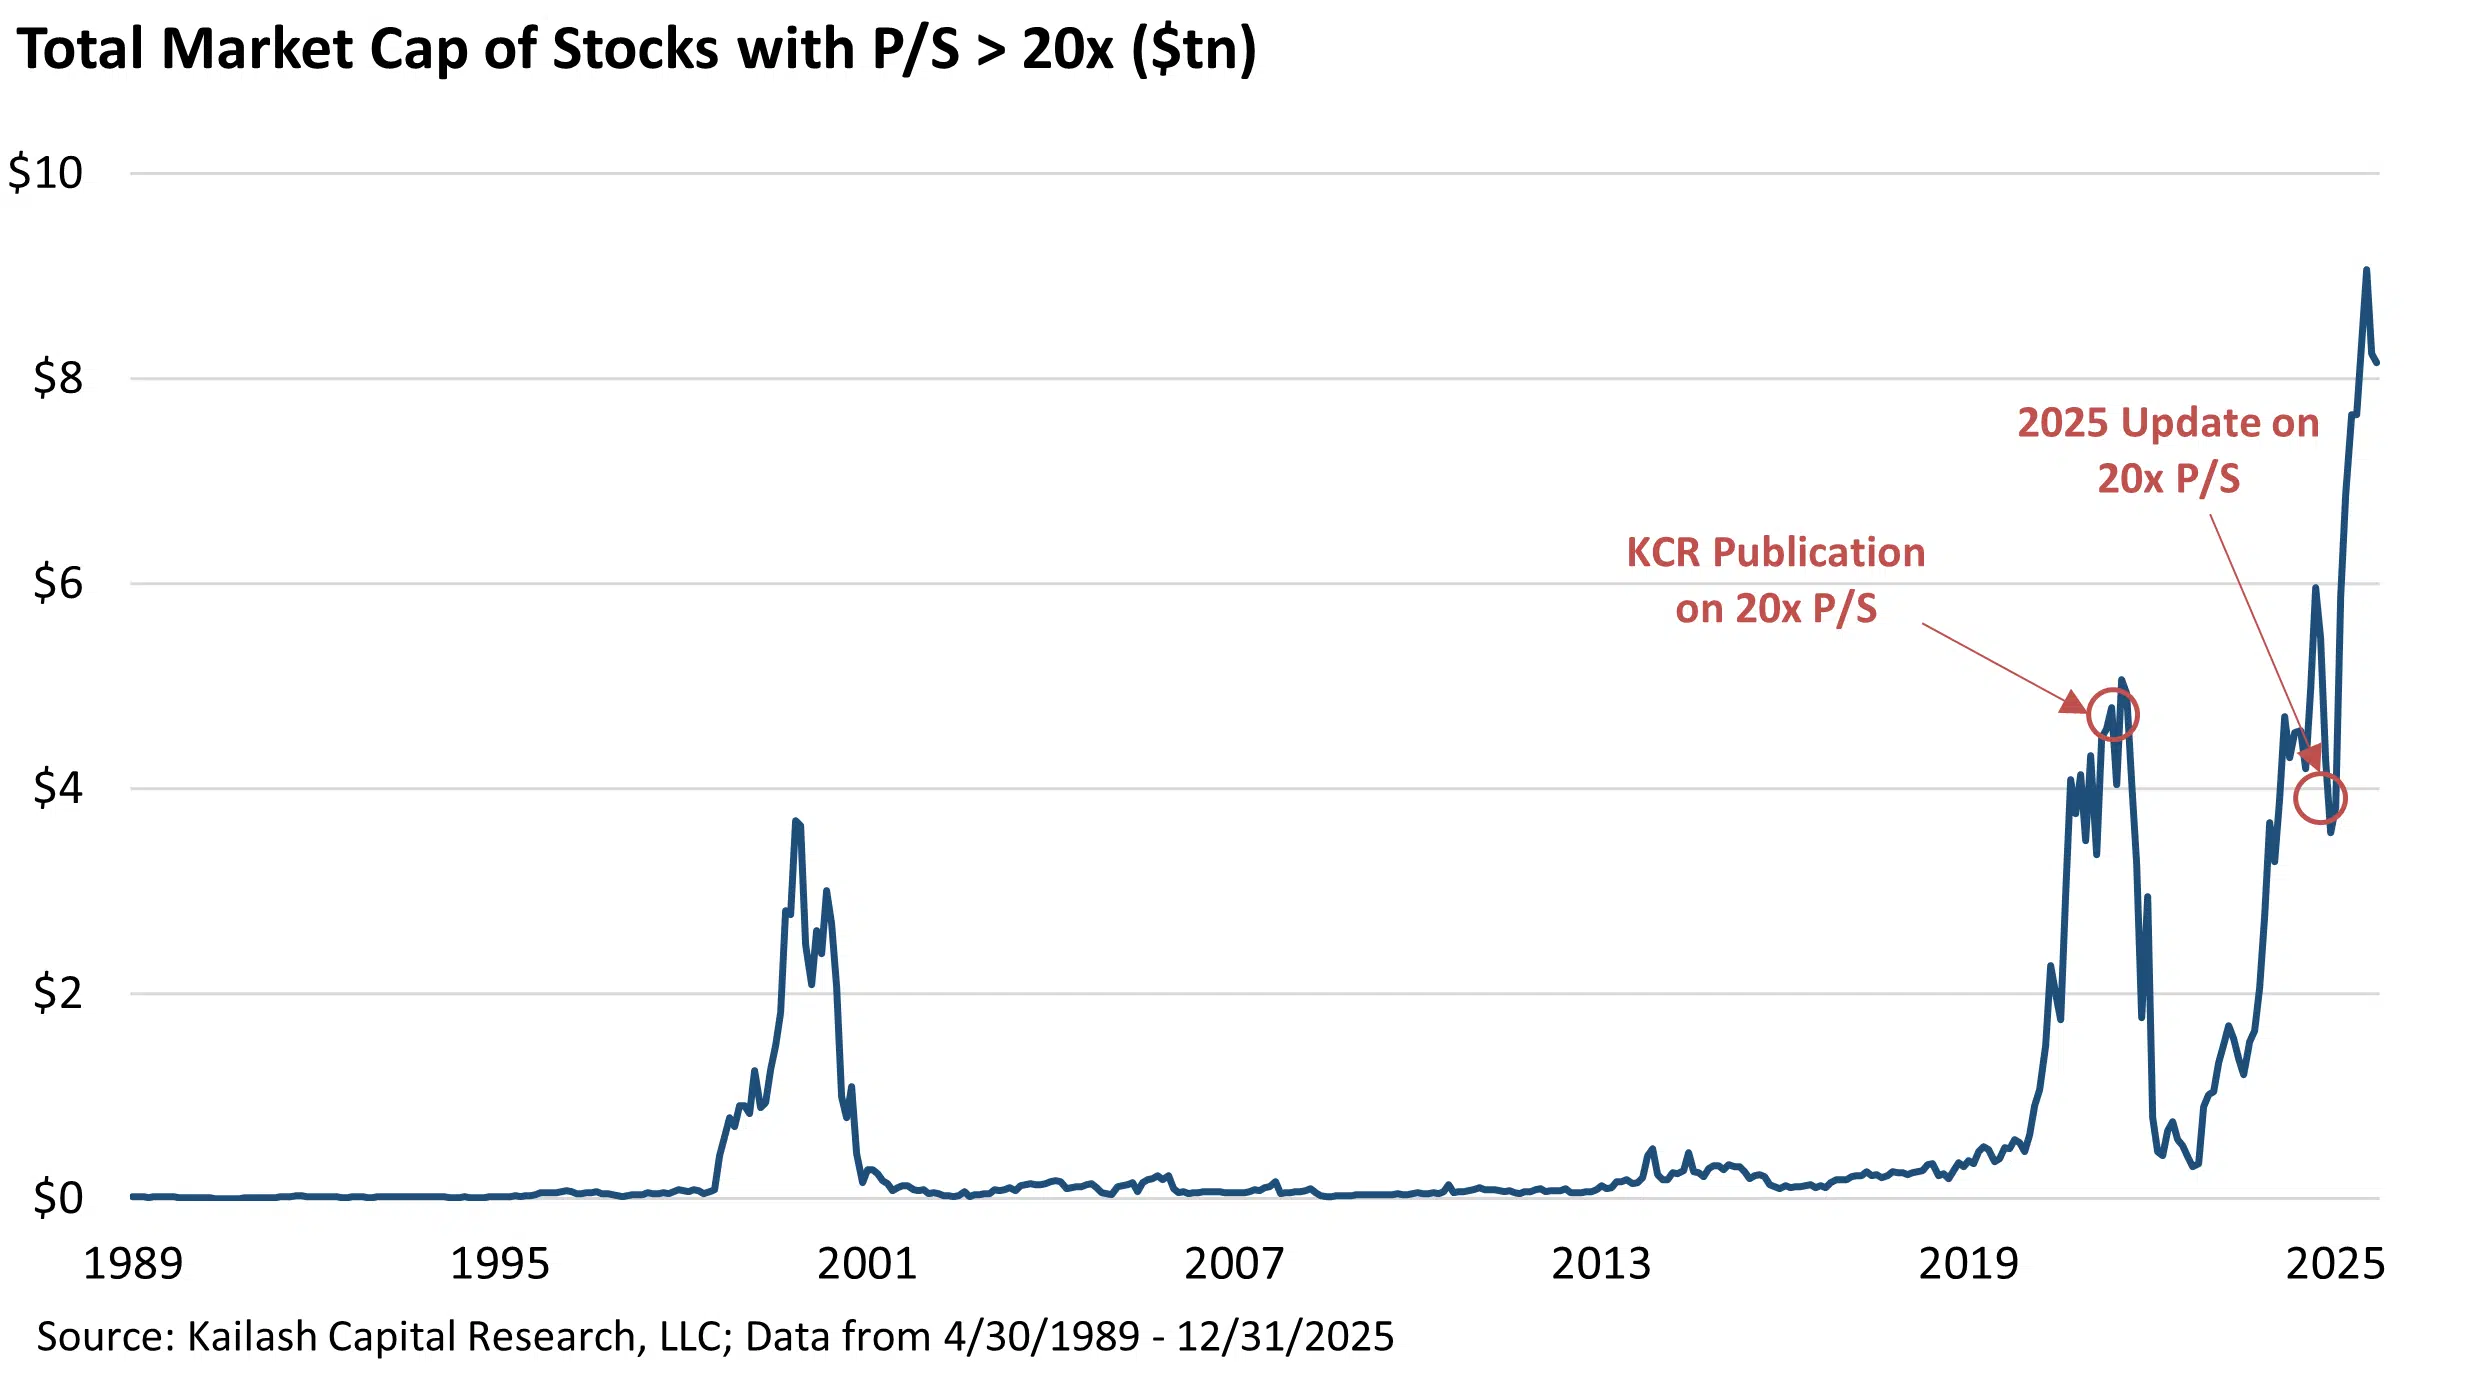
We have updated the most important chart in that paper below, showing that the total market capitalization of stocks trading above 20x price-to-sales have now blown through any and all historical precedents.
Chart 6: Market Cap of >20x P/S Stocks
- Stocks trading above 20x price-to-sales have reached a record $9T in market cap.
- This exceeds prior peaks in 2000 and 2021 by a wide margin.
- These stocks historically see poor outcomes post-peak.
To summarize: “we have never been here before, but the data is clear this will not end well for investors.”
In May of 2025 we wrote a withering piece on the valuation of Tech stocks (“IT”), delivering a clear warning that the U.S. tech sector has entered a speculative phase marked by extreme valuations reminiscent of the dot-com bubble. Despite legitimate earnings growth and technological innovation, we highlighted that investor sentiment has swung from rational to reckless, driven by envy and hype rather than fundamentals.
We updated the two most important charts in that paper, as shown below.
Chart 7: Tech Sector Market Cap vs. Sales
- Tech now exceeds 42% of market cap but under 15% of sales.
- The decoupling has accelerated sharply since 2023.
- Similar to the dot.com bubble but even bigger today than it was then.
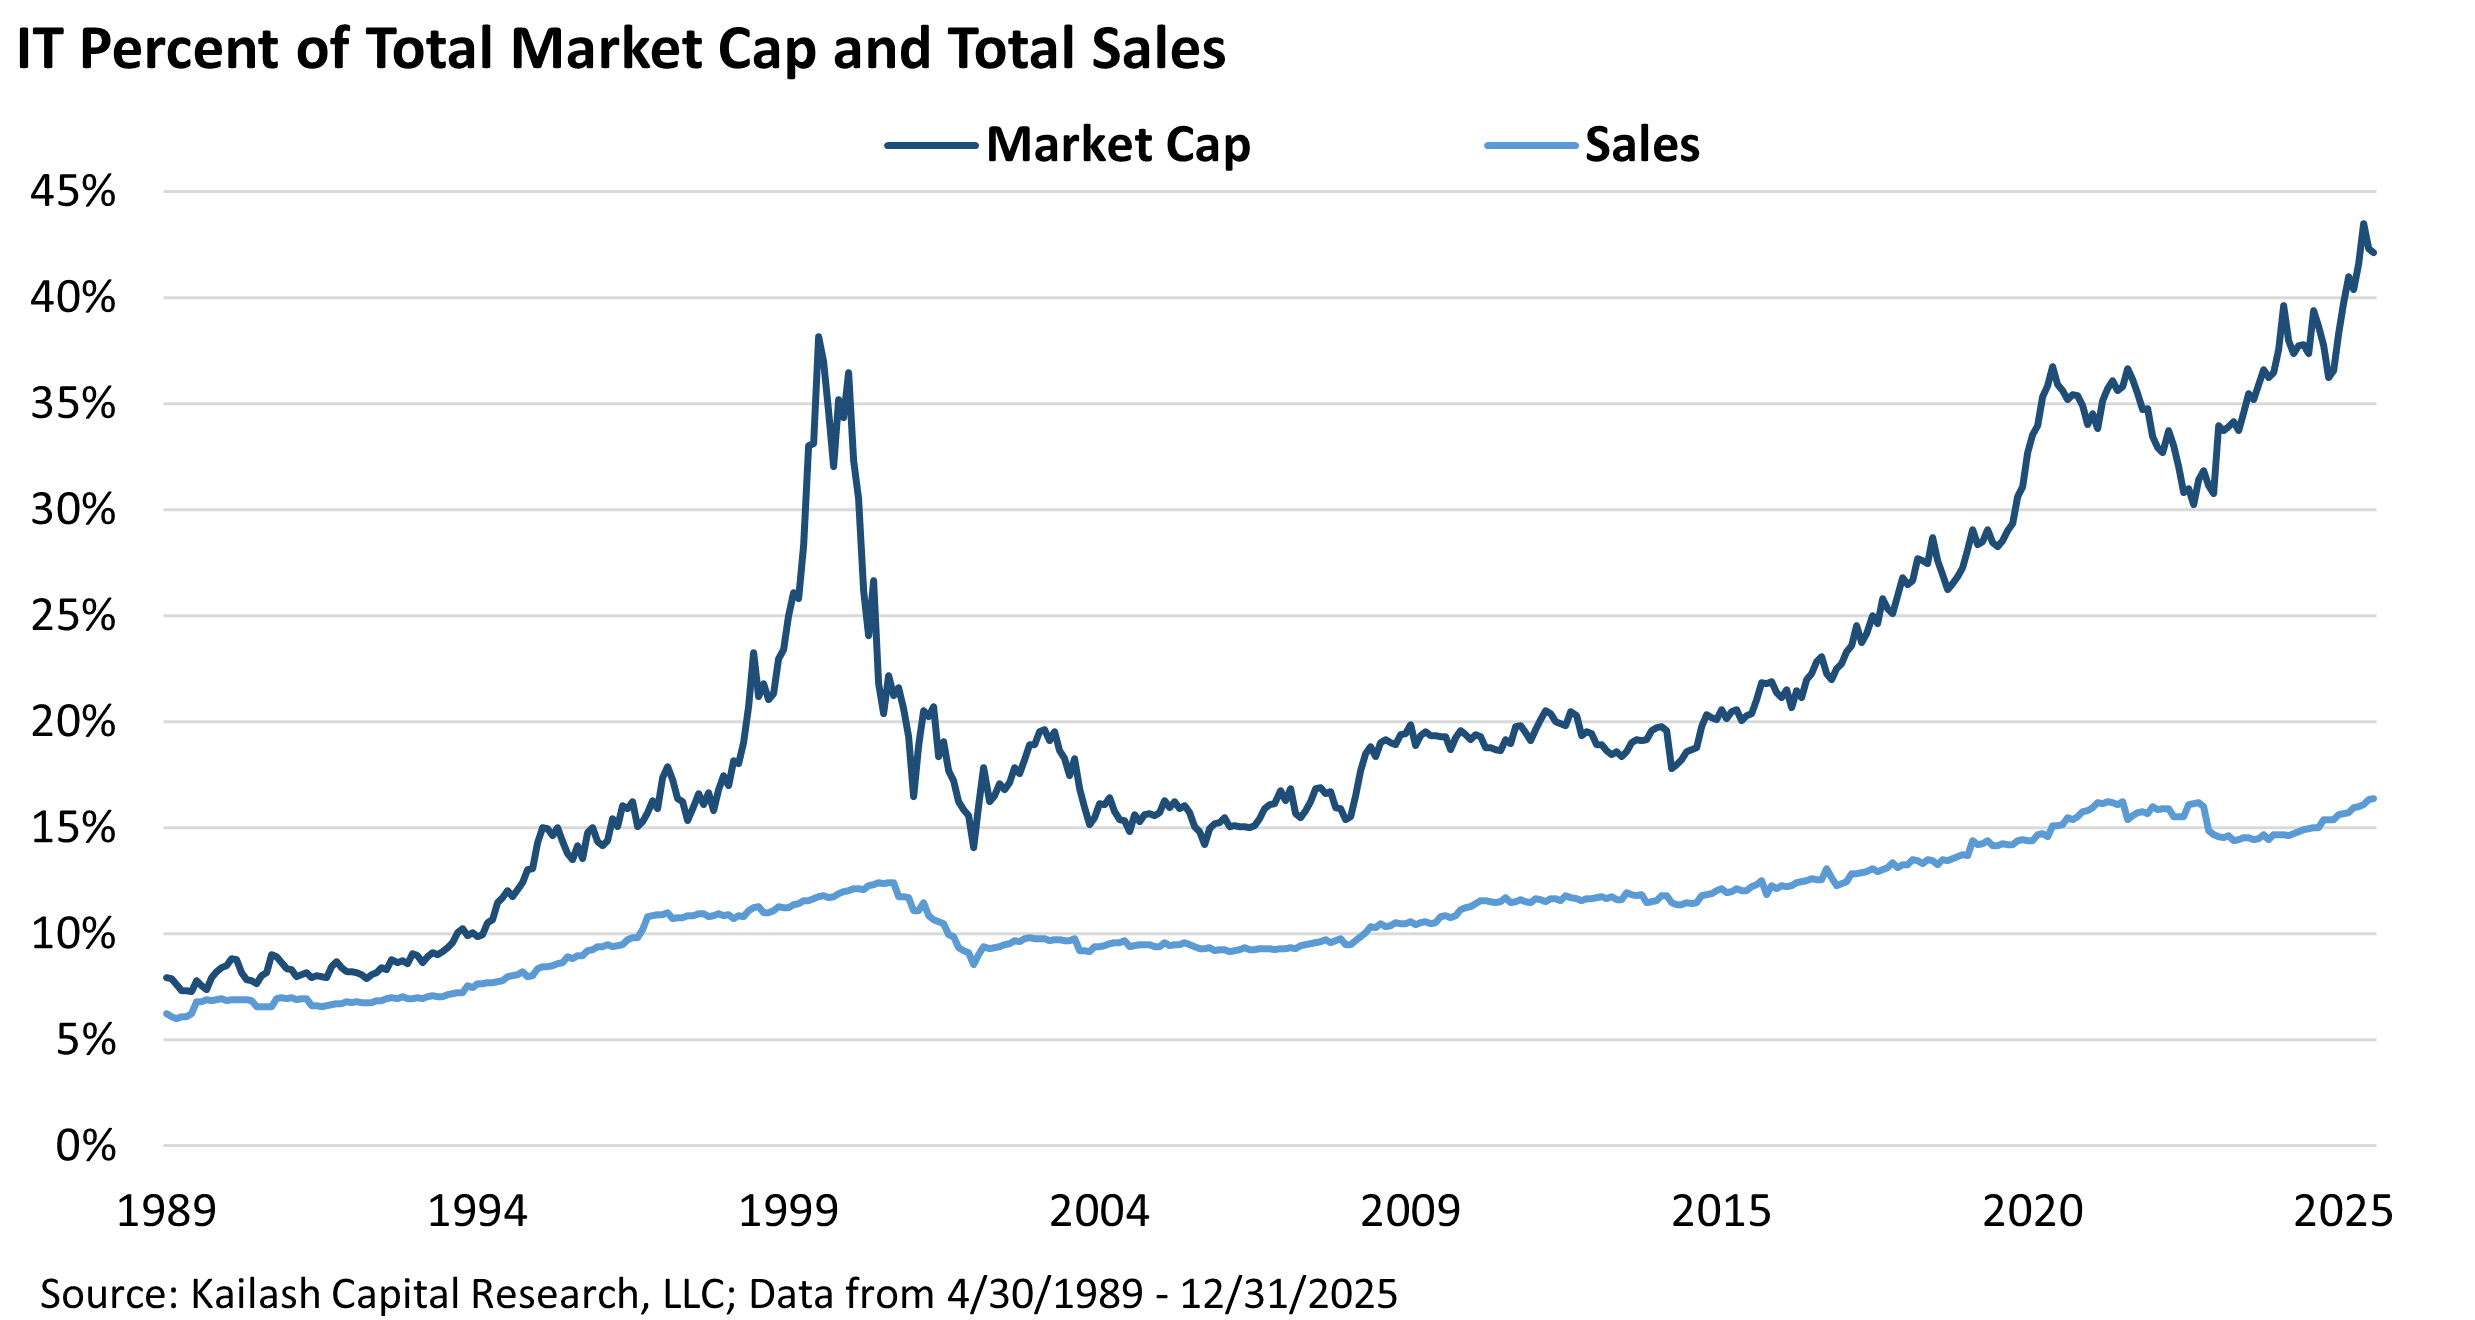
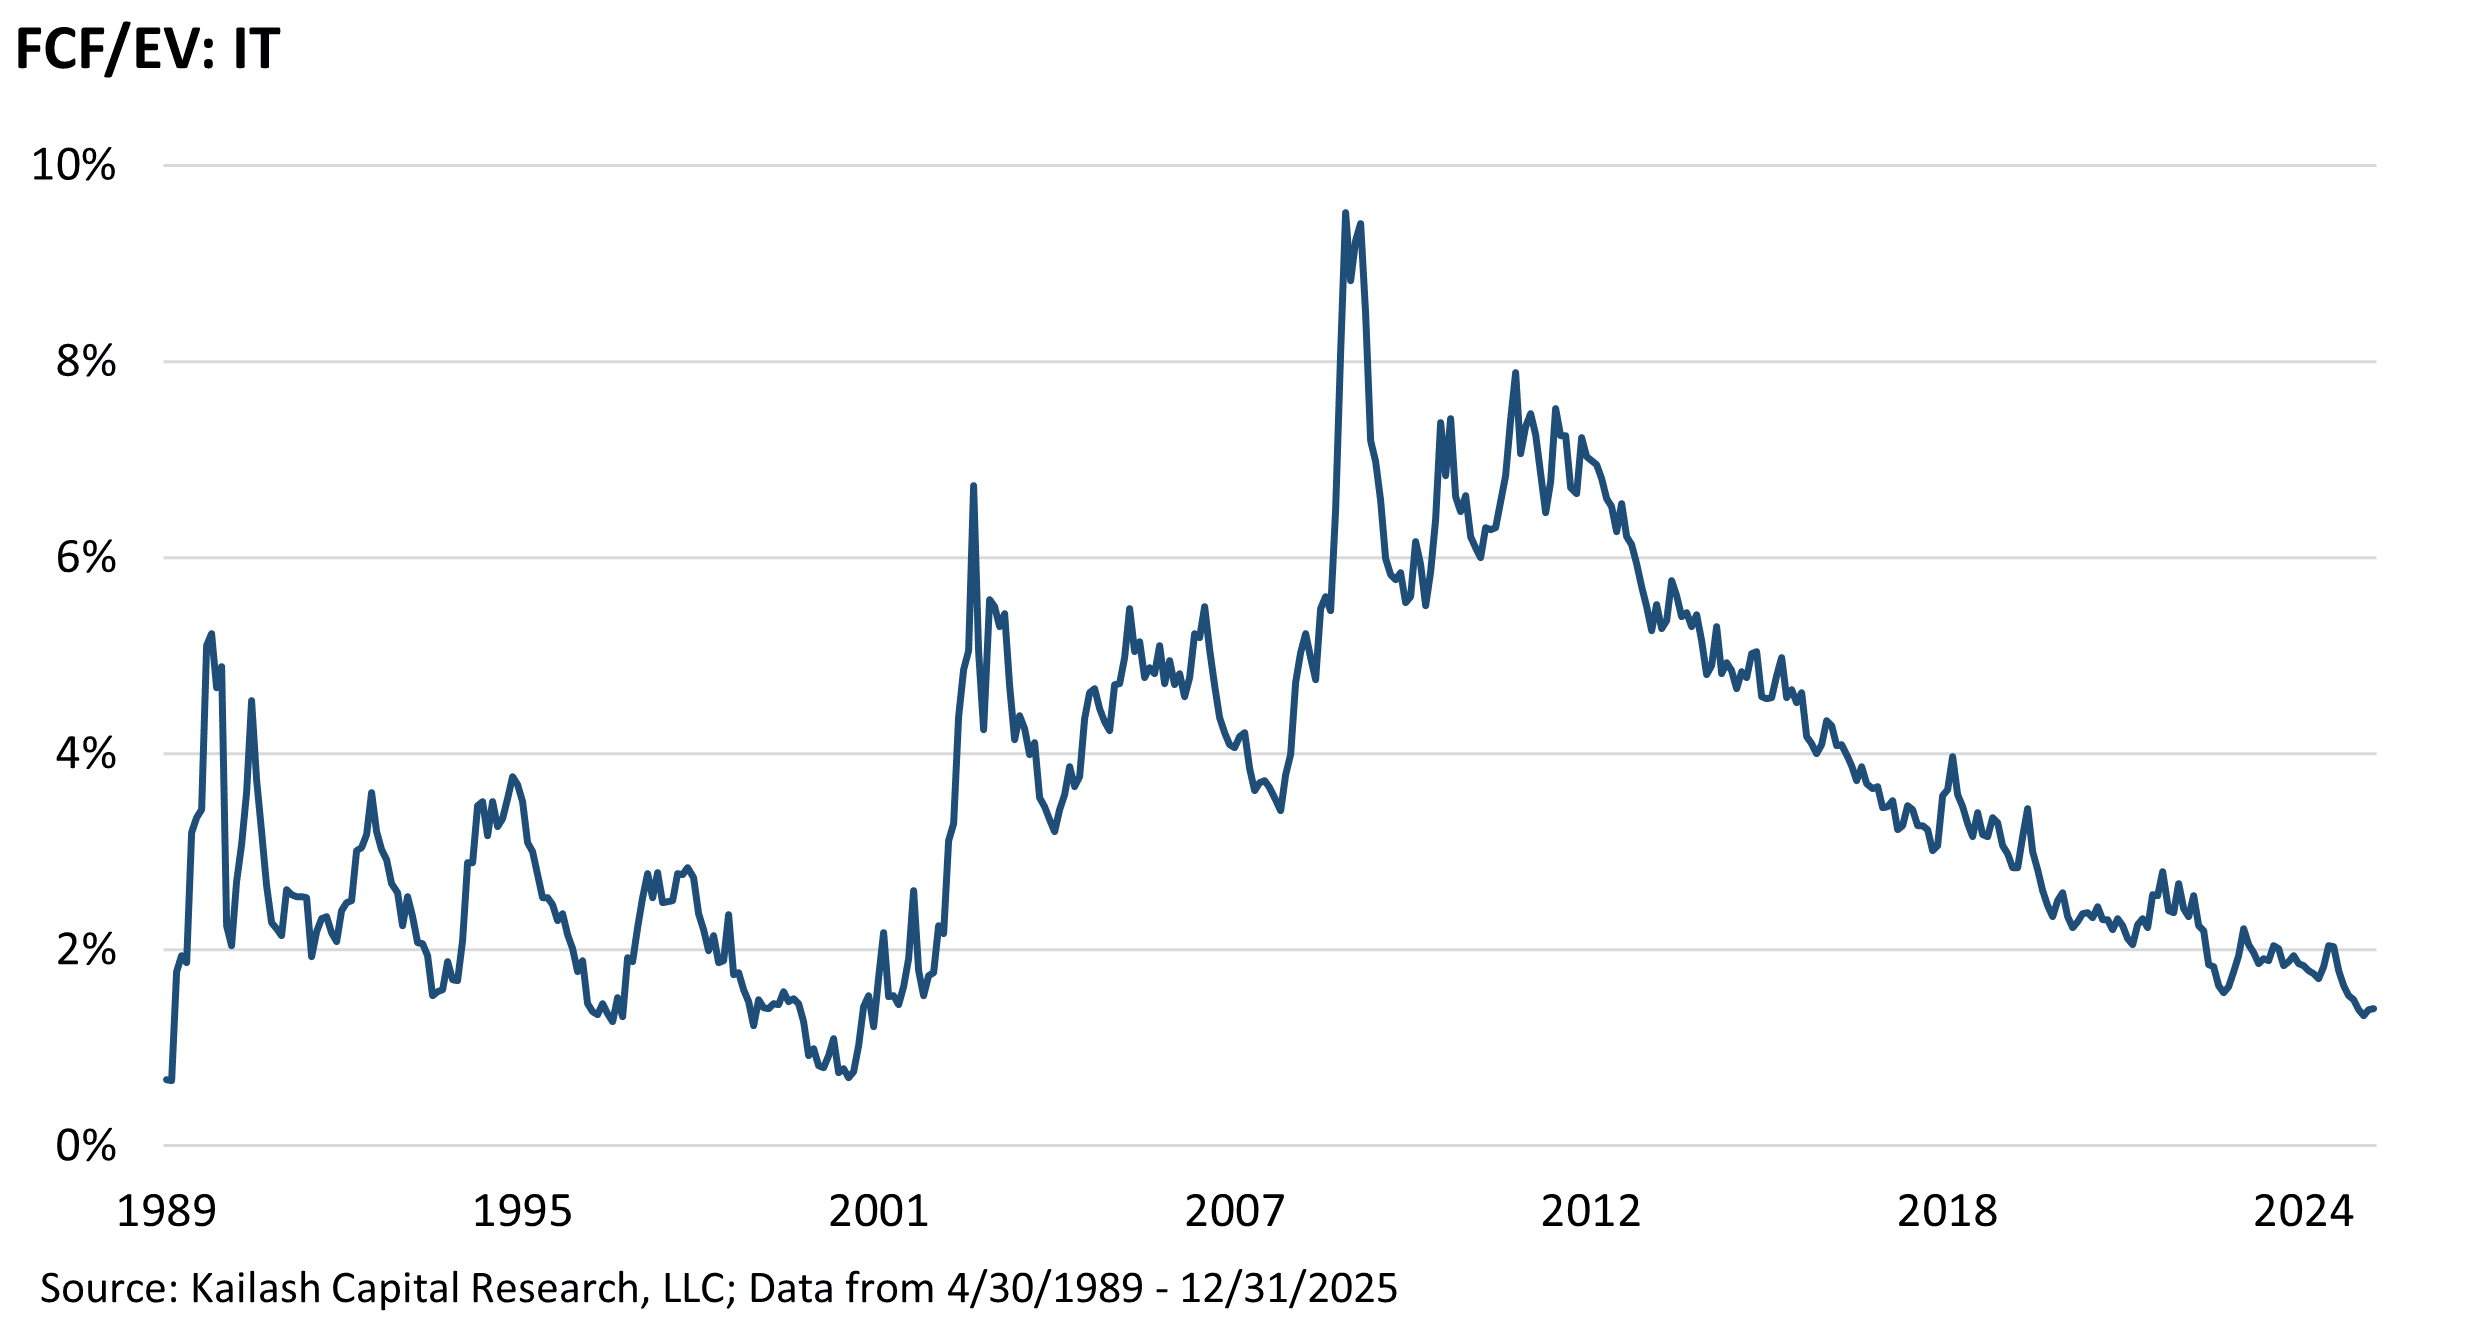
Chart 8: Tech Free Cash Flow to Enterprise Value
- Tech sector FCF/EV has collapsed to ~1%, near the lowest level in 35+ years.
- 100x FCF leaves investors vulnerable to geopolitical, industry, and other exogenous shocks
Last year we made the case for healthcare stocks. The data showed the sector’s underperformance was being driven by investor uncertainty amid political, regulatory, and reimbursement risks. In mid-2025, the healthcare sector was trading at a ~50% discount to the S&P 500 despite higher ROEs and a stronger yield profile.
Chart 9: Healthcare Sector Weight in S&P 500
- Healthcare’s share of the S&P 500 has dropped to a 40-year low, below 9%.
- Similar troughs have preceded strong sector outperformance.

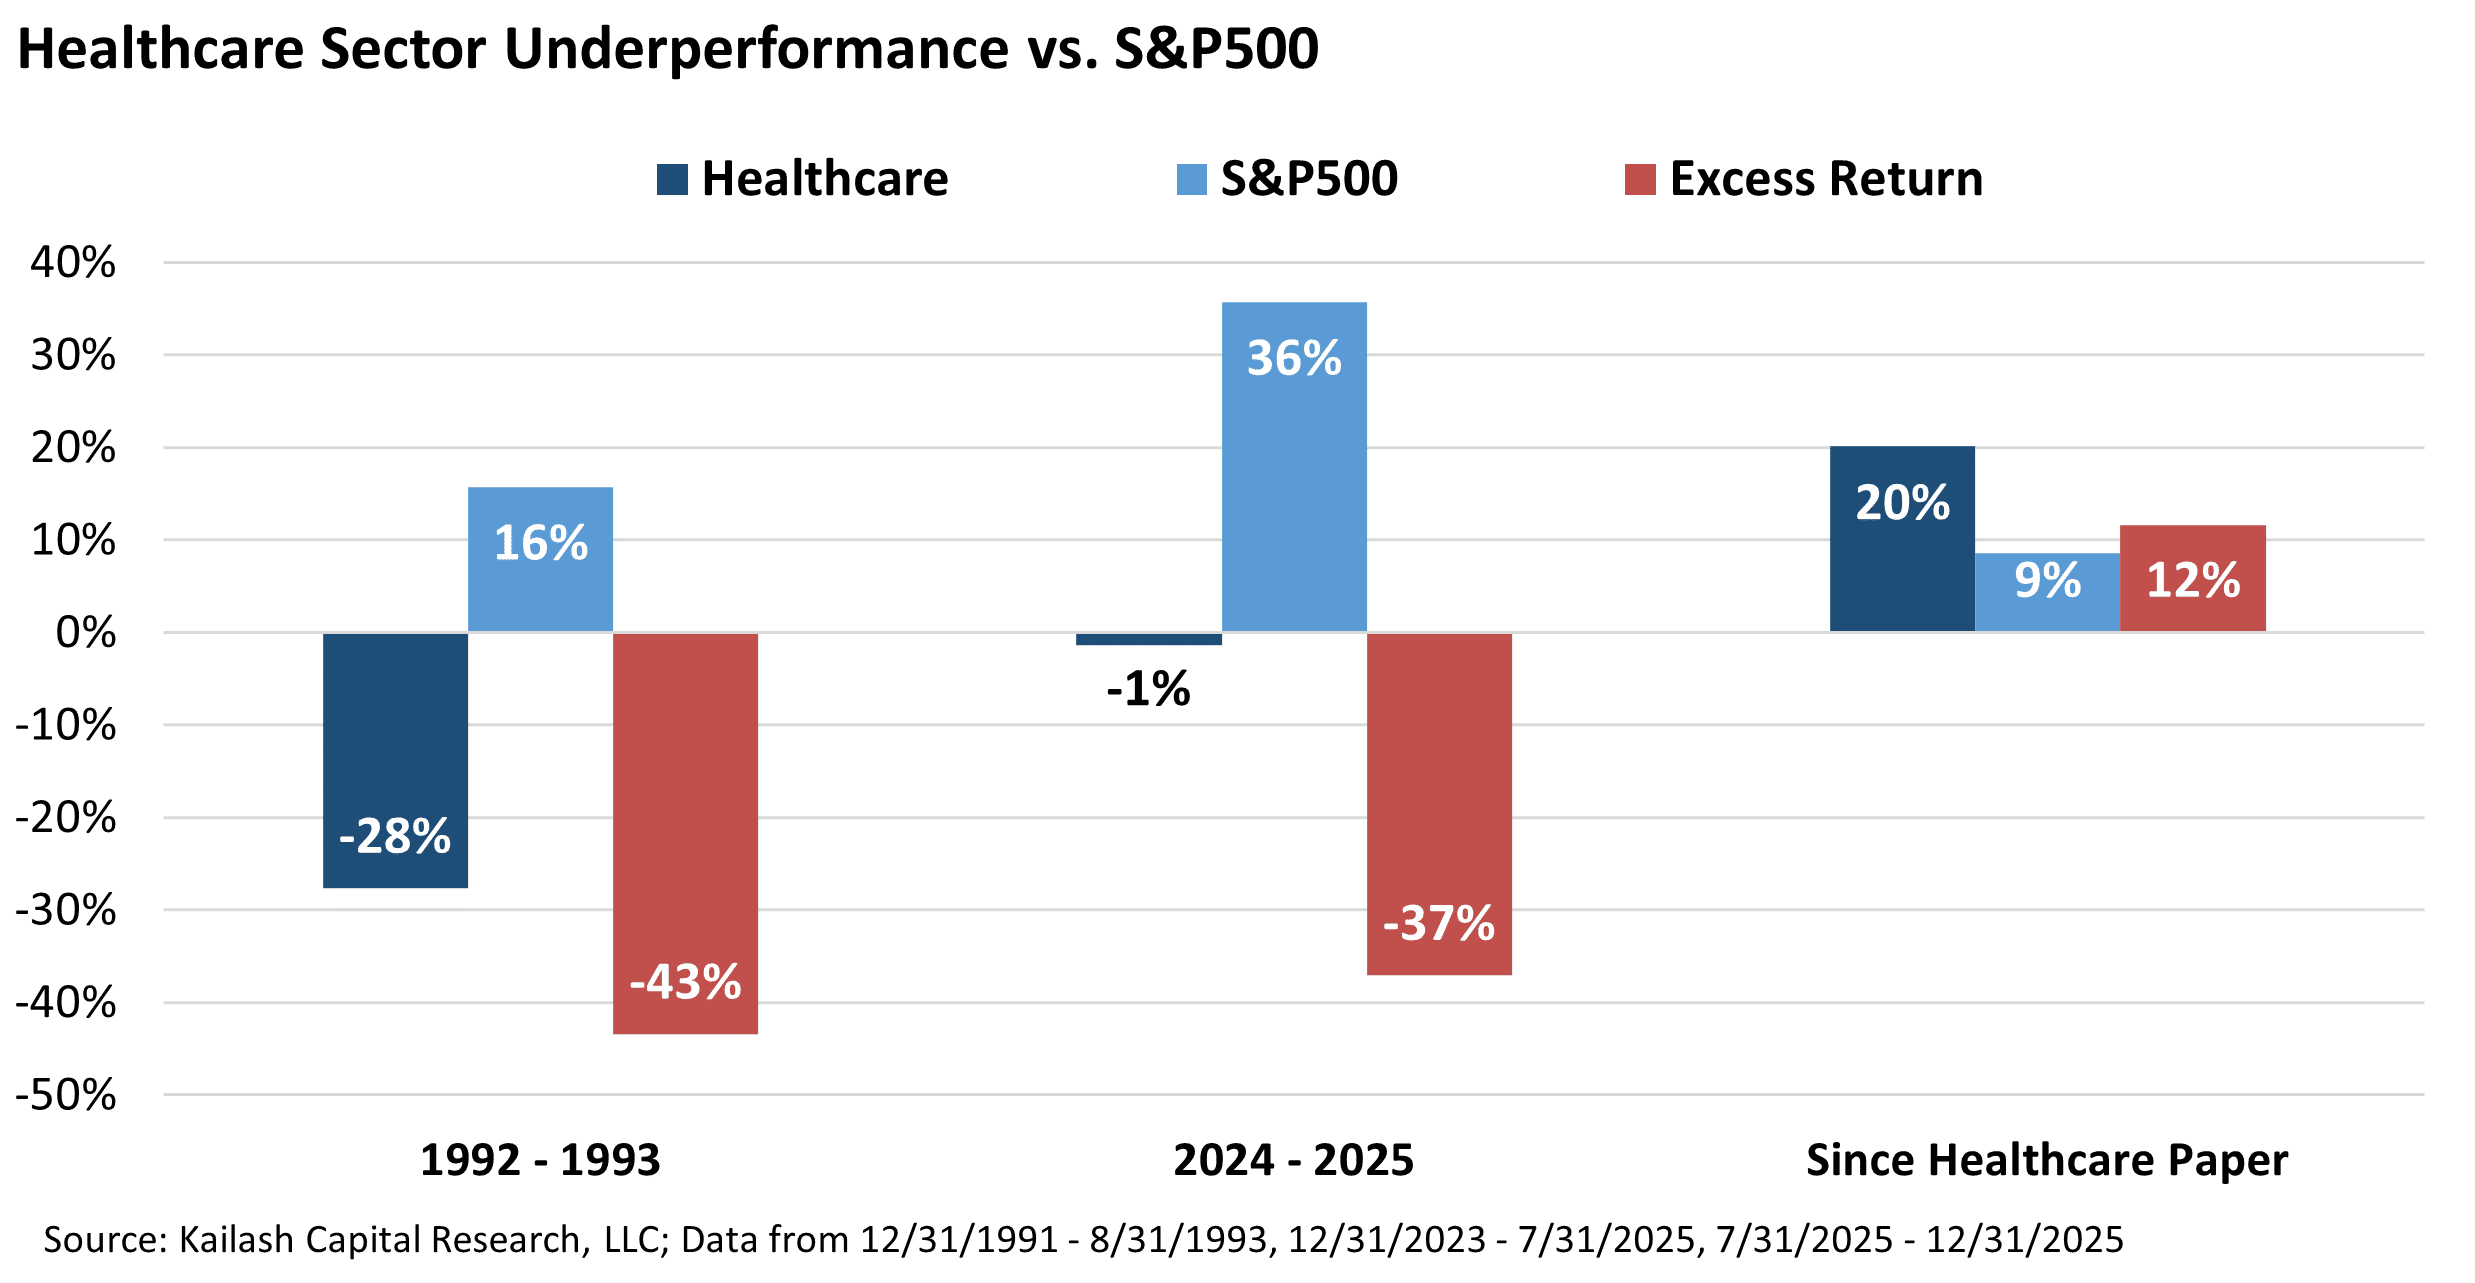
Chart 10: Healthcare Underperformance vs. S&P 500
Healthcare underperformed the S&P 500 by 37% before rebounding in late 2025.
- Mirrors a similar pattern during the Clinton 1992–1993 reform scare.
- Since mid-2025, the sector has outperformed by 12%.
- Suggests sentiment may be turning toward undervalued healthcare stocks.
In one of KCR’s most popular papers we examined how low quality junk stocks were on a tear vs. their respective benchmarks. Updating the three key charts from that paper, as shown below, was eye-opening.
Chart 11: Low Quality vs. Benchmark (2025)
- Low-quality small-cap stocks vastly outperformed their benchmarks in 2025.
- Russell 2000 Value low-quality names returned 46.4% vs. 12.6% for the index.
- Similar 20-point outperformance in Core and Growth segments.
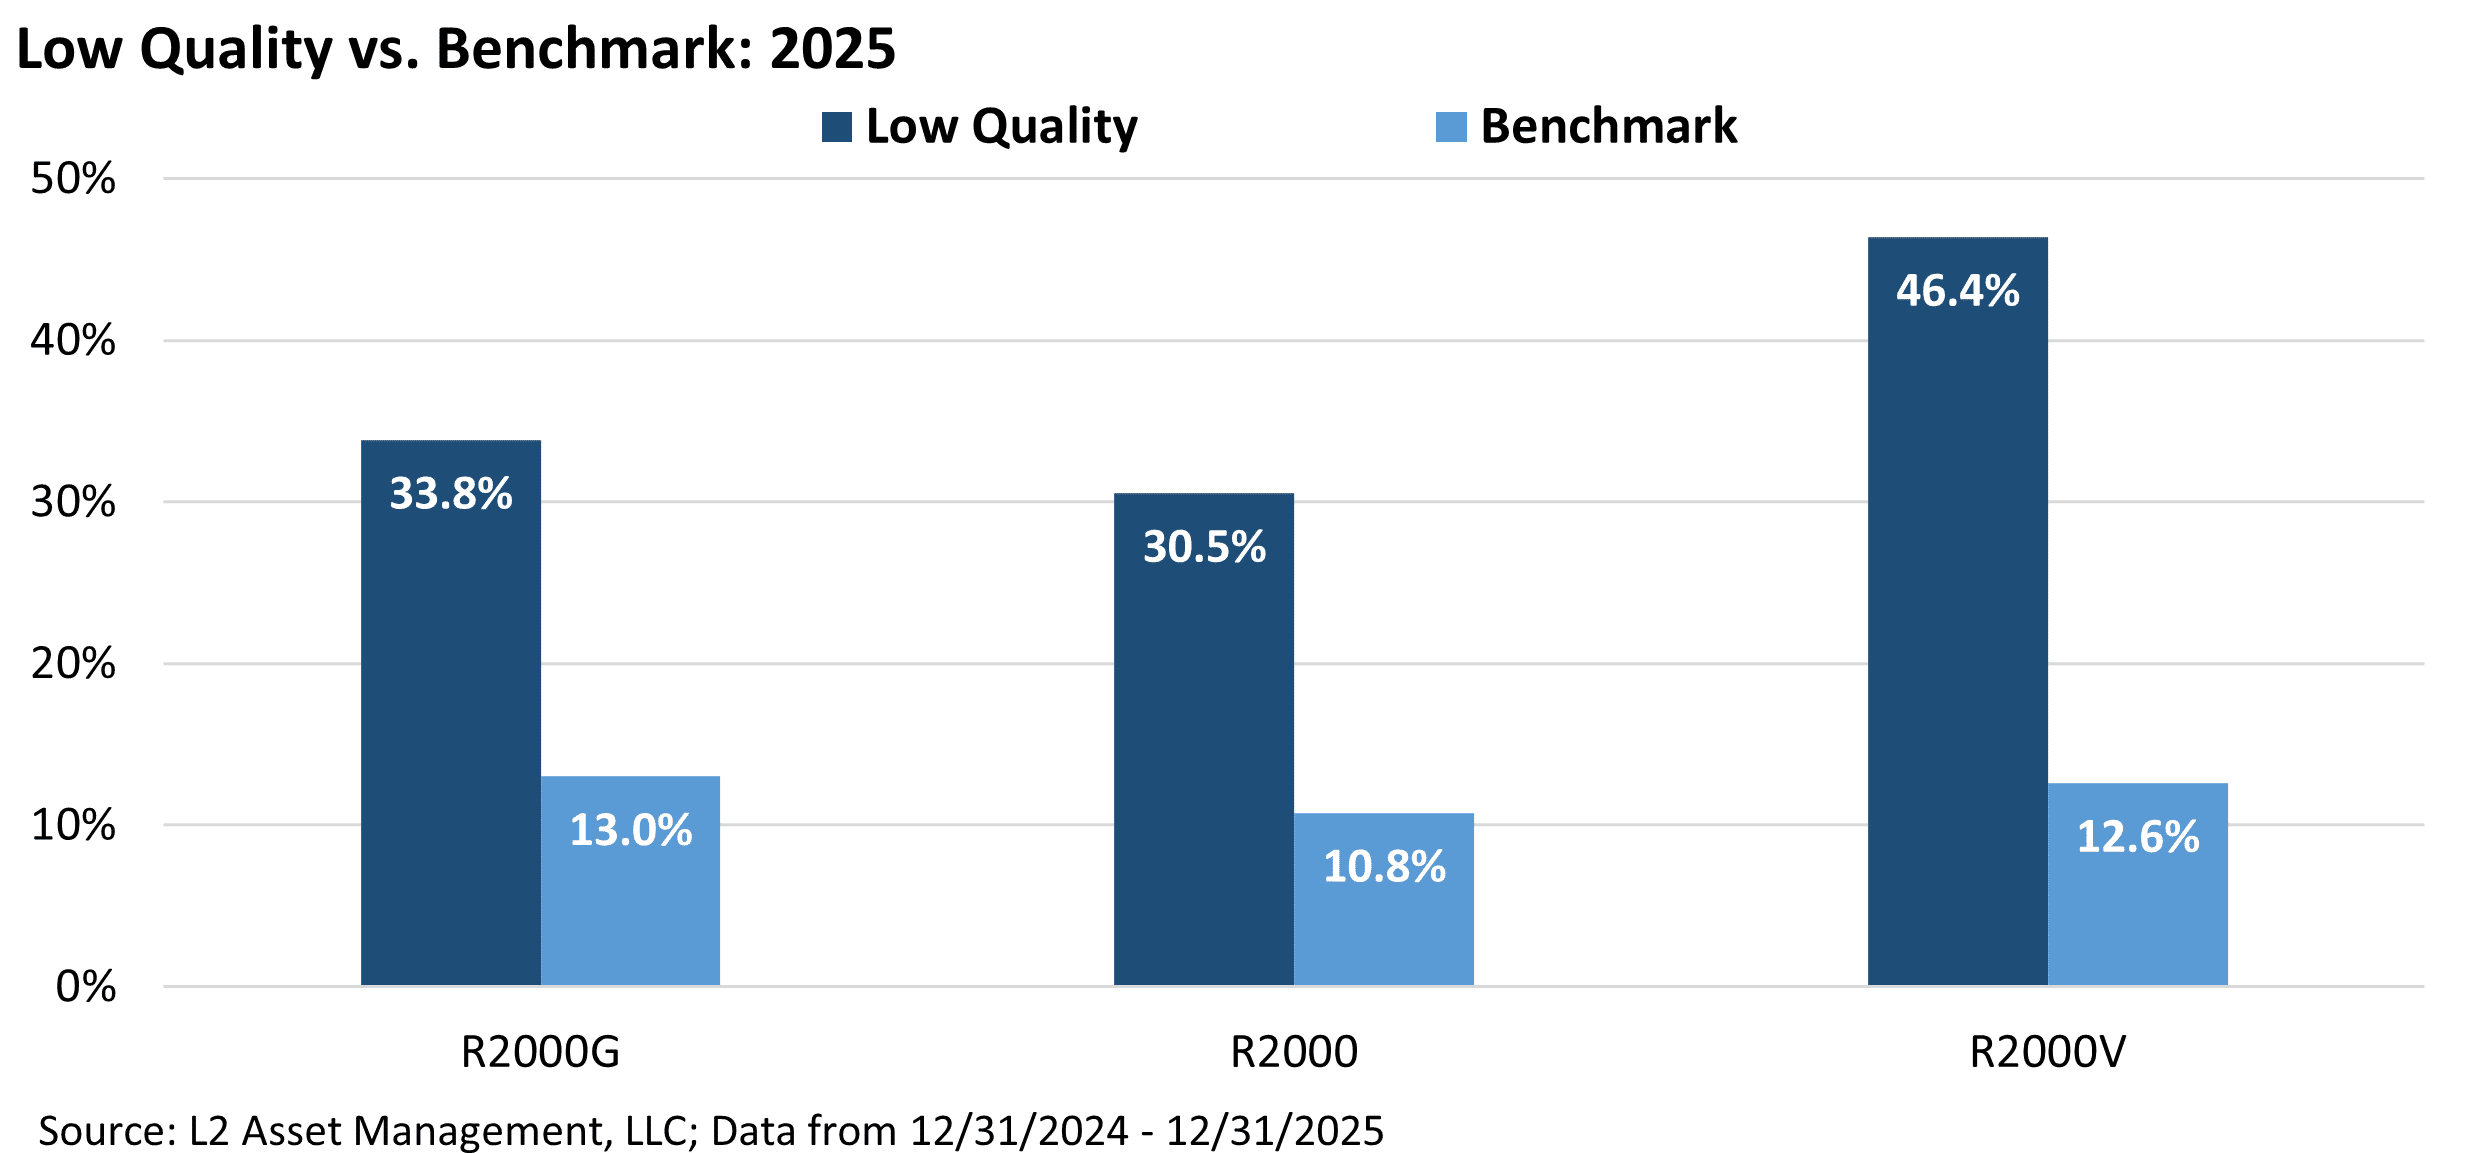
Chart 12: Long-Term Returns – Low Quality LOSES to the Benchmark Over the Long Haul
- Low-quality stocks have underperformed over the long term.
- R2000 Growth: 5.8% vs. 10.2% annual return over 36 years.
- Similar underperformance in Core and Value segments.
Low Quality vs. Benchmark: Average Annual Return
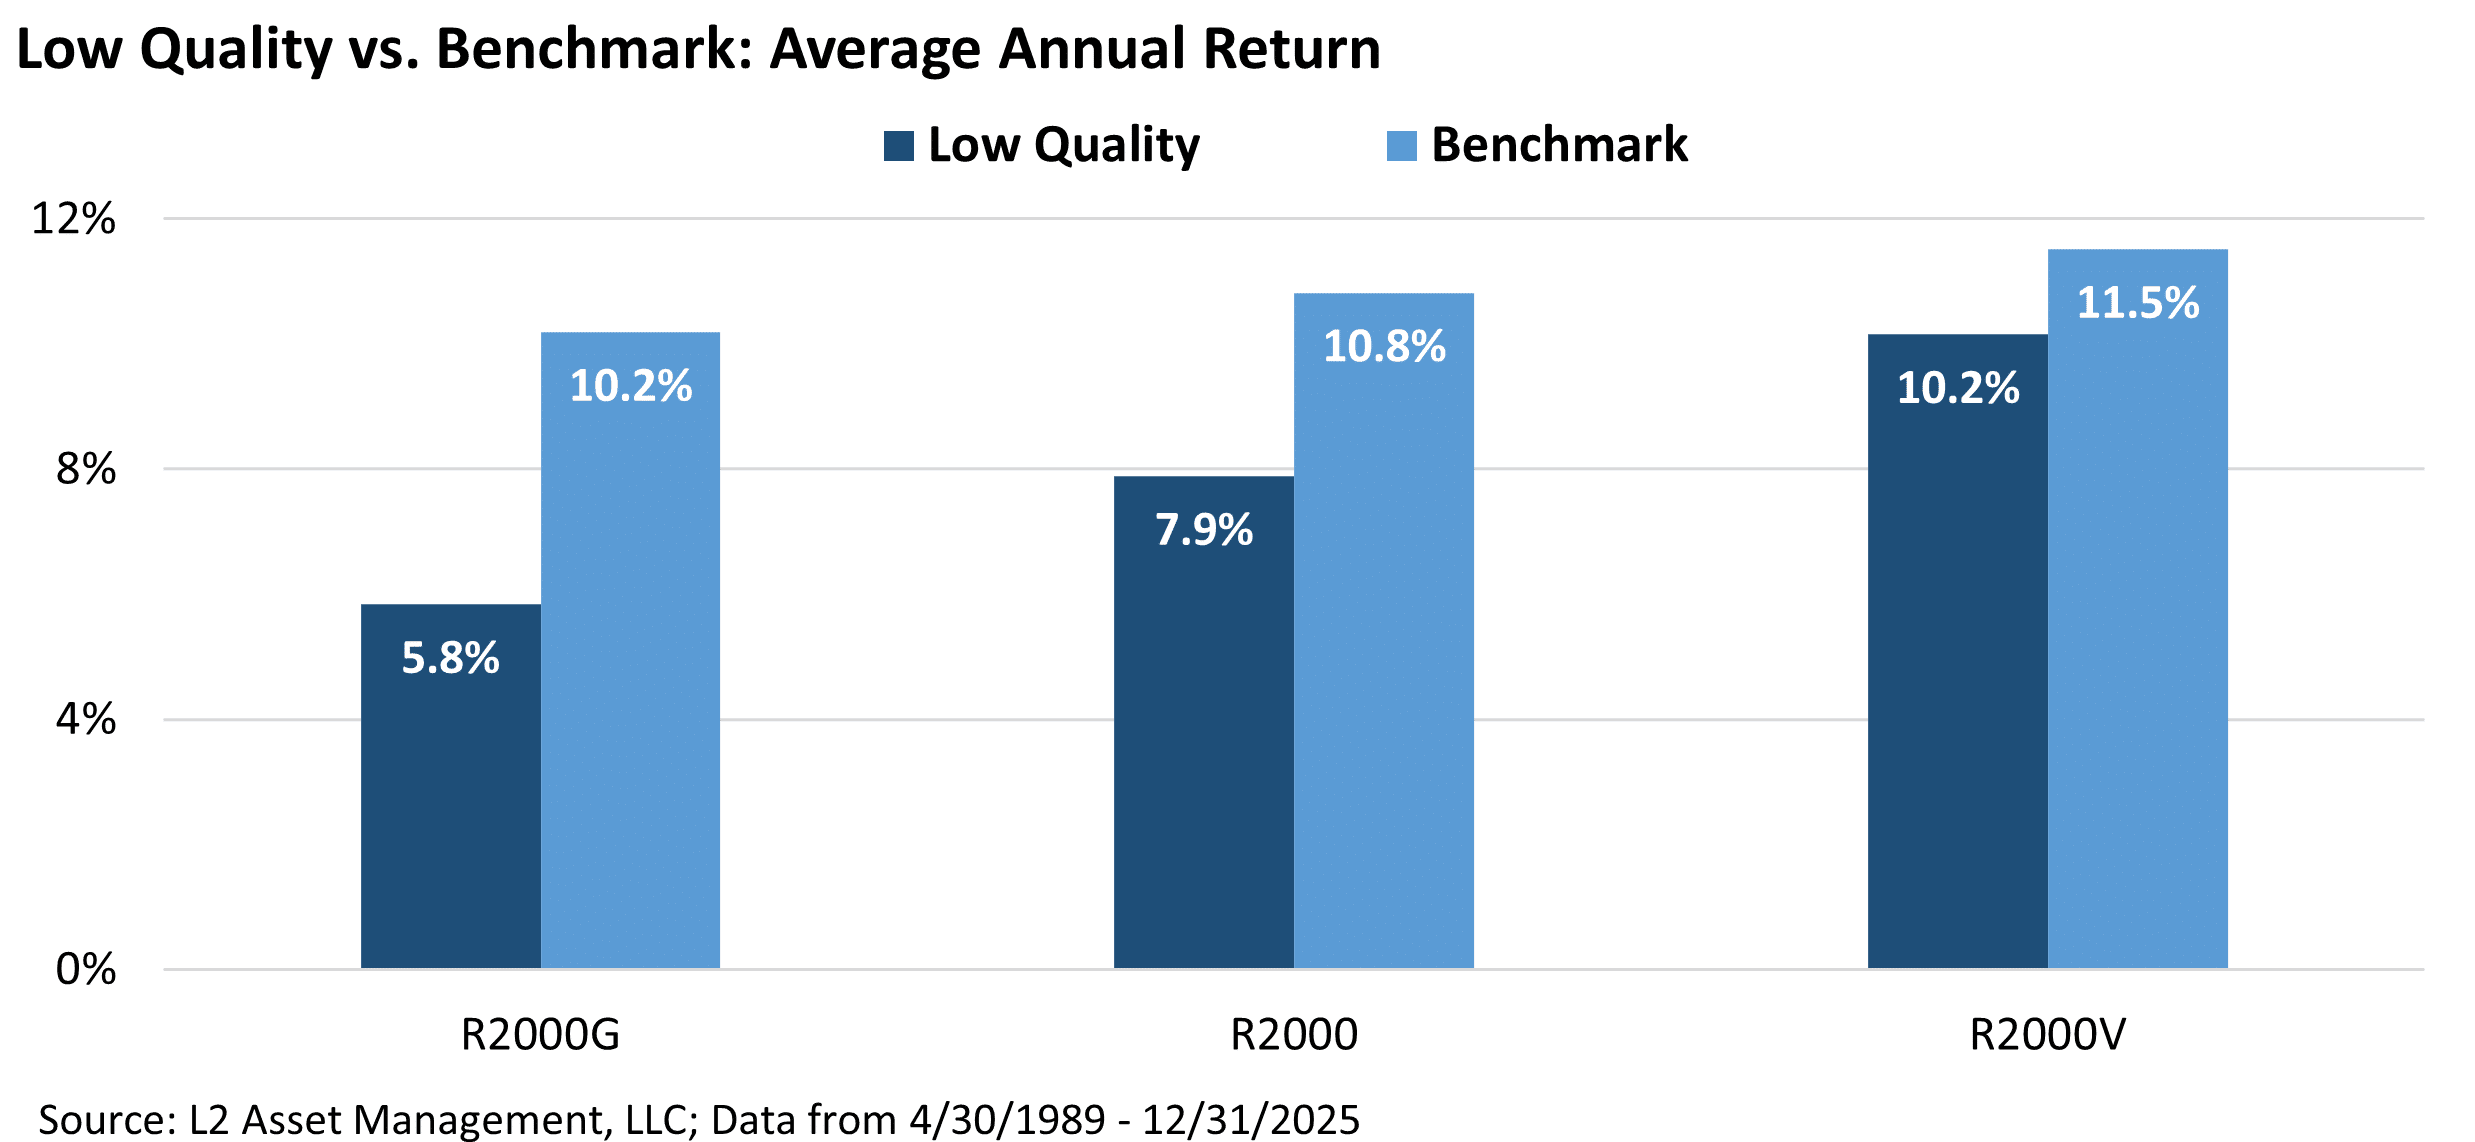
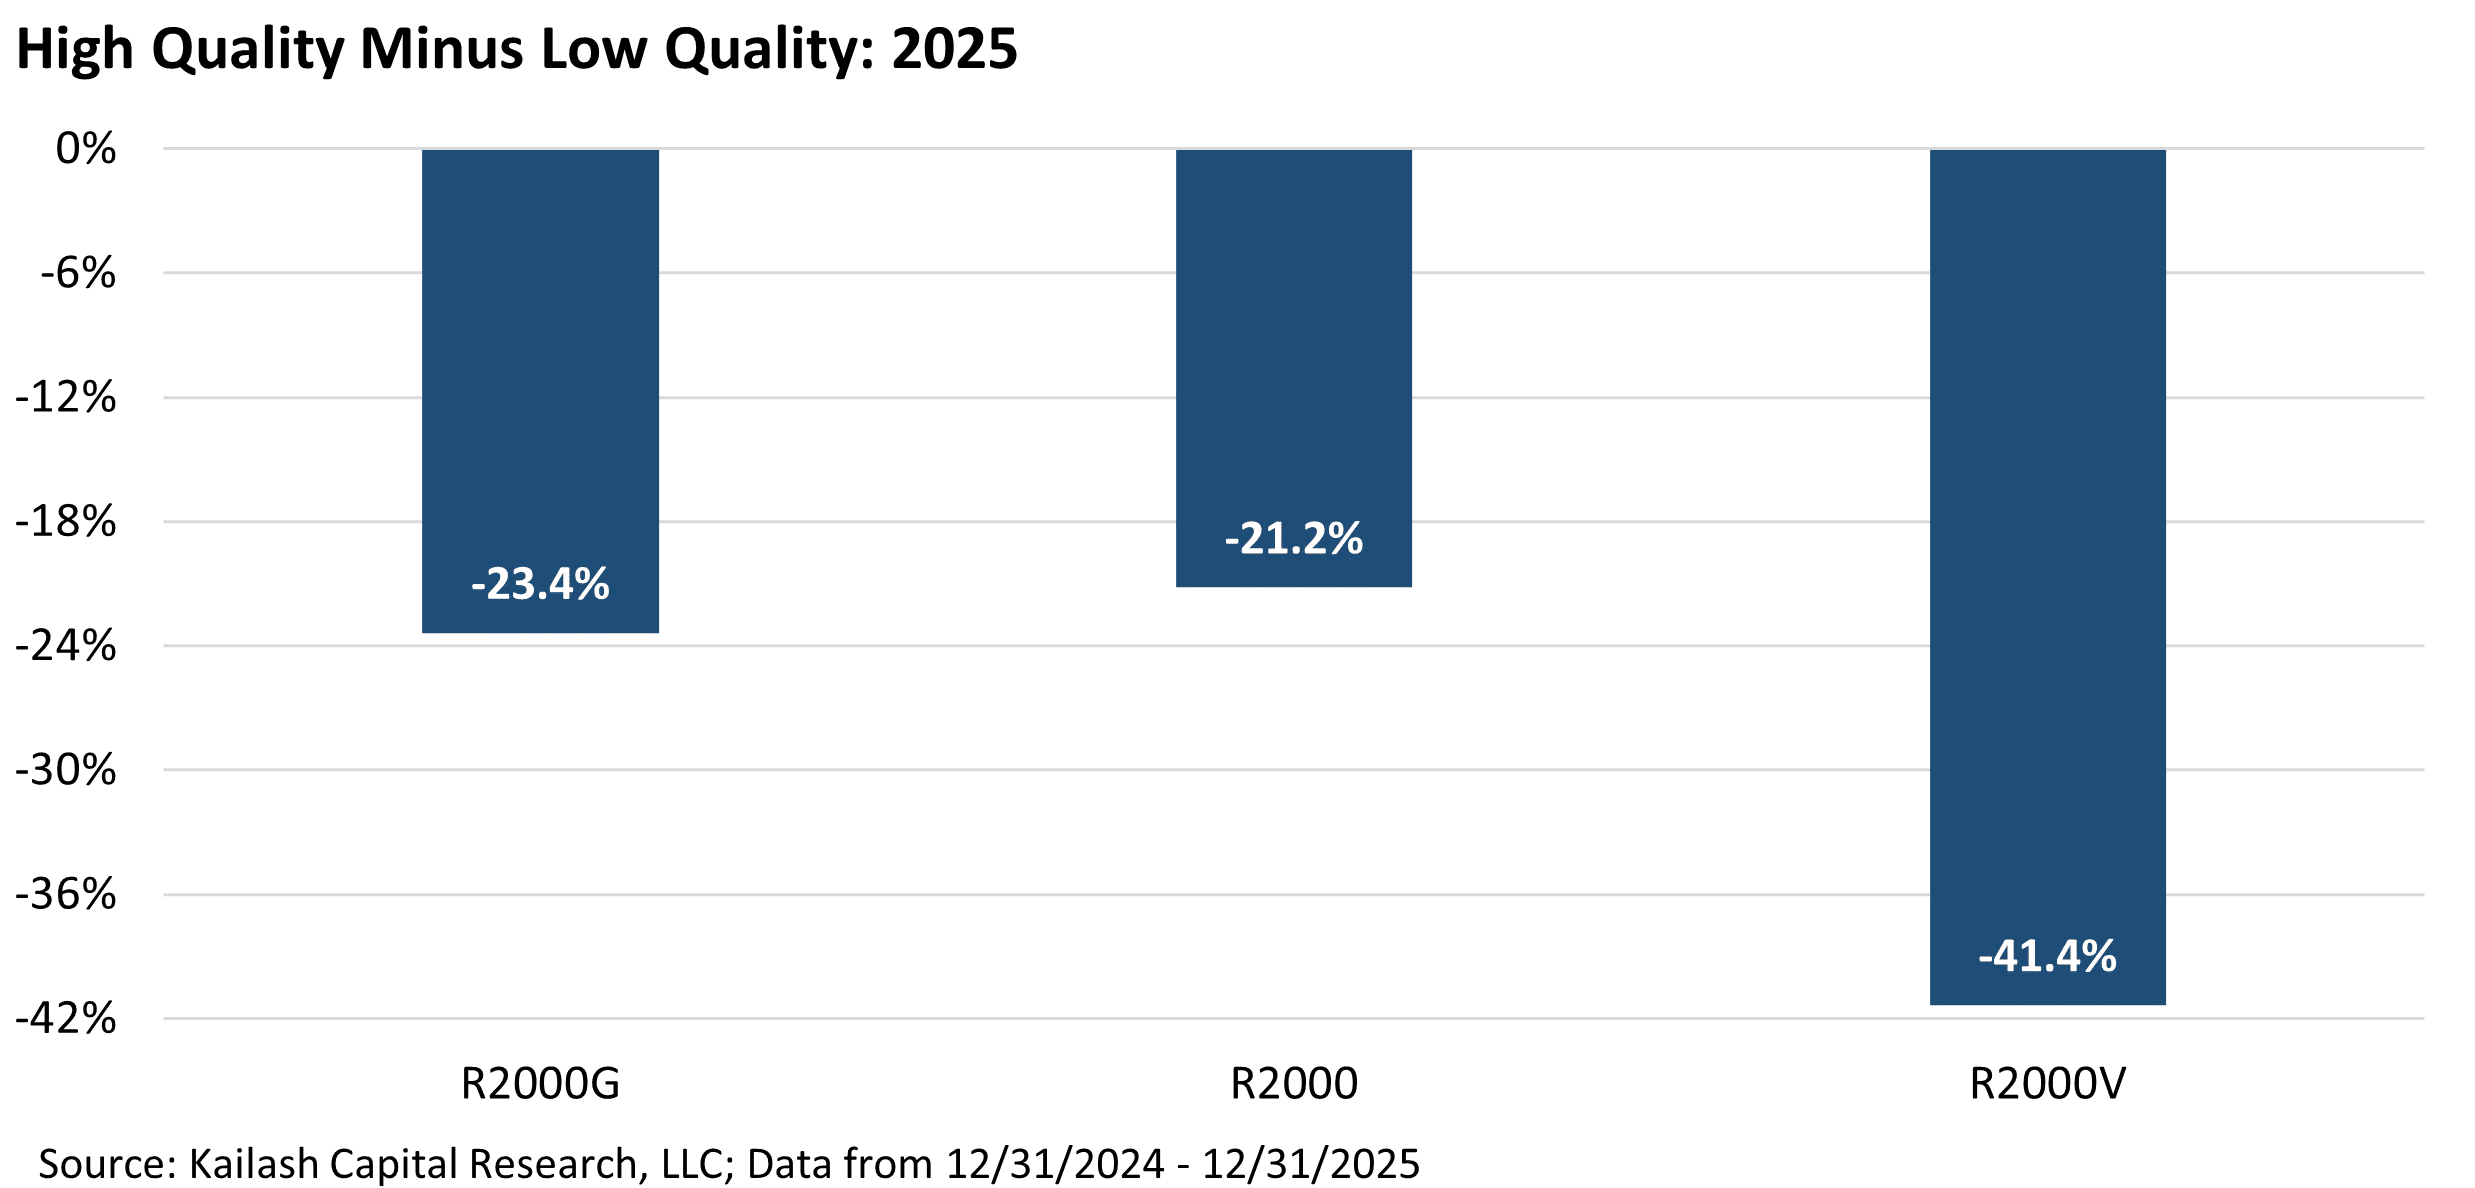
Chart 13: High Quality – Low Quality, The Spread Continues to Widen
- High-quality stocks trailed low-quality names dramatically in 2025.
- Value segment saw a 41.4% underperformance gap; Core and Growth also lagged by 21–23%.
- Current spreads suggest opportunity as extremes revert.
One of KCR’s more recent notes highlighted the capital misallocation underway via buybacks at high valuations. We have updated the two most important charts from that piece, and the picture has only grown darker.
Chart 14: Expensive Repurchasers – Price/Sales
- Firms buying back stock at high valuations are doing so near historic extremes.
- Current P/S of 12x is just shy of 2021’s 15x peak.
- History suggests poor returns follow such valuation levels.
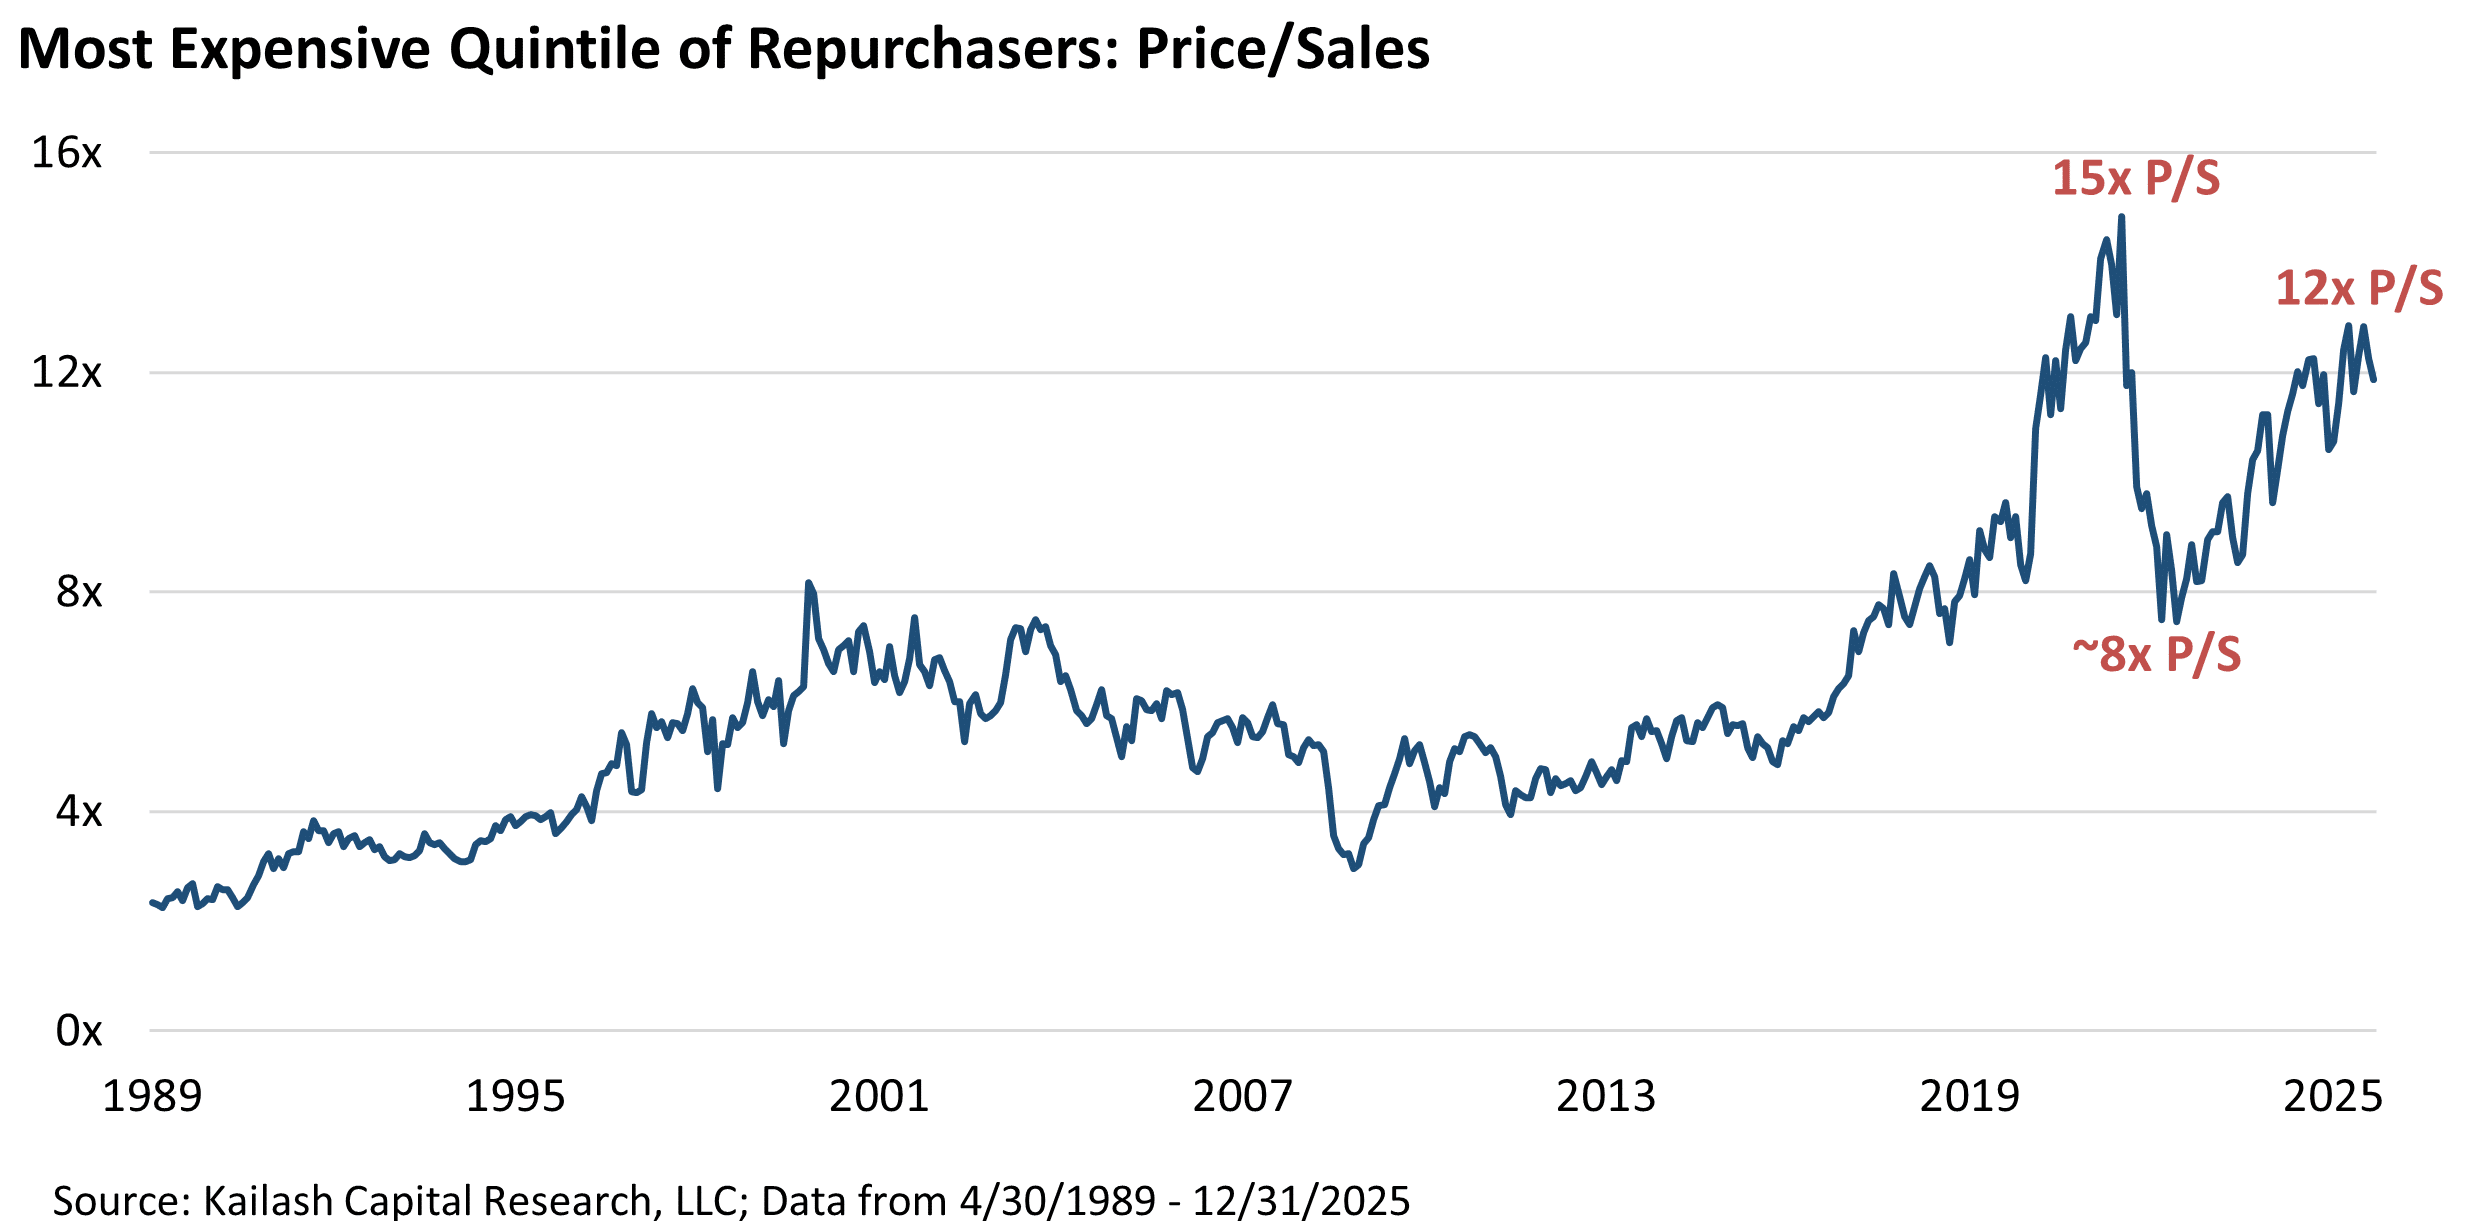
Chart 15: Buybacks by Valuation Quintile
The top valuation quintile accounted for 40% of all buybacks, or $413B in 2025.
- Bottom 80% spent ~$600B in total, despite representing most firms.
- Capital is heavily concentrated in the most speculative companies.
- Indicates poor capital allocation and elevated governance risk.

The charts don’t just suggest “late-cycle” conditions. They shout it. Concentration has intensified, speculation has broadened, and capital allocation is increasingly being dictated by index mechanics and buyback behavior rather than a rigorous review of fundamentals vs pricing. That combination can work for longer than expected, but historically it tends to end the same way: with mean reversion—often fast, and often painful.
- Mega-caps are in record territory: the largest 50 stocks pushed price-to-sales above 6x, while midcaps stayed near ~1.5x, widening a gap bigger than the dot-com era.
- Relative valuation is screaming: the largest-50 vs. midcap P/S ratio hit ~3.3x, above prior peaks (including 2000)—a level that has historically preceded sharp reversals.
- Aggregate market cap has become the story of just 16 stocks with market caps >$500B
- Those 16 stocks are now worth ~$29T in contrast to the thousands of stocks worth <$10B, firms are only ~$5.4T combined—an extreme imbalance in where “market exposure” actually sits.
- Speculation has a price tag: stocks trading >20x sales now represent about $9T in market cap—blowing through the 2000 and 2021 peaks, despite historically poor post-peak outcomes.
- Tech is >42% of market cap but <15% of sales, and the sector sports a precarious FCF/EV ratio of ~1%
- Quality got crushed by junk in 2025: low-quality vastly outperformed last year, even though the long-run data clearly shows that low quality loses to the benchmark—classic late-cycle behavior.
- Buybacks are concentrated in the most expensive stocks; those in the top valuation quintile were ~40% of buybacks (~$413B), with expensive repurchasers near historic P/S extremes.
Disclaimer
The information, data, analyses, and opinions presented herein (a) do not constitute investment advice, (b) are provided solely for informational purposes and therefore are not, individually or collectively, an offer to buy or sell a security, (c) are not warranted to be correct, complete or accurate, and (d) are subject to change without notice. Kailash Capital Research, LLC and its affiliates (collectively, “KCR”) shall not be responsible for any trading decisions, damages, or other losses resulting from, or related to, the information, data, analyses or opinions or their use. The information herein may not be reproduced or retransmitted in any manner without the prior written consent of KCR. In preparing the information, data, analyses, and opinions presented herein, KCR has obtained data, statistics, and information from sources it believes to be reliable. KCR, however, does not perform an audit or seek independent verification of any of the data, statistics, and information it receives. KCR and its affiliates do not provide tax, legal, or accounting advice. This material has been prepared for informational purposes only and is not intended to provide, and should not be relied on for tax, legal, or accounting advice. You should consult your tax, legal, and accounting advisors before engaging in any transaction.
Nothing herein shall limit or restrict the right of affiliates of KCR to perform investment management or advisory services for any other persons or entities. Furthermore, nothing herein shall limit or restrict affiliates of KCR from buying, selling, or trading securities or other investments for their own accounts or for the accounts of their clients. Affiliates of KCR may at any time have, acquire, increase, decrease, or dispose of the securities or other investments referenced in this publication. KCR shall have no obligation to recommend securities or investments in this publication as a result of its affiliates’ investment activities for their own accounts or for the accounts of their clients.
© 2026 Kailash Capital Research, LLC – All rights reserved.
January 23, 2026 |
| Authors: Matthew Malgari, Nathan Przybylo, Dr. Sanjeev Bhojraj and John Durkin
January 23, 2026
Authors: Matthew Malgari, Nathan Przybylo, Dr. Sanjeev Bhojraj and John Durkin