How Our Recent Research Note Unearthed False Financials
We recently wrote a bullish piece on Cardinal Health (CAH). The work caught the attention of an investing legend who founded and ran one of the most successful money managers we know. His view? Cardinal Health was a low-quality company and deserved to be cheap.
KCR takes the “other side” of investors like him with great caution. On a Friday night, KCR’s research team engaged in a lively two-hour debate with him. The work and dialogue stretched into Saturday and Sunday.
We eventually discovered that the disparity in views was caused by the failure of two separate AI-driven products. Sold to financial professionals and institutions as efficiency tools, both were unable to execute a simple calculation. We’re not in the rock-throwing business so names will be withheld.
One tool claims that it uses AI to read footnotes and “correct” financial data. The other claims you can enter sophisticated financial questions, and it will provide accurate answers based on training done on vast amounts of financial statements. So what happened?
Get our insights direct to your inbox: SUBSCRIBE
Both tools rendered wildly inaccurate calculations for “Return on Invested Capital” (“ROIC”)[1] for CAH. This is a basic measure of how much money a firm needs to generate profits. Generally speaking, firms that require small amounts of capital to generate large profits are viewed as higher quality (think MSFT) than those that require large amounts of capital to generate profits (think airlines).
Working with our partners over the years, KCR has developed five methods of calculating ROIC as different investors have different preferences. But the AI-driven tools were returning numbers that we could not replicate. After much sleuthing, we figured out that one was pulling in the wrong data from the wrong quarterly reports. The good news about that tool is it was “reliably wrong.” The other tool’s failure appears to be the function of it being a terrible product with a failed methodology.
With the inquiring investors’ permission, this paper will:
- Set the record “straight” on Cardinal Health
- Demonstrate that high-quality stocks are as overvalued today as they were in 1999
- While showing that active management can help investors purchase top-quality stocks at cheap prices
If that third bullet sounds like a “free lunch,” we would agree. Investor preference for certain (read “AI”) high ROIC, high-quality stocks has left many of the market’s highest ROIC companies trading for cheap. Cardinal Health, CAH, is just one of many such examples. Let’s jump in.
For this paper, we used the definition of ROIC, which we have found to be the most common. You can see it in the Appendix at the end, as well as the four other methods we track. For subscribers who would like to discuss seeing the data in different ways, please reach out. As always, we love to engage with our readers.
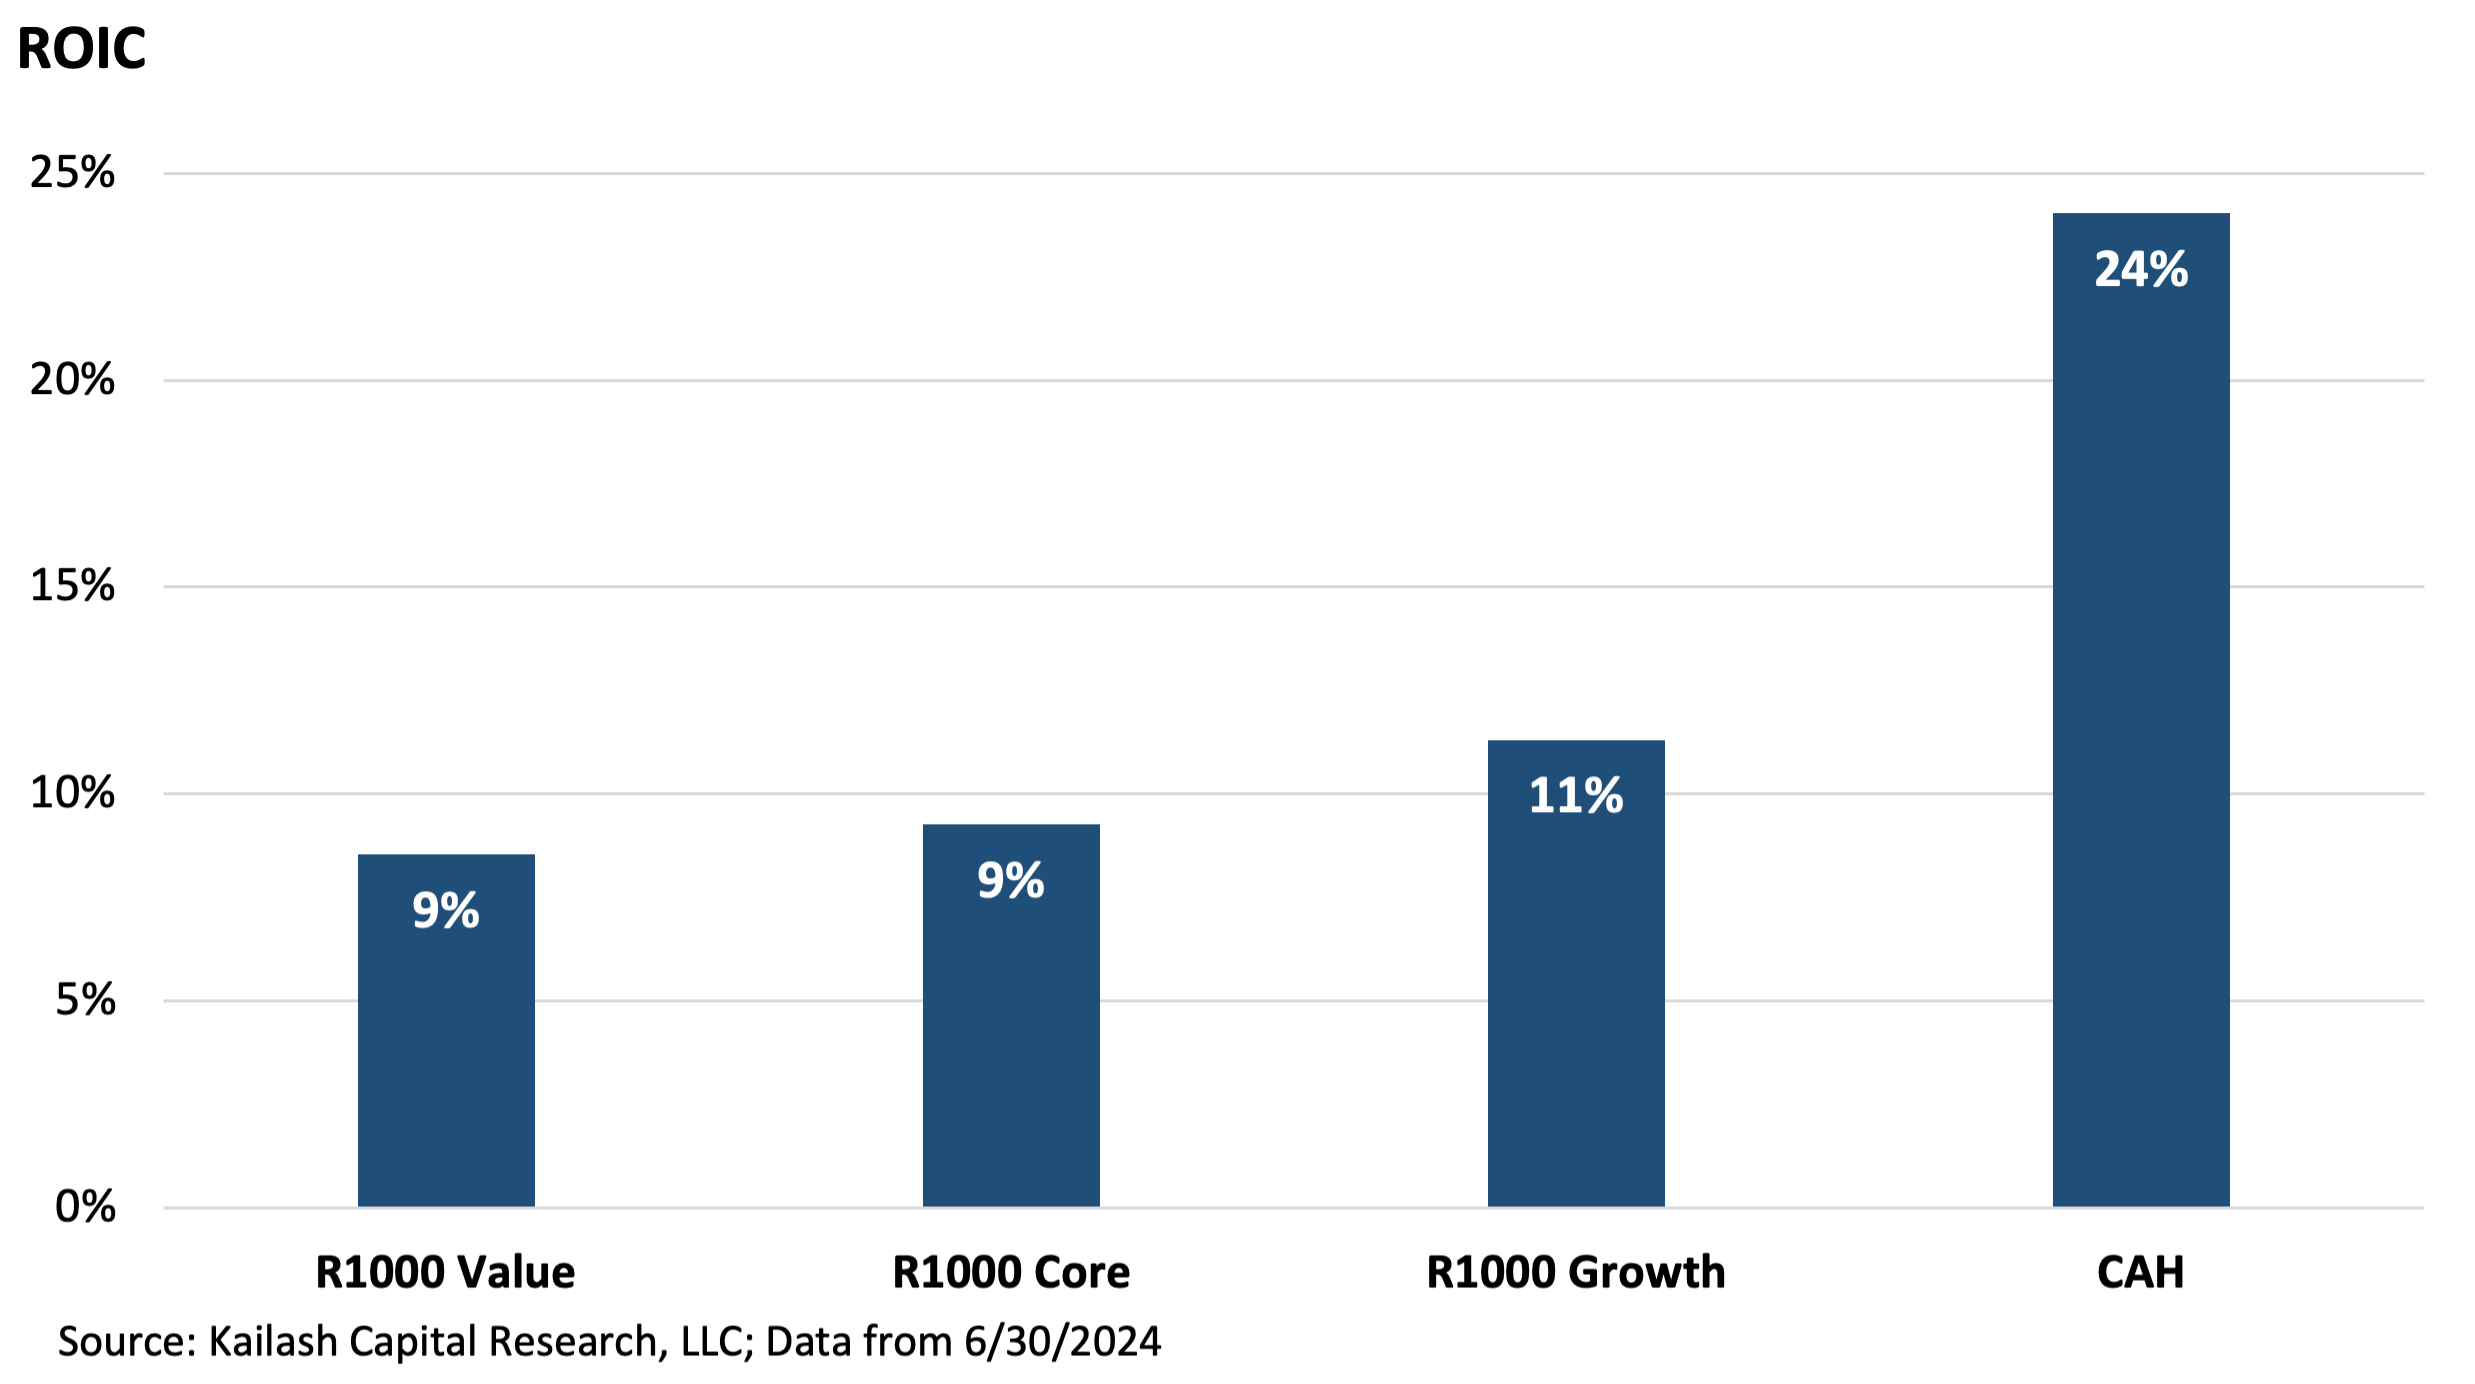
The chart below shows the following, from left to right:
- First bar: the Return on Invested Capital (ROIC) of the average firm in the R1000 Value Index is 9%
- Second bar: the ROIC of the average firm in the R1000 Index is also 9%
- Third bar: the ROIC of the average firm in the R1000 Growth Index is 11%
- Last bar: the ROIC of Cardinal Health, CAH, is 24%
That’s right. Cardinal Health has over 2x the ROIC of the Russell Value, Core and Growth benchmarks.
With the indexes now duly reported, let’s dig a little deeper. The chart below takes the entire large-cap universe and breaks it into five quintiles of ROIC. The left most bar shows that the 20% of stocks with the lowest ROIC (Q1) are money losers – with a -19% ROIC. The 20% of the highest quality stocks, the fifth quintile (Q5), generate a 35% ROIC.
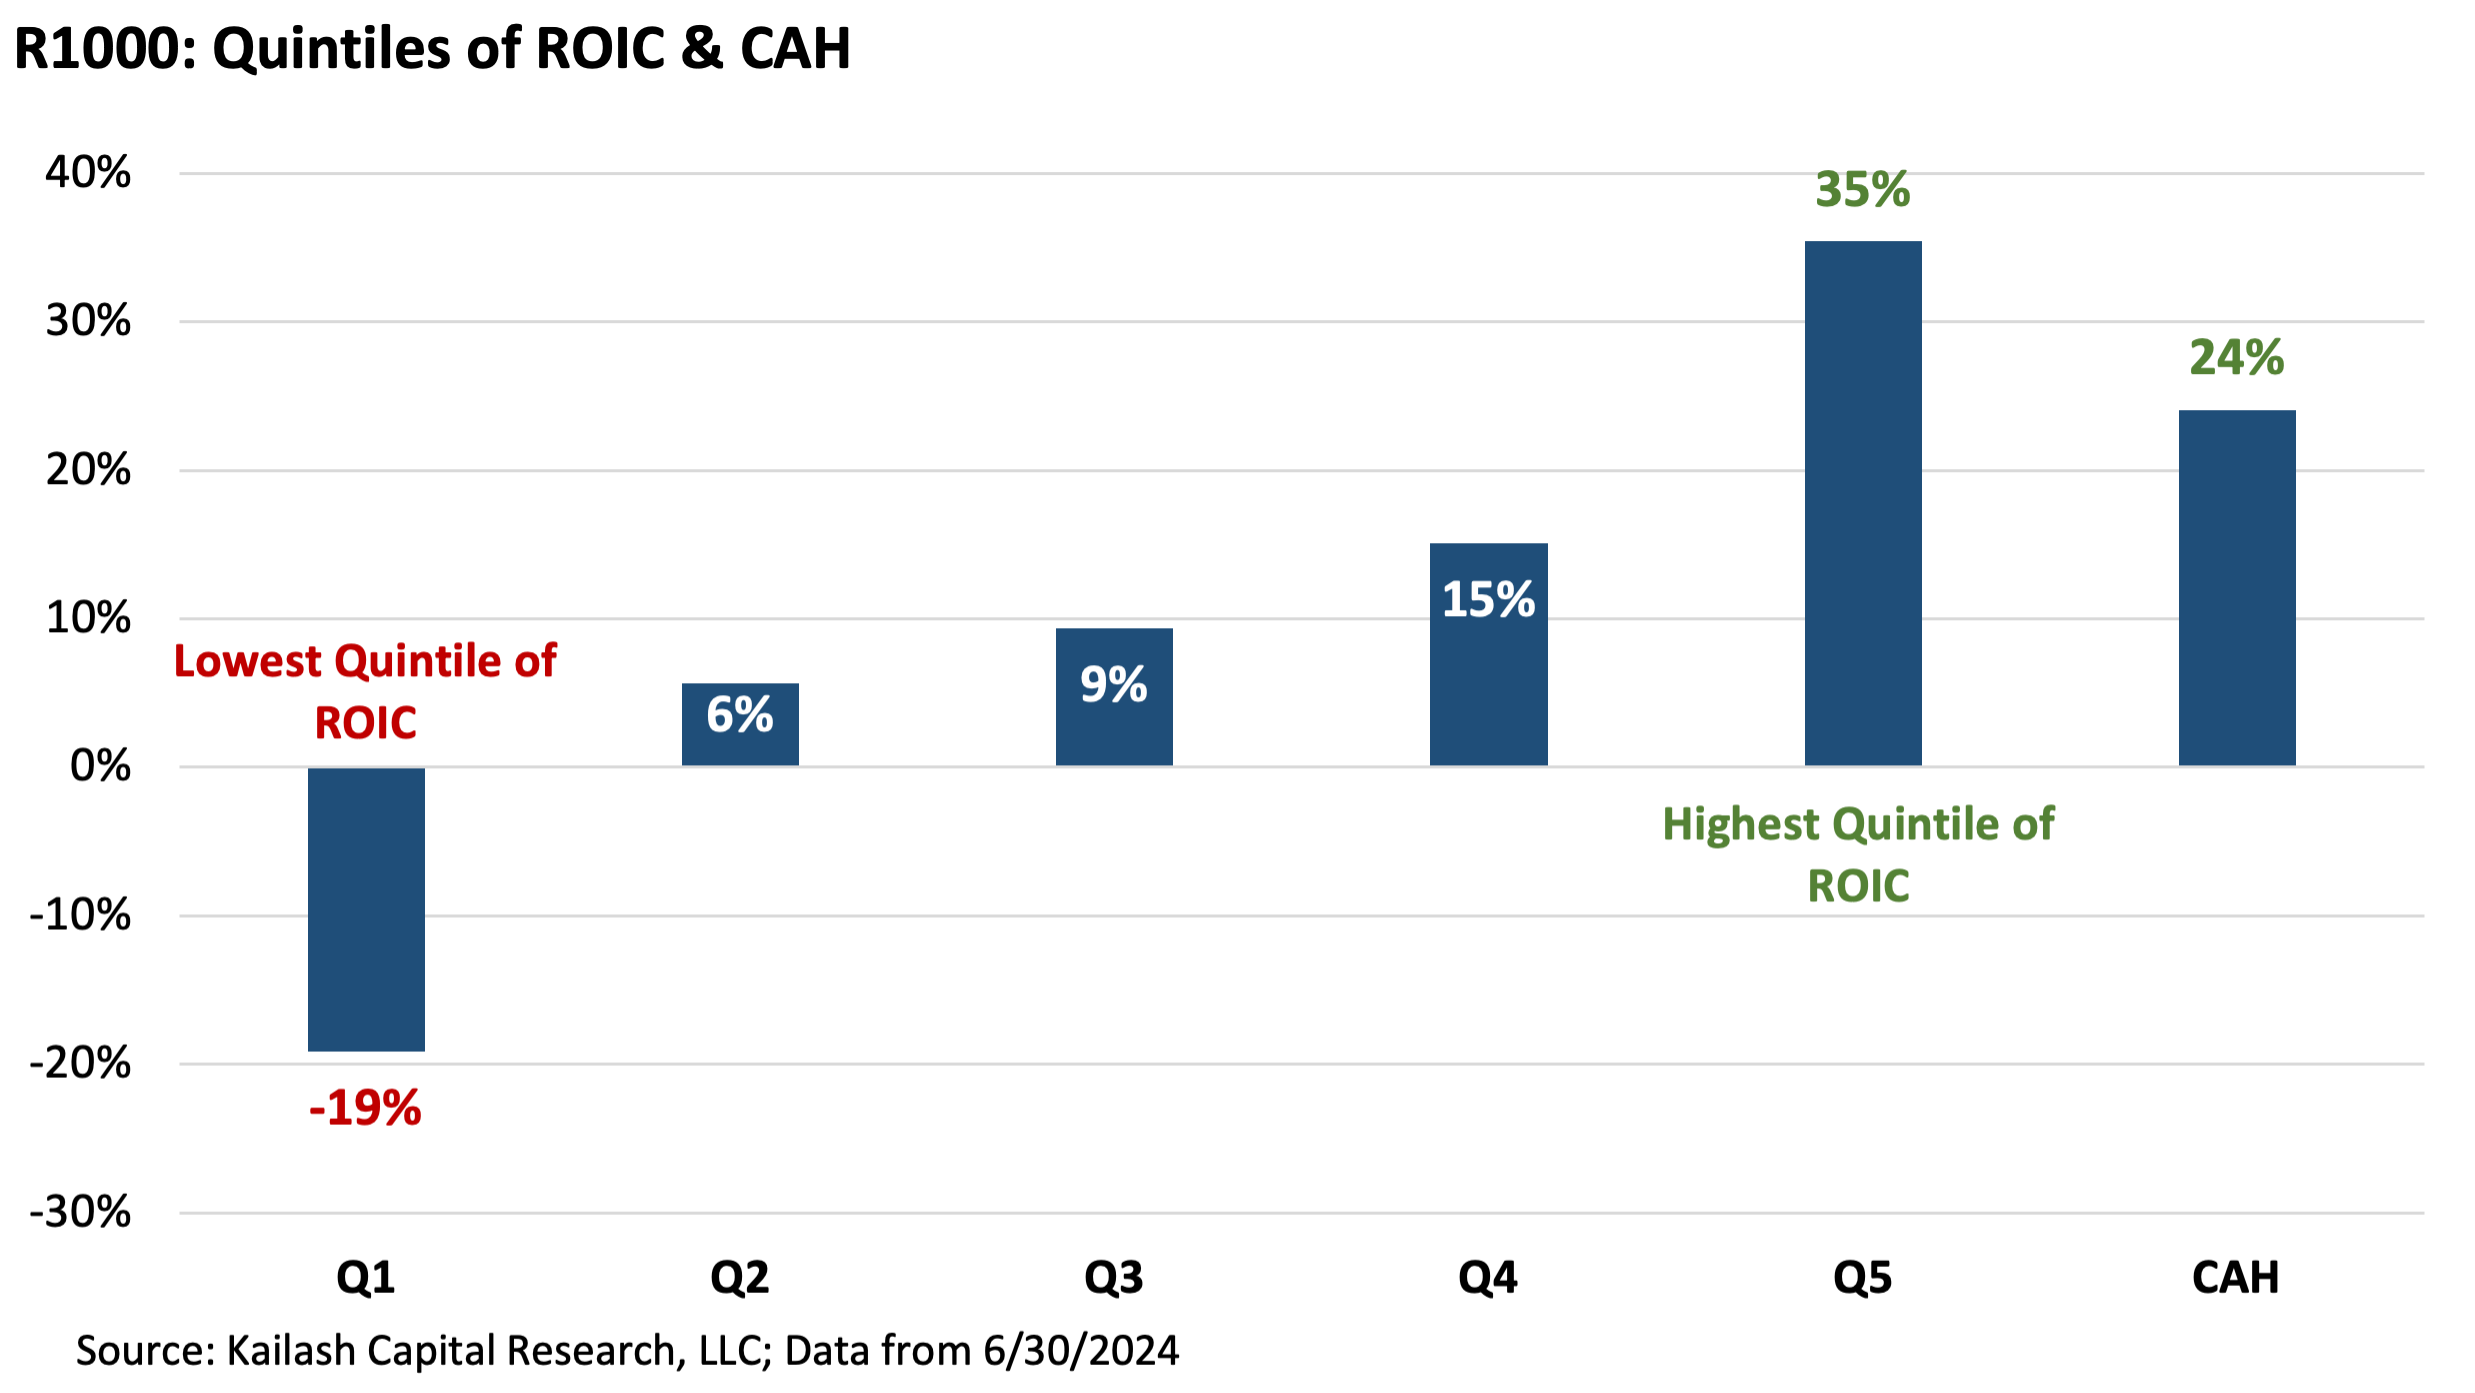
The last bar on the right is CAH, which has a ROIC of 24%. For context, a ROIC of 24% puts CAH firmly in the top quintile, or 20% of stocks (CAH is in Q5). Quintile 5 includes all firms with ROICs above 19%.
As always, what you pay matters. Pay too much for a high-quality stock, and it can become a very bad investment. Just see our note on Apple, Coke & Warren Buffet if you need convincing.
So how good a job is the market doing valuing “quality” as measured by ROIC? In our view, the indexing mania has made a total hash of things.
The chart below shows the price-to-sales multiple (P/S) of each quintile of ROIC, from lowest quality (low ROIC) to best.


Disclaimer
The information, data, analyses, and opinions presented herein (a) do not constitute investment advice, (b) are provided solely for informational purposes and therefore are not, individually or collectively, an offer to buy or sell a security, (c) are not warranted to be correct, complete or accurate, and (d) are subject to change without notice. Kailash Capital Research, LLC and its affiliates (collectively, “KCR”) shall not be responsible for any trading decisions, damages, or other losses resulting from, or related to, the information, data, analyses or opinions or their use. The information herein may not be reproduced or retransmitted in any manner without the prior written consent of KCR. In preparing the information, data, analyses, and opinions presented herein, KCR has obtained data, statistics, and information from sources it believes to be reliable. KCR, however, does not perform an audit or seek independent verification of any of the data, statistics, and information it receives. KCR and its affiliates do not provide tax, legal, or accounting advice. This material has been prepared for informational purposes only and is not intended to provide, and should not be relied on for tax, legal, or accounting advice. You should consult your tax, legal, and accounting advisors before engaging in any transaction.
Nothing herein shall limit or restrict the right of affiliates of KCR to perform investment management or advisory services for any other persons or entities. Furthermore, nothing herein shall limit or restrict affiliates of KCR from buying, selling, or trading securities or other investments for their own accounts or for the accounts of their clients. Affiliates of KCR may at any time have, acquire, increase, decrease, or dispose of the securities or other investments referenced in this publication. KCR shall have no obligation to recommend securities or investments in this publication as a result of its affiliates’ investment activities for their own accounts or for the accounts of their clients.
© 2023 Kailash Capital Research, LLC – All rights reserved.
July 26, 2024 |
| Authors: Matthew Malgari, Nathan Przybylo, Dr. Sanjeev Bhojraj and John Durkin
July 26, 2024
Authors: Matthew Malgari, Nathan Przybylo, Dr. Sanjeev Bhojraj and John Durkin