The research published in this newsletter is organized and authored by a group of fund managers and researchers who have over 90 years of combined experience and have worked together for over 14 years. As long-time readers know, our sister company, L2 Asset Management, runs a collection of long-only as well as long/short products. After a brutal 2018, 2019, and 2020, that represented the most speculative and hence worst stretch of performance in our collective careers, the “payback” from 2021 to today has been remarkable.
Get our insights direct to your inbox: SUBSCRIBE
Our market neutral products – one that is long and short nearly identical amounts [1] – has put up annualized returns of 10% [2] per year vs. the S&P 500 at nearly 14% since the end of 2020. And it has done this despite having near-zero correlation to the popular long-only benchmark. [3] After a stretch of abnormally bad returns we have been enjoying a period of strong returns.
There is a great deal to suggest that long/short portfolios – which nearly went extinct by 2020 – may become a critical component for diversifying and protecting investors’ wealth in the years to come. In 2020 and 2021 the KCR team published a blizzard of research highlighting the ludicrous state of “60% equities and 40% bonds.” Our point was that bonds offered tremendous risk and no reward, an issue we dubbed the duration crisis. [4]
With fixed income yields approaching zero, there was no rational reason to believe bonds were a good bet. By the end of 2021, if you lent the US government money for a decade, the most you could make was 1.5%, nominal. At the time, these bonds offered investors a negative real yield of -5.5% as CPI was running at 7%.
We took it a step further and highlighted that despite the generally accepted view that bonds were negatively correlated with stocks – and hence provided a hedge – that historically the data showed the two asset classes were actually positively correlated.
The chart below shows that the correlation between bonds and stocks spiked back to levels last seen prior to the dot.com crash. When the line is above zero, it means stocks and bonds are moving together. Contrarily, when the line is below zero, stocks and bond returns are diverging, ie work as a hedged investment. What lies ahead is anyone’s guess.

Why does this matter to technology investing today?
KCR’s model portfolios operate without sector or tracking error constraints. This, in turn, creates an amplified version of the views we often express in our asset management products. [5]
Since our firm’s founding in 2010, technology has been a powerhouse sector on the long side for all our products.
How times have changed.
The chart below shows the hypothetical exposure of a 100% long/100% short market neutral book using KCR’s Large Cap model portfolios.
The navy blue line below shows our long exposure in the technology sector was above 50% between 2014 and 2019 but has since collapsed to a far more modest 32%.
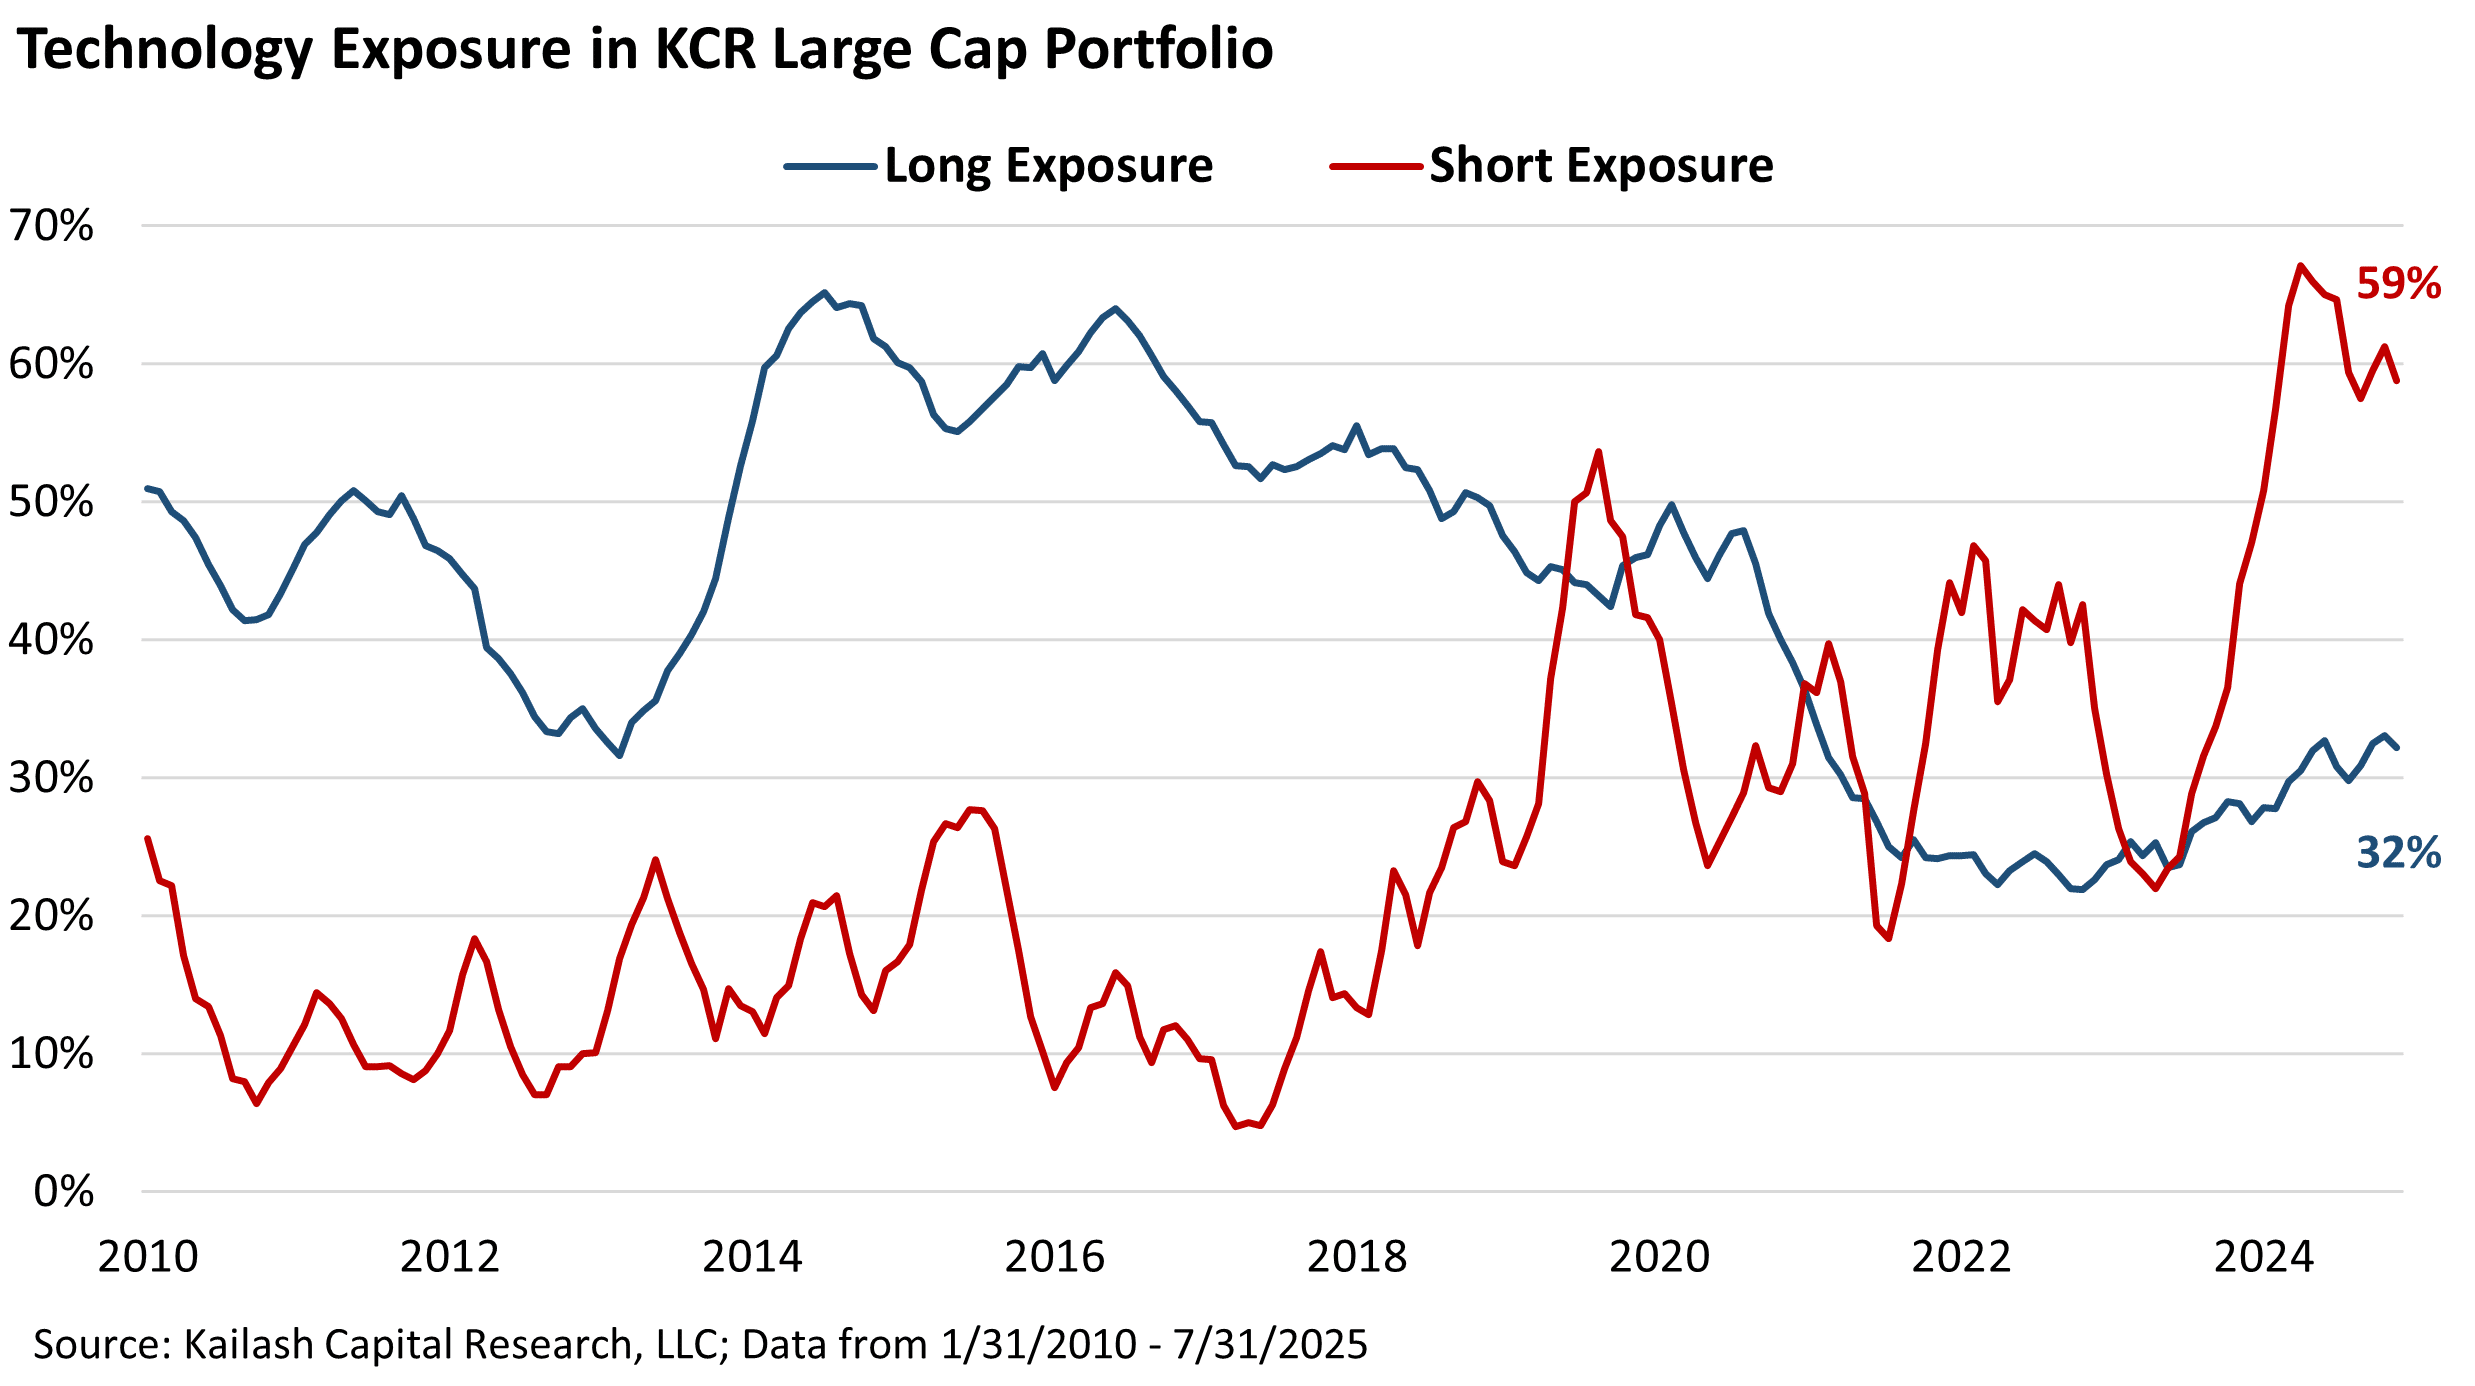
Contrarily, the red line shows our model portfolio’s short exposure in technology since KCR’s founding. You can see that today, 59% of our short model portfolio is made up of tech stocks.
Effectively, our evidence-based stock selection process has swung from unambiguously bullish tech to record levels of bearishness.
The impact is even more dramatic in KCR’s Small & Mid Cap long and short model portfolios. In the Small & Mid Cap space, our Technology Long exposure is virtually non-existent compared to our ~30% weight through 2016. As a gentle reminder, a 30%+ sector bet over nearly 6 years is no small thing.
Today, only 5% of our SMID Long book is in Tech.
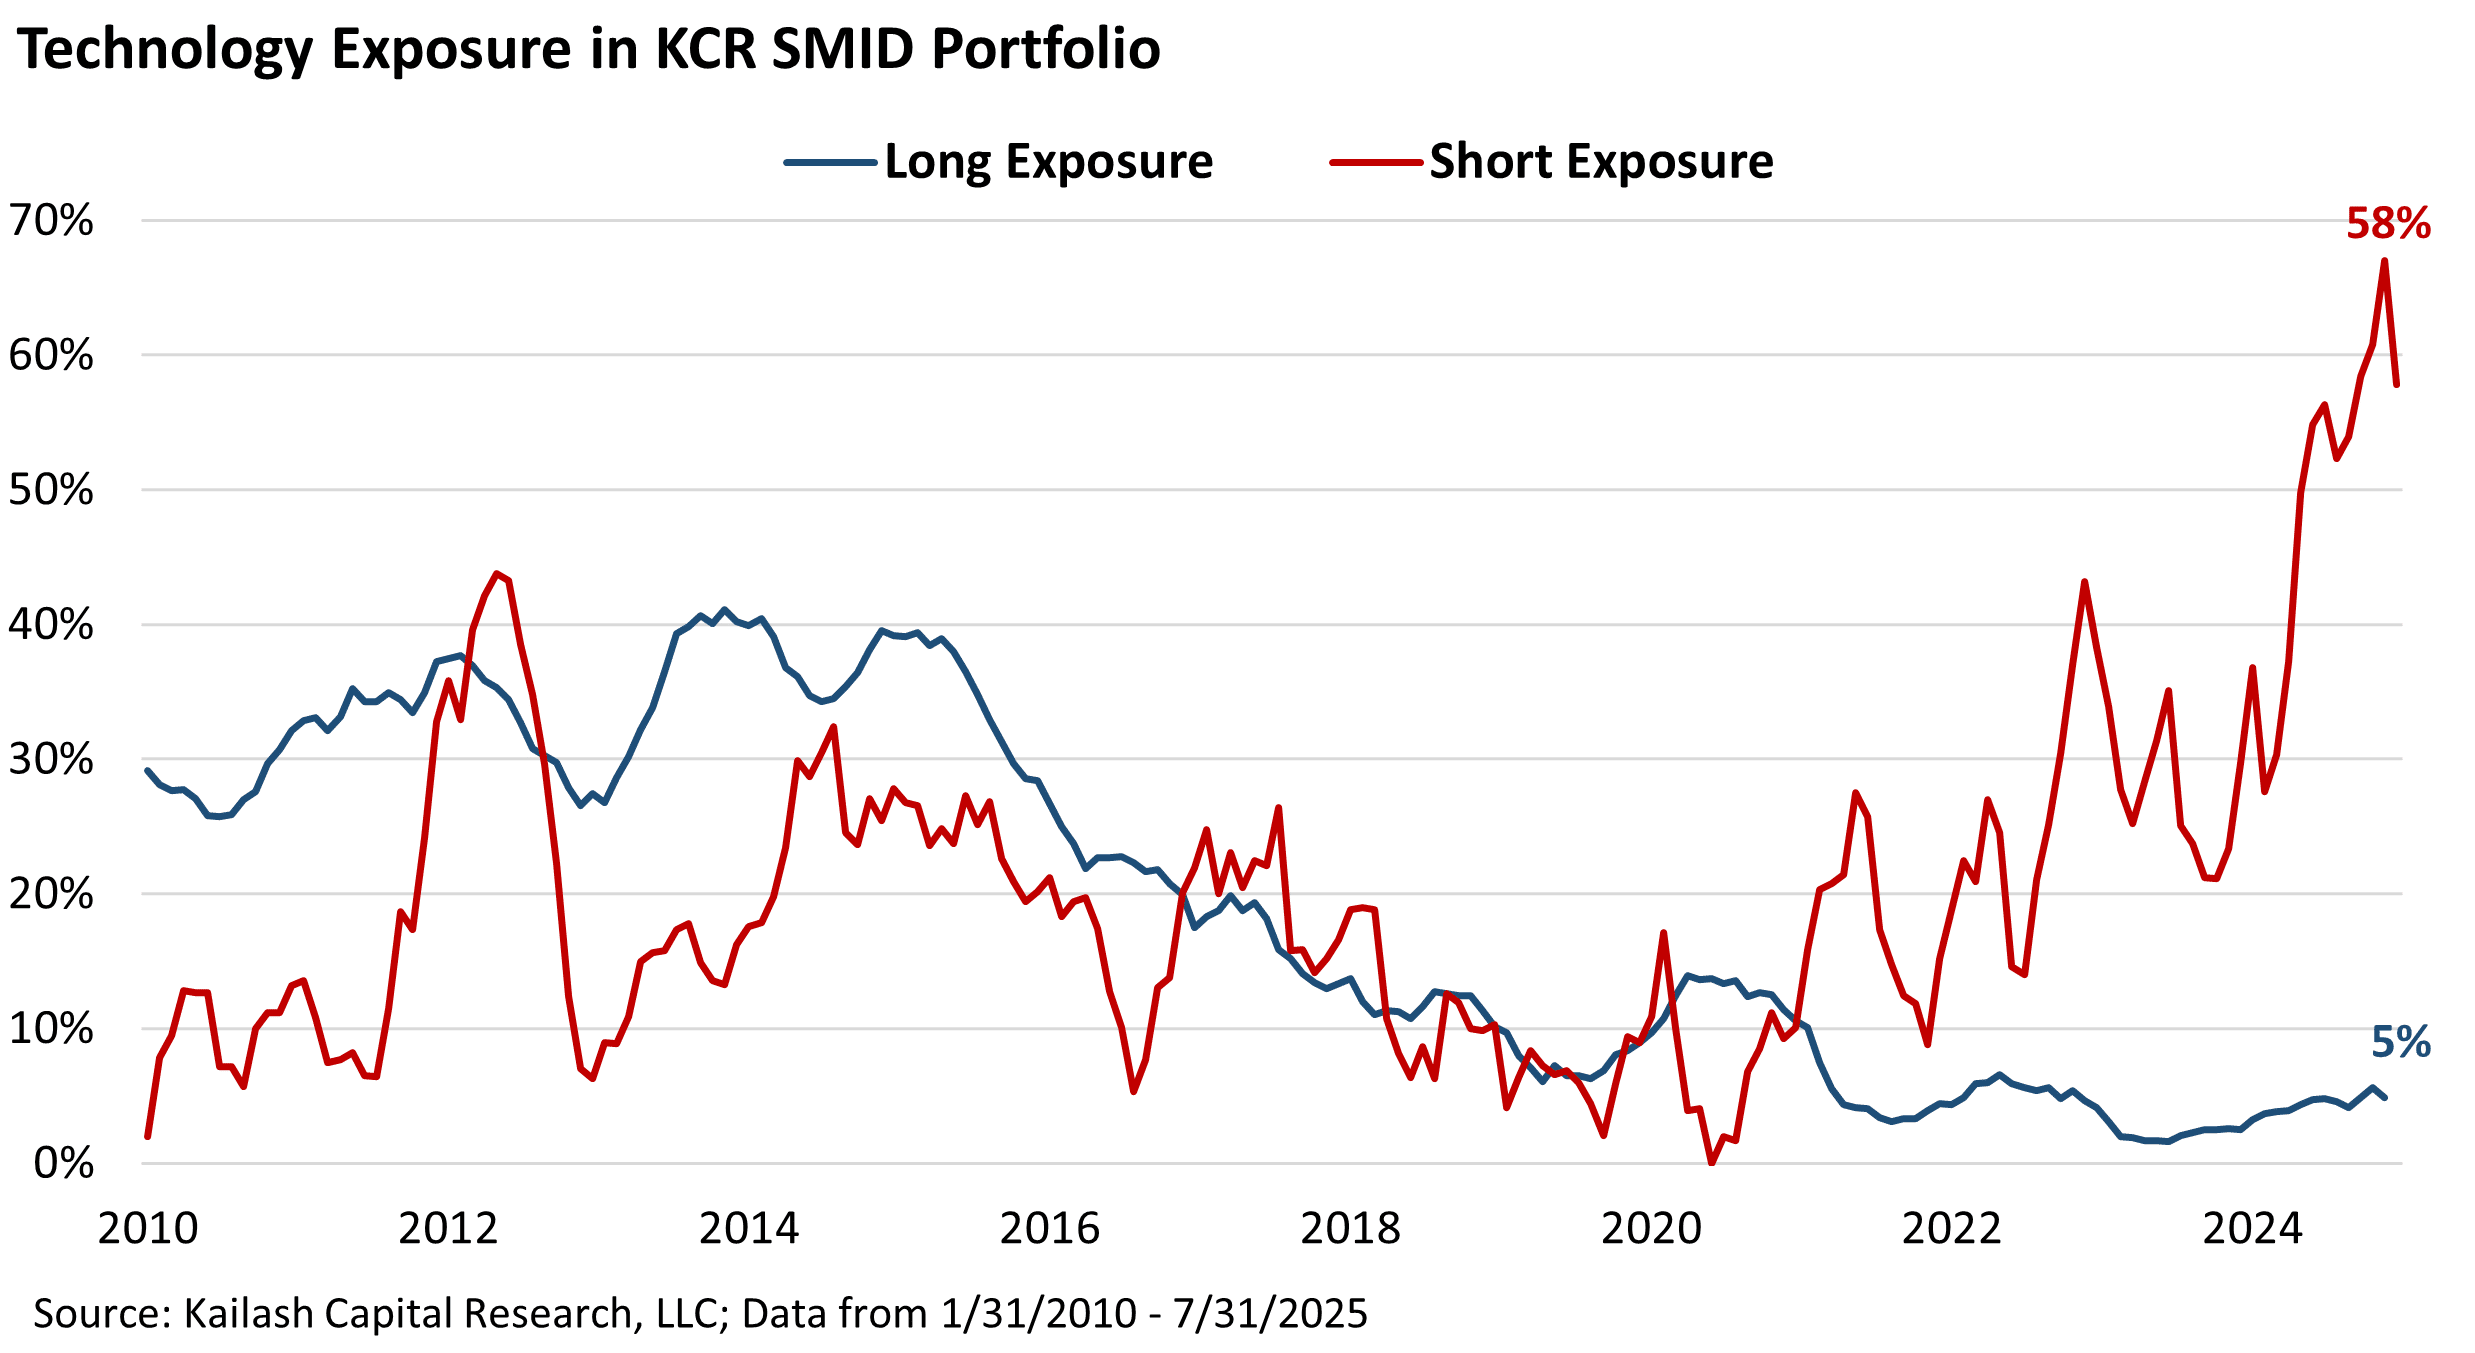
The red line shows our Small & Mid Cap short model portfolio’s exposure to Tech. Between 2010 and 2020, you may notice that our short exposure in Tech was ~equivalent to our long exposure. Even more notable, in the Covid Crash, our short book had virtually no exposure to Technology.
Today 58% of the Small & Mid Cap short model portfolio are IT names. To new readers, our comprehensive, evidence-based ranking methodologies contemplate everything from valuation, balance sheets, earnings quality and managements’ track record of capital allocation. Equally important, unlike many sell side quantitative models that re-shuffle their positions monthly, if not daily, our model portfolios are slow moving and typically have holding horizons no shorter than 1 year.
Important note for DIY Financial Advisors: Being Long or Short 58% in any one sector is a great way to look like a genius or a fool in short order!
Below we present the fundamental characteristics of the Tech we like, and tech we dislike.
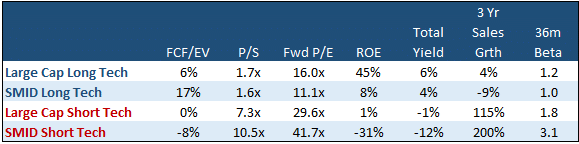 Source: Kailash Capital Research, LLC; Data from 7/31/2025
On the following pages, we present our Top 10 Ranked Long and Bottom 10 Ranked Short Tech names for Large Cap and SMID.


Disclaimer
The information, data, analyses, and opinions presented herein (a) do not constitute investment advice, (b) are provided solely for informational purposes and therefore are not, individually or collectively, an offer to buy or sell a security, (c) are not warranted to be correct, complete or accurate, and (d) are subject to change without notice. Kailash Capital Research, LLC and its affiliates (collectively, “KCR”) shall not be responsible for any trading decisions, damages, or other losses resulting from, or related to, the information, data, analyses or opinions or their use. The information herein may not be reproduced or retransmitted in any manner without the prior written consent of KCR. In preparing the information, data, analyses, and opinions presented herein, KCR has obtained data, statistics, and information from sources it believes to be reliable. KCR, however, does not perform an audit or seek independent verification of any of the data, statistics, and information it receives. KCR and its affiliates do not provide tax, legal, or accounting advice. This material has been prepared for informational purposes only and is not intended to provide, and should not be relied on for tax, legal, or accounting advice. You should consult your tax, legal, and accounting advisors before engaging in any transaction.
Nothing herein shall limit or restrict the right of affiliates of KCR to perform investment management or advisory services for any other persons or entities. Furthermore, nothing herein shall limit or restrict affiliates of KCR from buying, selling, or trading securities or other investments for their own accounts or for the accounts of their clients. Affiliates of KCR may at any time have, acquire, increase, decrease, or dispose of the securities or other investments referenced in this publication. KCR shall have no obligation to recommend securities or investments in this publication as a result of its affiliates’ investment activities for their own accounts or for the accounts of their clients.
© 2025 Kailash Capital Research, LLC – All rights reserved.
August 7, 2025 |
| Authors: Matthew Malgari, Nathan Przybylo, Dr. Sanjeev Bhojraj and John Durkin
August 7, 2025
Authors: Matthew Malgari, Nathan Przybylo, Dr. Sanjeev Bhojraj and John Durkin