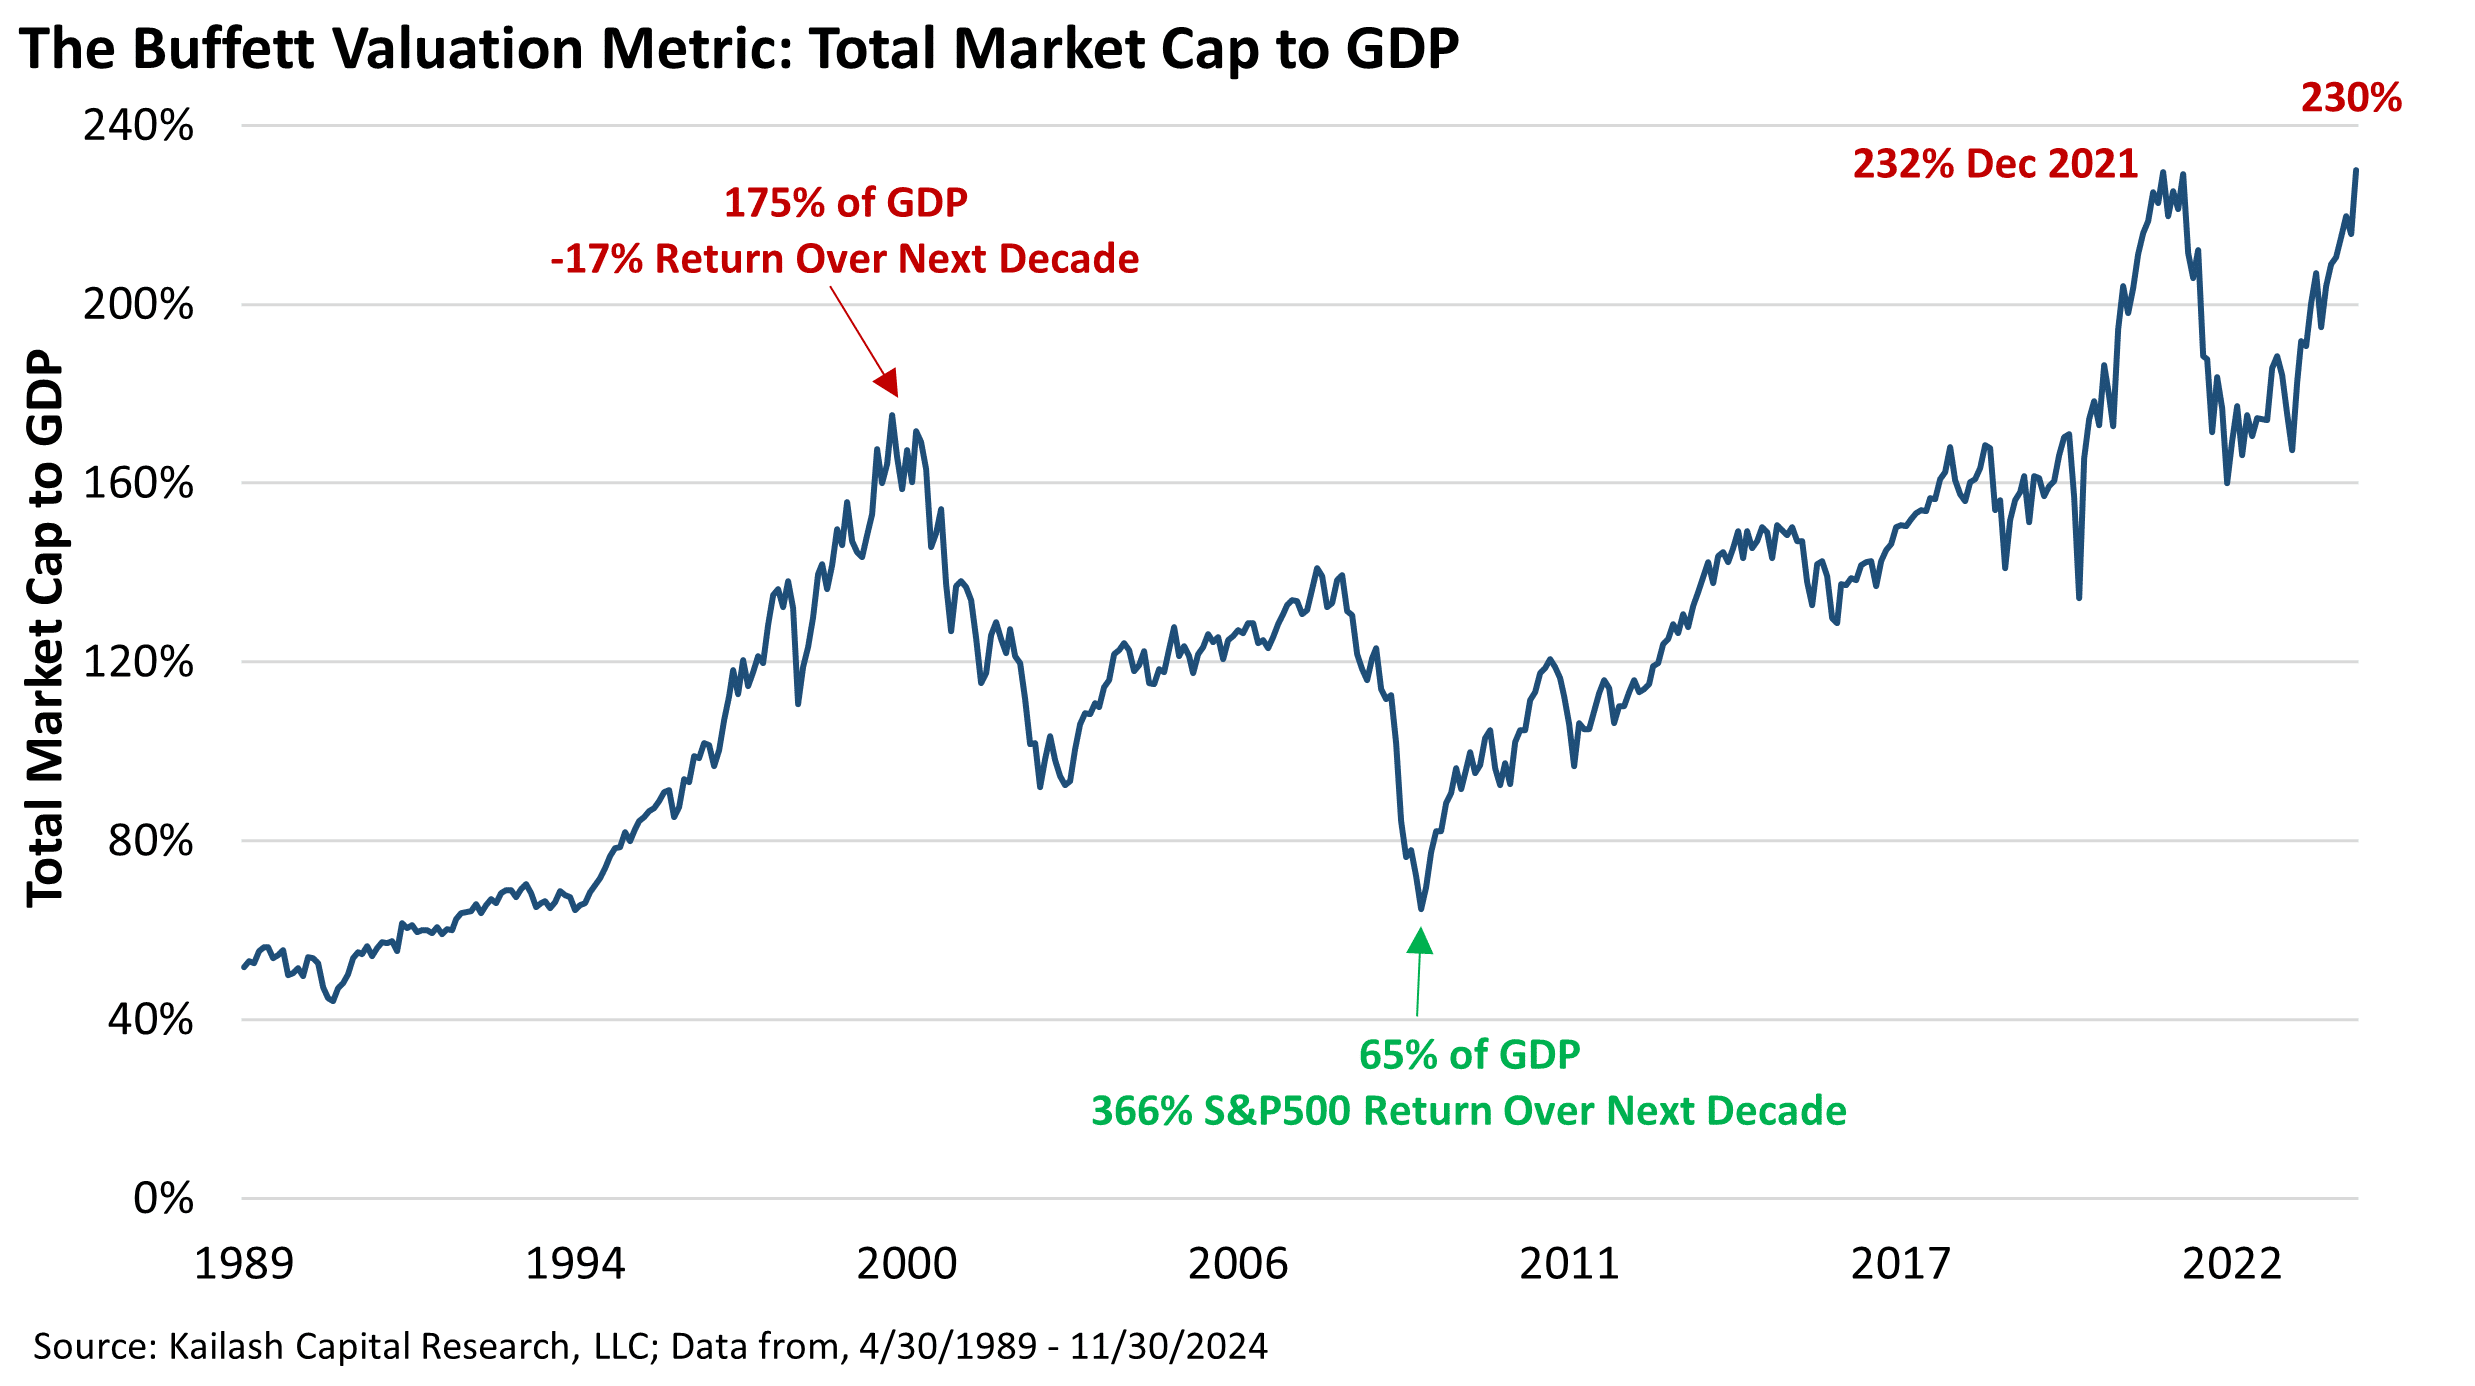
We’ve written a great deal about Warren Buffett’s favorite measure of market valuation market cap to GDP. Our research on the topic has demonstrated the ability of this simple metric to predict 10 year forward market returns.
Get our insights direct to your inbox: SUBSCRIBE
We also published a piece based on an interview Buffett gave in 1999 explaining the immutable logic of this seemingly simple method. In that piece we took Mr. Buffett’s thinking and turned it into a simple to use calculator that makes it easy for investors to see:
- How much future growth is baked into current market prices and
- Allows investors to see how different assumptions they might have would impact future returns.
Despite all this, some have continued to push back on Buffett’s methods. We were fortunate to find that McKinsey had published years of data explaining how asset values must flow from economic activity. We summarized their lengthy and detailed work which brought brutal clarity to the numerical truth of Mr. Buffett’s thinking.
Others are welcome to continue fighting with arithmetic truths, but we are not. The data is unforgiving.
The purpose of today’s piece is not to simply hammer home the-now-exhausting message that equities are expensive at the aggregate index level.
Rather we have bifurcated the data in such a way that we hope it helps our readers see what they already know: that the market’s overvaluation is concentrated within indexes. This is a problem that is being driven almost entirely by the 50 largest stocks in the market.
Before flipping the page, we ask you to look at the first and last data point on the chart above. The total US market cap to GDP ratio was at 53% in 1989 and is currently 230%.
The chart below shows the market cap to GDP of just the 50 largest stocks in the US. These 50 names are now valued at 110% of GDP. For context, that is higher than they were in 2021 and just over 400% higher than the trough in the last financial crisis of 2009.

The chart below shows another way to visualize the historically unprecedented valuation error in the market’s 50 largest stocks. The line merely divides the 50 biggest stocks market cap to GDP by the overall market cap to GDP. This shows what percentage of the total market’s valuation is being driven by the 50 largest stocks.


Disclaimer
The information, data, analyses, and opinions presented herein (a) do not constitute investment advice, (b) are provided solely for informational purposes and therefore are not, individually or collectively, an offer to buy or sell a security, (c) are not warranted to be correct, complete or accurate, and (d) are subject to change without notice. Kailash Capital Research, LLC and its affiliates (collectively, “KCR”) shall not be responsible for any trading decisions, damages, or other losses resulting from, or related to, the information, data, analyses or opinions or their use. The information herein may not be reproduced or retransmitted in any manner without the prior written consent of KCR. In preparing the information, data, analyses, and opinions presented herein, KCR has obtained data, statistics, and information from sources it believes to be reliable. KCR, however, does not perform an audit or seek independent verification of any of the data, statistics, and information it receives. KCR and its affiliates do not provide tax, legal, or accounting advice. This material has been prepared for informational purposes only and is not intended to provide, and should not be relied on for tax, legal, or accounting advice. You should consult your tax, legal, and accounting advisors before engaging in any transaction.
Nothing herein shall limit or restrict the right of affiliates of KCR to perform investment management or advisory services for any other persons or entities. Furthermore, nothing herein shall limit or restrict affiliates of KCR from buying, selling, or trading securities or other investments for their own accounts or for the accounts of their clients. Affiliates of KCR may at any time have, acquire, increase, decrease, or dispose of the securities or other investments referenced in this publication. KCR shall have no obligation to recommend securities or investments in this publication as a result of its affiliates’ investment activities for their own accounts or for the accounts of their clients.
© 2023 Kailash Capital Research, LLC – All rights reserved.
December 18, 2024 |
| Authors: Matthew Malgari, Nathan Przybylo, Dr. Sanjeev Bhojraj and John Durkin
December 18, 2024
Authors: Matthew Malgari, Nathan Przybylo, Dr. Sanjeev Bhojraj and John Durkin